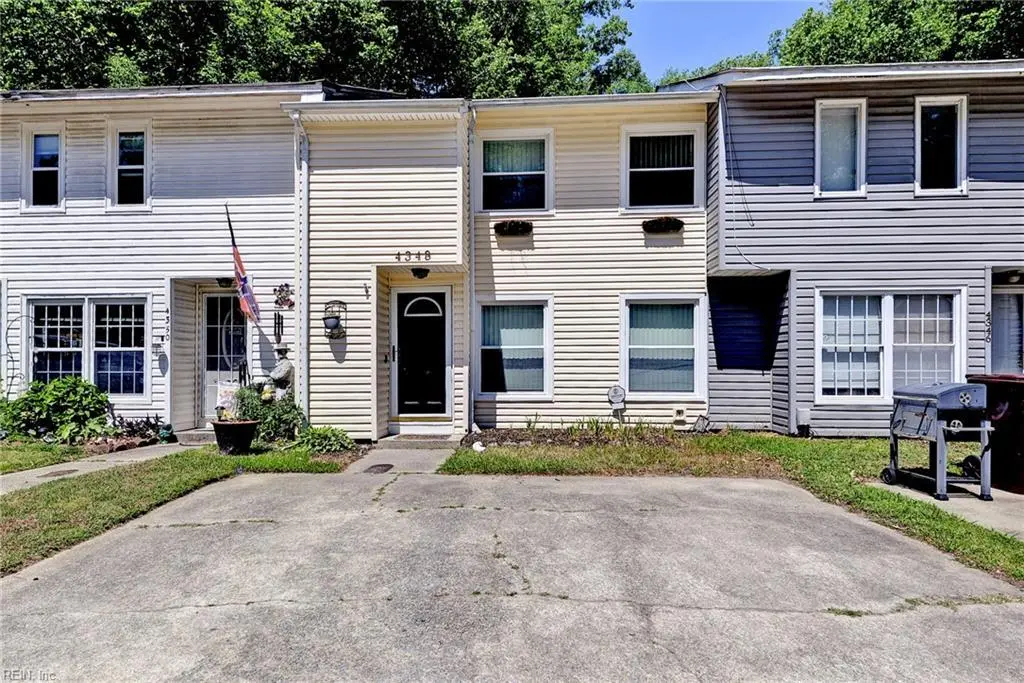
4348 Stafford Dr · Chesapeake, VA
Flood risk 3/10 · Minor
- FEMA flood zone
- X (unshaded)
- Chance of flooding over 30 yrs
- 0.12%
- Est. flood insurance / yr
- $507 – $1,088
Fire risk 1/10 · Minimal
- Est. fire insurance / yr
- $666 – $1,236
Heat risk 9/10 · Severe
- Hot days now (above 106°F)
- 7 days/yr
- Hot days in 30 yrs
- 16 days/yr
Wind risk 8/10 · Major
- Chance of severe wind over 30 yrs
- 80.0%
Air-quality risk 2/10 · Minimal
- Unhealthy air days now
- 1 days/yr
- Unhealthy air days in 30 yrs
- 3 days/yr
Risk factors via First Street. Map © Google.
Why this score? — see what drove the D- grade
The composite is a weighted blend of 9 inputs, each scored 0–100. Each bar is that input's sub-score; the figure is the points it added to the 100-point composite (weight × sub-score).
- Cash flow +11.3/30.0
- ARV discount +6.5/15.0
- Schools +5.8/10.0
- Rent growth +4.4/5.0
- Livability +3.5/5.0
- DSCR +3.3/10.0
- 1% rule +2.6/10.0
- Condition / age +2.5/5.0
- Appreciation +0.0/10.0
$245,000
🖨 Deal sheet (PDF) 📄 Offer letter ✓ Due diligence
Listing remarks
Move-in ready 2-bedroom, 1.5-bath townhouse with no association fees—a rare find! Major updates have already been taken care of, including a roof, HVAC system, replacement windows, and vinyl siding all just 2 years old. The kitchen features granite countertops and a brand-new range, perfect for everyday cooking and entertaining. Enjoy a spacious family room with a cozy wood-burning fireplace, and go through double French doors into your fully fenced backyard, ideal for relaxing or hosting guests. Conveniently located near the interstate, shopping, and dining, this home offers both comfort and accessibility.
Key facts
- 2 parking spots
- Built 1983
- Listed 20 days
Property features AI
Finance
- Other: Marsh view; Neighborhood: SILVERWOOD OAKS
- HOA & community: No HOA fees indicated
Exterior
- Parking: Off-street parking for 2 (driveway spaces)
- Utilities: City/county water; City/county sewer; Electric water heater
- Home design: Attached property; Traditional style; 2 stories; Slab foundation; Simple ownership
- Construction: Asphalt shingle roof
- Exterior features: Vinyl siding; Back yard fenced
Interior
- Kitchen: Electric range; Microwave; Dishwasher not listed; Refrigerator; Disposal
- Bedrooms: Master bedroom; Additional bedroom; No bedroom with full bathroom on first floor
- Flooring: Ceramic; Laminate
- Bathrooms: 1 full bathroom; 1 half bathroom
- Heating & cooling: Heat pump heating; Central air conditioning
- Interior features: Wood fireplace (1)
- Laundry & utility: Washer and dryer with hookups; Utility room
Neighborhood map
What this means for you Summary
Snapshot
- This is a 2-bed/2.0-bath townhouse listed at $245k.
Deal economics
- At list price, monthly cash flow is $-90 ($-1k/yr) — negative.
- To cash-flow at today's rent, offer at most $229k (6.5% below list).
- To meet the 1% rule (rent ≥ 1% of price), the offer needs to be $186k (24.2% below list).
- Recommended offer: $186k (24.2% below list) — sets the bar for 1% rule.
- Cap rate 5.9% vs local median 3.8% in Chesapeake — top-decile yield for the area; either an underpriced asset or a hidden risk that comps aren't pricing in. Stress-test before assuming the spread holds.
Location & tenants
- Location reads 70/100 on livability (#236 in VA) — a middle-class / working-renter tenant base. Strengths: employment A+, housing A+; Watch: crime C-, cost of living C-, amenities F.
- Chesapeake City Public School District (suburban): math 58% / reading 74% proficiency, ranked #31 of 131 in VA (top 24%) — acceptable for families but not a draw, mixed tenant base, ~2y average lease.
- Zoned schools: Western Branch Primary (813 students, 41% FRL); Western Branch High (math 71% / reading 84%, grade A-, #83 of 319 statewide, top 28%, 2,121 students, 37% FRL).
- Market conditions: Rents rising fast (+7.6%/yr); 234 active listings in the ZIP; 28 comparable units currently listed for rent nearby; rentals at typical pace (median 25d on market — plan ~3-4 weeks tenant-placement turnaround); 43% of comp listings sitting > 30 days — soft ceiling on asking rent; solid renter incomes; 597 units permitted in Chesapeake city in 2024 (0 in 5+ unit buildings).
Forward outlook
- Local home prices are declining (-3.0%/yr); year-one equity from $2k of loan paydown is wiped out by about $7k of value loss. Plan a longer hold.
- Chesapeake County population projected at +21% by 2050 — long-run rental-demand tailwind backs the buy-and-hold thesis.
Negotiation context
- It's been on market 20 days — a 2% lower offer ($241k) is reasonable based on typical stale-listing flexibility.
- 9 sale attempts since 4y ago with the ask held roughly flat each time — persistent listings suggest the price (not the market) is what's stuck; bring a comps-based counter.
Risks & watch-outs
- Climate carrying-cost: severe wind risk, 80% chance of damaging wind over 30y; extreme-heat days projected 7→16/yr by 2055 (HVAC capex compounding) — expect insurance premiums to compound above CPI over the hold.
Questions for the listing agent
- What do current leases actually rent for vs. the listed asking? Can we see a recent rent roll and the last 12 months of T-12 income?
- Is there a deadline driving the sale (1031 exchange, divorce, estate, relocation)? That informs how much negotiation room exists.
- Schools are A-rated — typically a magnet for longer-tenancy family renters. What's the average tenant stay here, and is there a school-zone premium baked into asking?
- The area grade is low — what's the realistic commute time and amenity access for the typical tenant pool here? Any planned neighborhood developments (good or bad) we should know about?
- What's the average days-on-market for RENTAL listings here right now (not sales)? A rising rental-DOM trend means longer vacancies and softer asking-rent achievability than the comps imply.
- What's the recent tenant-quality profile in this submarket — average credit score on applications, eviction rate, late-payment / NSF rate, and stable-employment percentage? A property-management company in the area should have these aggregated.
- How much new for-sale + rental construction is in the pipeline within 1–3 miles? Heavy new supply typically softens prices + rents 12–24 months out; constrained supply supports both.
Investment metrics
- 1% rule
- 0.76% ✗
- Cap rate
- 5.85%
- Cash-on-cash
- -1.58%
- DSCR
- 0.93
- GRM
- 11.0
CMA / ARV
- ARV (on-the-fly)
- $239,780
- Comps found
- 12
Show comp detail 12 sales within ~0.75 mi
| Address | Dist | Beds/Ba | Sqft | Sold | Price | $/sf | Match |
|---|---|---|---|---|---|---|---|
| 4319 Stafford Dr | 0.05mi | 3/1.5 (+1) | 1,262 (0%) | 1mo | $270,000 | $214 | 90 |
| 4323 Stafford Dr | 0.05mi | 2/1.5 | 1,186 (-6%) | 7mo | $245,000 | $207 | 80 |
| 4408 Dartmoor Ct | 0.05mi | 2/1.5 | 1,186 (-6%) | 10mo | $225,000 | $190 | 77 |
| 3601 Radford Cir | 0.18mi | 2/2.5 | 1,207 (-4%) | 8mo | $225,000 | $186 | 76 |
| 3441 Bruin Dr | 0.08mi | 2/1.5 | 1,186 (-6%) | 10mo | $231,750 | $195 | 76 |
| 3454 Bruin Dr | 0.12mi | 2/1.5 | 1,178 (-7%) | 7mo | $225,000 | $191 | 75 |
| 3331 Golden Oaks Ln | 0.53mi | 3/1.5 (+1) | 1,294 (+2%) | 6mo | $170,000 | $131 | 59 |
| 3231 Clover Rd E | 0.59mi | 3/1.5 (+1) | 1,220 (-3%) | 9mo | $249,900 | $205 | 52 |
| 4443 Pepper Ridge Ct | 0.72mi | 2/2.5 | 1,336 (+6%) | 10mo | $243,000 | $182 | 46 |
| 3325 Bangor Cres | 0.48mi | 3/2.5 (+1) | 1,410 (+12%) | 9mo | $225,000 | $160 | 44 |
| 3501 Sugar Run | 0.73mi | 2/2.0 | 1,098 (-13%) | 9mo | $170,000 | $155 | 37 |
| 3318 Clover Meadows Dr | 0.64mi | 3/2.5 (+1) | 1,426 (+13%) | 9mo | $219,000 | $154 | 34 |
Match score weights: distance 35% · size 25% · config 20% · recency 20%. Top-matched comps best support the ARV.
Projected returns pro-forma
-3.0% appreciation · 7.59% rent growth · sell at horizon
- IRR
- -14.3%
- Equity multiple
- 0.47×
- Total profit
- $-36,533
- Equity at exit
- $36,530
- IRR
- 0.2%
- Equity multiple
- 1.02×
- Total profit
- $1,055
- Equity at exit
- $21,183
Cash invested: $68,600 (down + closing). Projections, not guarantees.
Landlord ↔ Tenant lean methodology
- Overall (STATE)
- 55 Moderately Landlord-Leaning
- State Virginia
- 55 Moderately Landlord-Leaning · D+2
- County
- — inherits STATE
- City
- — inherits STATE
ZIP-level market 23321
- Rents YoY
- 7.6%
- Active inventory
- 234
- Price-to-rent
- 11.0×
Monthly cashflow live
- Estimated rent
- $1,858 high interval (Pro) →
- Mortgage (P&I)
- −$1,285
- Tax from tax record
- −$171 /mo · $2,050/yr
- Insurance
- −$102
- HOA
- −$0
- Vacancy / Maint / Mgmt
- −$390
- Net cashflow
- $-90
Break-even live
Sensitivity live
| Price | -10% $48 | -5% $-21 | +0% $-90 | +5% $-160 | +10% $-229 |
|---|---|---|---|---|---|
| Rent | -10% $-237 | -5% $-164 | +0% $-90 | +5% $-17 | +10% $56 |
| Rate | -1.0pp $33 | -0.5pp $-28 | base $-90 | +0.5pp $-154 | +1.0pp $-218 |
UW: 25.0% down · 7.5% · 30yr · 1.5% tax · 5.0% vac · 8.0% maint · 8.0% mgmt
Financing live
Cash to close
- Down payment
- $61,250
- Closing costs
- $7,350
- Reserves months
- —
- Total cash needed
- —
Loan-product check · same deal, 3 products live
Conventional
25% down · 7.5% · 30yr
- Down + closing
- —
- Monthly P&I
- —
- Monthly cashflow
- —
- DSCR
- —
- Eligible?
- —
Personal DTI + credit; lowest rate.
DSCR
20% down · 8.5% · 30yr
- Down + closing
- —
- Monthly P&I
- —
- Monthly cashflow
- —
- DSCR
- —
- Eligible?
- —
No personal income docs; deal must DSCR.
Hard money
10% down · 12.0% · 12mo
- Down + closing
- —
- Monthly P&I
- —
- Monthly cashflow
- —
- DSCR
- —
- Eligible?
- —
Short-term bridge; refi at stabilization.
Rent comps 28 comps
| Address | Beds | Baths | Sqft | Rent | $/sqft | DOM | Units | Dist |
|---|---|---|---|---|---|---|---|---|
| 3701 Radford Cir Chesapeake, VA | 2.0 | 1.5 | 1262 | $2,000 | $1.58 | 25d | 1 | 0.08mi |
| 3331 Golden Oaks Ln Chesapeake, VA | 2.0 | 3.0 | 1294 | $2,150 | $1.66 | 5d | 1 | 0.52mi |
| 3240 Clover Rd E Chesapeake, VA | 2.0 | 1.5 | 1020 | $1,600 | $1.57 | 5d | 1 | 0.58mi |
| 3809 Peppercorn Way Chesapeake, VA | 3.0 | 2.5 | 1697 | $2,250 | $1.33 | 25d | 1 | 0.60mi |
| 3327 Clover Meadows Dr Chesapeake, VA | 2.0 | 2.0 | 960 | $1,550 | $1.61 | 25d | 1 | 0.65mi |
| 3468 Clover Meadows Dr Chesapeake, VA | 2.0 | 2.0 | 960 | $1,400 | $1.46 | 18d | 1 | 0.72mi |
| 3555 Clover Meadows Dr Chesapeake, VA | 2.0 | 1.0 | 897 | $1,500 | $1.67 | 13d | 1 | 0.75mi |
| 3640 Towne Point Rd Portsmouth, VA | 3.0 | 2.5 | 1500 | $2,355 | $1.57 | 25d | 1 | 0.80mi |
| 3772 Pepperwood Ct Portsmouth, VA | 2.0 | 1.5 | 915 | $1,450 | $1.58 | 45d | 1 | 0.91mi |
| 1001 Beringer Rd Suffolk, VA | 2.0 | 2.5 | 1747 | $2,899 | $1.66 | 45d | 1 | 0.93mi |
| 6200 Hightower Rd Portsmouth, VA | 1.0–3.0 | 1.0–1.5 | 935 | $1,378 | $1.47 | 45d | 8 | 1.06mi |
| 3634 Towne Point Rd Portsmouth, VA | 3.0 | 2.5 | 1500 | $2,355 | $1.57 | 45d | 1 | 1.06mi |
| 3710 Towne Point Rd Unit B Portsmouth, VA | 2.0 | 2.0 | 892 | $1,325 | $1.49 | 45d | 1 | 1.09mi |
| 1 Peachtree Ct Portsmouth, VA | 2.0 | 1.5 | 915 | $1,650 | $1.80 | 45d | 1 | 1.18mi |
| 2019 Barclay Pl Suffolk, VA | 1.0–2.0 | 1.0–2.0 | 893 | $2,101 | $2.35 | 3d | 10 | 1.22mi |
| 3808 Sugar Creek Cir Portsmouth, VA | 3.0 | 2.5 | 1584 | $2,345 | $1.48 | 45d | 1 | 1.24mi |
| 6024 Bradford Dr Suffolk, VA | 3.0 | 2.0 | 1064 | $1,500 | $1.41 | 21d | 1 | 1.26mi |
| 5916 Vernon Dr Suffolk, VA | 3.0 | 1.5 | 1142 | $1,850 | $1.62 | 25d | 1 | 1.27mi |
| 4605 Hardy Ct Suffolk, VA | 2.0 | 2.0 | 1087 | $1,600 | $1.47 | 45d | 1 | 1.33mi |
| 4613 Hardy Ct Unit B Suffolk, VA | 3.0 | 1.5 | 1140 | $1,550 | $1.36 | 45d | 1 | 1.35mi |
| 3812 Peach Orchard Cir Portsmouth, VA | 3.0 | 1.0 | 1082 | $1,800 | $1.66 | 45d | 1 | 1.35mi |
| 3805 Headwind Ln Portsmouth, VA | 3.0 | 2.5 | 1515 | $2,000 | $1.32 | 25d | 1 | 1.39mi |
| 3856 Augustine Cir Portsmouth, VA | 3.0 | 1.0 | 1082 | $1,605 | $1.48 | 45d | 1 | 1.40mi |
| 6080 Camellia Dr Unit A Suffolk, VA | 2.0 | 1.5 | 1064 | $1,450 | $1.36 | 22d | 1 | 1.42mi |
| 6141a Old College Dr Unit Leasing Office Suffolk, VA | 3.0 | 1.5 | 1010 | $1,425 | $1.41 | 22d | 1 | 1.45mi |
| 5234 Clover Hill Dr Portsmouth, VA | 3.0 | 1.5 | 1461 | $1,850 | $1.27 | 25d | 1 | 1.47mi |
| 4015 Reese Dr S Portsmouth, VA | 3.0 | 2.0 | 1555 | $1,795 | $1.15 | 16d | 1 | 1.48mi |
| 6057 Camellia Dr Unit A Suffolk, VA | 2.0 | 1.5 | 1064 | $1,395 | $1.31 | 45d | 1 | 1.49mi |
Listing history 21 events
-
2026-05-18historical Active Under Contract
-
2026-05-08$245,000 Active
-
2026-05-06$245,000
-
2025-08-09historical $1,900
-
2025-08-08$1,900
-
2025-08-04historical $1,900
-
2025-07-07$1,900
-
2024-05-27historical $1,650
-
2024-05-25$1,650
-
2024-05-19historical $1,650
-
2024-05-17$1,650
-
2024-05-01soldstatus $215,000
-
2024-04-11status Under Contract
-
2024-04-09$215,000 Active
-
2022-07-01soldstatus $170,000
-
2022-06-13status Under Contract
-
2022-06-01historical Active Under Contract
-
2022-06-01status Active
-
2022-05-27historical Active Under Contract
-
2022-05-23$167,000 Active
-
1999-03-02soldstatus $53,000
ⓘ Source: listings_history table (triggers on properties + properties_extension) + one-shot
backfill from property_details.listing_events for pre-trigger history.
Tax reassessment forecast VA · Resets to sale price
- Current annual tax
- $2,050 · $171/mo
- Projected year-2 tax
- $2,050 · $171/mo
- Expected delta
- $0/yr ($0/mo · 0.0%)
ⓘ Screening estimate from a state-policy table — verify with the county assessor before closing.
Climate risk First Street
- Flood 3/10 Moderate FEMA zone X (unshaded) · 12% chance over 30 yrs
- Wildfire 1/10 Low
- Heat 9/10 Extreme 7 d/yr ≥106°F today · 16 d/yr by 30 yrs out
- Wind 8/10 Severe 80% chance of damaging wind over 30 yrs
- Air quality 2/10 Low 1 unhealthy d/yr today · 3 by 30 yrs out
Nearby sold comps map
Loading sold comps map…
Walkable amenities ~0.75 mi
Loading nearby amenities…
Taxation est. · year 1
- Rental income
- $22,290
- − Mortgage interest
- −$13,724
- − Property taxes
- −$2,050
- − Insurance
- −$1,225
- − Repairs & maintenance
- −$1,783
- − Management
- −$1,783
- − Depreciation
- −$7,127
- Taxable loss
- −$5,403
- Est. tax savings @ 24.0%
- +$1,297
- After-tax cash flow
- $213/yr
For passive investors: Depreciation is non-cash, so a rental often shows a tax loss while cash-flowing — sheltering income. Rental losses are passive: they offset passive income freely, and up to $25,000/yr can offset ordinary (W-2) income if you actively participate and your MAGI is under $100k (phasing out to $0 by $150k); unused losses carry forward. On sale, claimed depreciation is recaptured at up to 25%, and gains may owe capital-gains tax (a 1031 exchange can defer both). Figures are a year-1 estimate at your 24.0% rate — not tax advice; consult a CPA.
Schools (NCES district)
- District
- Chesapeake City Public School District
- NCES district ID
- 5100810
- Math proficiency
- 58% ▼ -29.00%
- Reading proficiency
- 74% ▼ -7.00%
- Median HH income
- $69,356
- Composite
- 57.84/100
- National rank
- #1047
- State rank
- #31 of 131 in VA
Livability — Chesapeake
- Score
- 70/100
- State rank
- #236
- US rank
- #7942
Category grades
Schools grade is shown separately in the Schools card above.
Census & demographics
- Census place
- Chesapeake, VA
- County
- Chesapeake City · 253,091 people
- City population
- 253,091
- Metro
- Virginia Beach-Norfolk-Newport News, VA-NC
- Population (ZIP)
- 40,176
- Household income
- $101,568
- Rent vs Own
- Severe rent burden
- 839.0
Population outlook (Chesapeake County) Hauer SSP2
- Today (2025)
- 263,804 people
- By 2030
- 276,798 · +4.9%
- By 2040
- 299,906 · +13.7%
- By 2050
- 318,284 · +20.7%
- By 2075
- 362,137 · +37.3%
- By 2100
- 372,225 · +41.1%
Race, ethnicity, and origin ACS 2023
- Neighborhood character
- Diverse neighborhood (Simpson 0.63)
- Race & ethnicity
- White 49% Black 37% Two or more races 8% Hispanic / Latino 5% Asian 3%
- Common ancestry
- Romanian 3% Italian 2% Lithuanian 2%
- Foreign-born
- 6% · Canada, Vietnam, South Korea
- Languages at home
- 92% English-only · Spanish 4% Vietnamese 1% Korean 1%
Political lean MEDSL · Chesapeake
- 2024 margin
- Toss-up / Even · D 51.3% · R 47.5% · Other 1.2%
- 2008→2024 swing
- +2.5pp toward D · 2008: 1.3pp · 2024: 3.8pp
- All cycles
- 2024: D+3.8 2020: D+6.5 2016: R+1.3 2012: D+1.1 2008: D+1.3
Not yet ingested
- Civics
- —
Market trends
- HPI YoY
- ▼ -256.23%
- Current HPI
- 295.6473
- Rent YoY
- ▲ 7.59%
- Metro
- Virginia Beach-Norfolk-Newport News, VA-NC
- State GDP YoY
- ▲ 2.40%
- F500 in state
- 50
Industry mix (Fortune 500 HQ in VA)
| Industry | F500 HQs | Revenue |
|---|---|---|
| Aerospace / Defense | 4 | $236B |
|
||
| Technology / Defense | 3 | $32B |
|
||
| Financial Services | 2 | $176B |
|
||
| Utilities | 2 | $27B |
|
||
| Insurance | 2 | $25B |
|
||
| Technology | 2 | $15B |
|
||
Price history
+362.3% since first listed21 events — show timeline
- 2026-05-18 Contingent — REINMLS
- 2026-05-08 Listed $245,000 REINMLS
- 2026-05-06 Listed $245,000 REINMLS
- 2025-08-09 Rental Removed $1,900 REINMLS
- 2025-08-08 Listed for Rent $1,900 REINMLS
- 2025-08-04 Rental Removed $1,900 REINMLS
- 2025-07-07 Listed for Rent $1,900 REINMLS
- 2024-05-27 Rental Removed $1,650 REINMLS
- 2024-05-25 Listed for Rent $1,650 REINMLS
- 2024-05-19 Rental Removed $1,650 REINMLS
- 2024-05-17 Listed for Rent $1,650 REINMLS
- 2024-05-01 Sold (Public Records) $215,000 Public Records
- 2024-04-11 Pending — REINMLS
- 2024-04-09 Listed $215,000 REINMLS
- 2022-07-01 Sold (Public Records) $170,000 Public Records
- 2022-06-13 Pending — REINMLS
- 2022-06-01 Contingent — REINMLS
- 2022-06-01 Relisted — REINMLS
- 2022-05-27 Contingent — REINMLS
- 2022-05-23 Listed $167,000 REINMLS
- 1999-03-02 Sold (Public Records) $53,000 Public Records
Property tax history
+4.1%/yrLatest (2025): $2,050 · +3.7% YoY. Source: county tax records.
Cash-flow waterfall
monthlySold comps — $/sqft
last 12 mo · ≤1 miLoading sold comps…