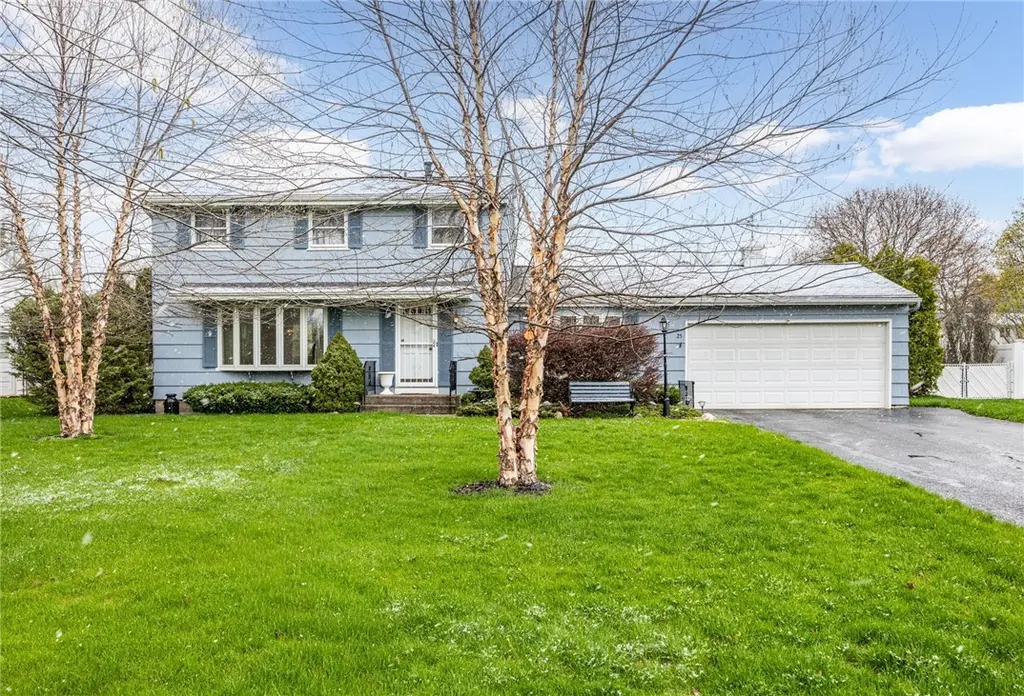
25 Bellmawr Dr · Gates, NY
Flood risk 1/10 · Minimal
- FEMA flood zone
- X (unshaded)
- Chance of flooding over 30 yrs
- 0.0%
- Est. flood insurance / yr
- $473 – $860
Fire risk 1/10 · Minimal
- Est. fire insurance / yr
- $691 – $1,283
Heat risk 2/10 · Minimal
- Hot days now (above 95°F)
- 7 days/yr
- Hot days in 30 yrs
- 15 days/yr
Wind risk 1/10 · Minimal
- Chance of severe wind over 30 yrs
- —
Air-quality risk 2/10 · Minimal
- Unhealthy air days now
- 1 days/yr
- Unhealthy air days in 30 yrs
- 1 days/yr
Risk factors via First Street. Map © Google.
Why this score? — see what drove the D+ grade
The composite is a weighted blend of 9 inputs, each scored 0–100. Each bar is that input's sub-score; the figure is the points it added to the 100-point composite (weight × sub-score).
- Cash flow +13.3/30.0
- ARV discount +11.6/15.0
- 1% rule +4.5/10.0
- DSCR +4.0/10.0
- Schools +3.6/10.0
- Livability +3.4/5.0
- Rent growth +2.5/5.0
- Condition / age +2.5/5.0
- Appreciation +0.0/10.0
$249,900
🖨 Deal sheet 📄 Offer letter ✓ Due diligence
Listing remarks
Welcome to this well-maintained 3-bedroom, 1.5-bath Colonial located in Chili! Offering 1,608 sq ft of living space, this home features a classic layout with great bones and the perfect opportunity to make it your own. Step inside to a spacious, light-filled living room that flows into a formal dining area—ideal for everyday living and entertaining. The eat-in kitchen offers abundant cabinet space and overlooks the backyard, ready for your personal touch. A convenient first-floor half bath completes the main level. Upstairs, you’ll find three generously sized bedrooms, including a spacious primary, along with a full bath. Beautiful hardwood floors run throughout much of the home
Key facts
- Eat in kitchen
- Hardwood floors
- 0.35 acre lot
Tags
Property features AI
Finance
- Other: Lot is rectangular, residential; dimensions approximately 90 x 170; about 0.35 acre; City street frontage
- Financial info: Financial details not included
- HOA & community: No HOA information specified
Exterior
- Parking: Attached garage with electricity; 2-car garage
- Security: No security features specified
- Utilities: Public water (connected); Sewer connected; Electric service with circuit breakers
- Home design: Two-story home; Resale property
- Construction: Wood siding; Asphalt roof; Block foundation; Existing (previously built) structure
- Exterior features: Blacktop driveway; Shed(s) and storage
Interior
- Kitchen: Dishwasher; Electric oven; Electric range; Disposal; Microwave; Refrigerator
- Bedrooms: Bedrooms information not specified
- Flooring: Carpet; Hardwood; Laminate; Vinyl; Varied flooring
- Bathrooms: 1 full bathroom; 1 half bathroom; 1 main-level bathroom
- Heating & cooling: Forced air gas heating; Central air conditioning
- Interior features: Separate/formal dining room; Eat-in kitchen; Separate/formal living room; Full basement with sump pump; 7 total rooms; Laundry in basement
- Laundry & utility: Washer; Dryer; Gas water heater
Neighborhood map
What this means for you Summary
Snapshot
- This is a 3-bed/1.5-bath single-family listed at $250k.
Deal economics
- At list price, monthly cash flow is $1 ($10/yr) — positive.
- The deal already cash-flows at list — no discount required.
- To meet the 1% rule (rent ≥ 1% of price), the offer needs to be $237k (5.2% below list).
- Recommended offer: $237k (5.2% below list) — sets the bar for 1% rule.
Location & tenants
- Location reads 67/100 on livability (#582 in NY) — a middle-class / working-renter tenant base. Strengths: housing A+, health & safety A+; Watch: amenities F, commute F.
- Gates-Chili Central School District (suburban): math 41% / reading 42% proficiency, ranked #491 of 590 in NY (top 83%) — families likely to look elsewhere, expect single-tenant / working-renter base with shorter leases.
- Market conditions: 127 active listings in the ZIP; 1 comparable units currently listed for rent nearby; solid renter incomes; 1,169 units permitted in Monroe County in 2024 (591 in 5+ unit buildings).
- This rent runs 32% of the median local income ($88k/yr) — at the standard rent-burdened threshold; future hikes will face affordability resistance.
Forward outlook
- Local home prices are declining (-3.0%/yr); year-one equity from $2k of loan paydown is wiped out by about $7k of value loss. Plan a longer hold.
- Monroe County population projected to shrink 6% by 2050 — rents likely to lag national; underwrite the cash flow, not the appreciation.
Negotiation context
- Only 7 days on market — expect competitive offers; lowballing is unlikely to land.
Questions for the listing agent
- Built in 1971 — when were the roof, HVAC, electrical panel, plumbing, and water heater last replaced?
- Is there a deadline driving the sale (1031 exchange, divorce, estate, relocation)? That informs how much negotiation room exists.
- Schools are B-rated — typically a magnet for longer-tenancy family renters. What's the average tenant stay here, and is there a school-zone premium baked into asking?
- The area grade is low — what's the realistic commute time and amenity access for the typical tenant pool here? Any planned neighborhood developments (good or bad) we should know about?
- What's the average days-on-market for RENTAL listings here right now (not sales)? A rising rental-DOM trend means longer vacancies and softer asking-rent achievability than the comps imply.
- What's the recent tenant-quality profile in this submarket — average credit score on applications, eviction rate, late-payment / NSF rate, and stable-employment percentage? A property-management company in the area should have these aggregated.
- How much new for-sale + rental construction is in the pipeline within 1–3 miles? Heavy new supply typically softens prices + rents 12–24 months out; constrained supply supports both.
Investment metrics
- 1% rule
- 0.95% ✗
- Cap rate
- 6.30%
- Cash-on-cash
- 0.01%
- DSCR
- 1.00
- GRM
- 8.8
CMA / ARV
- ARV (on-the-fly)
- $274,968
- Comps found
- 12
Show comp detail 12 sales within ~0.75 mi
| Address | Dist | Beds/Ba | Sqft | Sold | Price | $/sf | Match |
|---|---|---|---|---|---|---|---|
| 25 Bellmawr Dr | 0.00mi | 3/1.5 | 1,608 (0%) | 1mo | $310,000 | $193 | 99 |
| 52 Chestnut Ridge Rd | 0.49mi | 3/1.5 | 1,590 (-1%) | 1mo | $300,500 | $189 | 74 |
| 21 Red Bud Rd | 0.44mi | 3/1.5 | 1,582 (-2%) | 8mo | $269,900 | $171 | 70 |
| 71 Bellmawr Dr | 0.16mi | 3/1.5 | 1,429 (-11%) | 8mo | $280,000 | $196 | 67 |
| 25 Red Bud Rd | 0.44mi | 4/1.5 (+1) | 1,568 (-2%) | 4mo | $200,000 | $128 | 67 |
| 3112 Chili Ave | 0.45mi | 4/2.0 (+1) | 1,656 (+3%) | 8mo | $235,000 | $142 | 60 |
| 536 Paul Rd | 0.65mi | 3/1.5 | 1,662 (+3%) | 6mo | $240,000 | $144 | 59 |
| 20 White Birch Cir | 0.58mi | 4/1.5 (+1) | 1,714 (+7%) | 1mo | $350,000 | $204 | 56 |
| 34 Chestnut Ridge Rd | 0.48mi | 4/2.0 (+1) | 1,494 (-7%) | 4mo | $224,000 | $150 | 55 |
| 22 Laredo Dr | 0.55mi | 4/1.5 (+1) | 1,492 (-7%) | 5mo | $230,000 | $154 | 53 |
| 162 Chestnut Ridge Rd | 0.70mi | 3/2.0 | 1,500 (-7%) | 8mo | $261,000 | $174 | 48 |
| 159 Chestnut Ridge Rd | 0.66mi | 4/2.0 (+1) | 1,512 (-6%) | 8mo | $250,000 | $165 | 46 |
Match score weights: distance 35% · size 25% · config 20% · recency 20%. Top-matched comps best support the ARV.
Projected returns pro-forma
-3.0% appreciation · 3.0% rent growth · sell at horizon
- IRR
- -16.2%
- Equity multiple
- 0.42×
- Total profit
- $-40,317
- Equity at exit
- $37,261
- IRR
- -7.8%
- Equity multiple
- 0.51×
- Total profit
- $-34,533
- Equity at exit
- $21,607
Cash invested: $69,972 (down + closing). Projections, not guarantees.
Landlord ↔ Tenant lean methodology
- Overall (STATE)
- 15 Strongly Tenant-Friendly
- State New York
- 15 Strongly Tenant-Friendly · D+10
- County
- — inherits STATE
- City
- — inherits STATE
ZIP-level market 14624
- Active inventory
- 127
- Price-to-rent
- 8.8×
Monthly cashflow live
- Estimated rent
- $2,370 medium interval (Pro) →
- Mortgage (P&I)
- −$1,311
- Tax from tax record
- −$457 /mo · $5,481/yr
- Insurance
- −$104
- HOA
- −$0
- Vacancy / Maint / Mgmt
- −$498
- Net cashflow
- $1
Break-even live
UW: 25.0% down · 7.5% · 30yr · 1.5% tax · 5.0% vac · 8.0% maint · 8.0% mgmt
Financing live
Cash to close
- Down payment
- $62,475
- Closing costs
- $7,497
- Reserves months
- —
- Total cash needed
- —
Loan-product check · same deal, 3 products live
Conventional
25% down · 7.5% · 30yr
- Down + closing
- —
- Monthly P&I
- —
- Monthly cashflow
- —
- DSCR
- —
- Eligible?
- —
Personal DTI + credit; lowest rate.
DSCR
20% down · 8.5% · 30yr
- Down + closing
- —
- Monthly P&I
- —
- Monthly cashflow
- —
- DSCR
- —
- Eligible?
- —
No personal income docs; deal must DSCR.
Hard money
10% down · 12.0% · 12mo
- Down + closing
- —
- Monthly P&I
- —
- Monthly cashflow
- —
- DSCR
- —
- Eligible?
- —
Short-term bridge; refi at stabilization.
Rent comps 1 comps
| Address | Beds | Baths | Sqft | Rent | $/sqft | DOM | Units | Dist |
|---|---|---|---|---|---|---|---|---|
| 25 Red Bud Rd Rochester, NY | 4.0 | 1.5 | 1568 | $2,600 | $1.66 | 19d | 1 | 0.45mi |
Listing history 2 events
-
2026-04-29status Pending
-
2026-04-22$249,900 Active
ⓘ Source: listings_history table (triggers on properties + properties_extension) + one-shot
backfill from property_details.listing_events for pre-trigger history.
Tax reassessment forecast NY · Partial reset (capped growth)
- Current annual tax
- $5,481 · $457/mo
- Projected year-2 tax
- $5,481 · $457/mo
- Expected delta
- $0/yr ($0/mo · 0.0%)
ⓘ Screening estimate from a state-policy table — verify with the county assessor before closing.
Climate risk First Street
- Flood 1/10 Low FEMA zone X (unshaded) · 0% chance over 30 yrs
- Wildfire 1/10 Low
- Heat 2/10 Low 7 d/yr ≥95°F today · 15 d/yr by 30 yrs out
- Wind 1/10 Low
- Air quality 2/10 Low 1 unhealthy d/yr today · 1 by 30 yrs out
Nearby sold comps map
Loading sold comps map…
Walkable amenities ~0.75 mi
Loading nearby amenities…
Taxation est. · year 1
- Rental income
- $28,439
- − Mortgage interest
- −$13,998
- − Property taxes
- −$5,481
- − Insurance
- −$1,250
- − Repairs & maintenance
- −$2,275
- − Management
- −$2,275
- − Depreciation
- −$7,270
- Taxable loss
- −$4,110
- Est. tax savings @ 24.0%
- +$986
- After-tax cash flow
- $996/yr
For passive investors: Depreciation is non-cash, so a rental often shows a tax loss while cash-flowing — sheltering income. Rental losses are passive: they offset passive income freely, and up to $25,000/yr can offset ordinary (W-2) income if you actively participate and your MAGI is under $100k (phasing out to $0 by $150k); unused losses carry forward. On sale, claimed depreciation is recaptured at up to 25%, and gains may owe capital-gains tax (a 1031 exchange can defer both). Figures are a year-1 estimate at your 24.0% rate — not tax advice; consult a CPA.
Schools (NCES district)
- District
- Gates-Chili Central School District
- NCES district ID
- 3611880
- Math proficiency
- 41% ▼ -12.00%
- Reading proficiency
- 42% ▼ -6.00%
- Median HH income
- $55,045
- Composite
- 36.23/100
- National rank
- #4719
- State rank
- #491 of 590 in NY
Livability — Gates
- Score
- 67/100
- State rank
- #582
- US rank
- #10531
Category grades
Schools grade is shown separately in the Schools card above.
Census & demographics
- County
- Monroe County · 674,131 people
- Metro
- Rochester, NY
- Population (ZIP)
- 38,626
- Household income
- $87,989
- Rent vs Own
- Severe rent burden
- 584.0
Population outlook (Monroe County) Hauer SSP2
- Today (2025)
- 759,460 people
- By 2030
- 757,154 · -0.3%
- By 2040
- 740,644 · -2.5%
- By 2050
- 714,443 · -5.9%
- By 2075
- 645,883 · -15.0%
- By 2100
- 547,084 · -28.0%
Race, ethnicity, and origin ACS 2023
- Neighborhood character
- Predominantly White (78%)
- Race & ethnicity
- White 78% Black 9% Hispanic / Latino 6% Two or more races 5% Asian 3%
- Hispanic origin (detail)
- Puerto Rican 4%
- Common ancestry
- Romanian 6% Iranian 2% Lithuanian 2%
- Foreign-born
- 7% · Canada, China, India
- Languages at home
- 90% English-only · Spanish 3% Other Indo-European 3% Russian/Polish/Slavic 1%
Political lean MEDSL · Monroe
- 2024 margin
- D (+19.1) · D 59.5% · R 40.5%
- 2008→2024 swing
- +1.4pp toward D · 2008: 17.7pp · 2024: 19.1pp
- All cycles
- 2024: D+19.1 2020: D+21.0 2016: D+14.1 2012: D+17.4 2008: D+17.7
Not yet ingested
- Civics
- —
Market trends
- HPI YoY
- ▼ -151.26%
- Current HPI
- 267.356
- Rent YoY
- —
- Metro
- Rochester, NY
- State GDP YoY
- ▲ 2.60%
- F500 in state
- 92
Industry mix (Fortune 500 HQ in NY)
| Industry | F500 HQs | Revenue |
|---|---|---|
| Financial Services | 10 | $950B |
|
||
| Consumer Goods | 9 | $162B |
|
||
| Insurance | 4 | $225B |
|
||
| Telecommunications | 2 | $144B |
|
||
| Pharmaceuticals | 2 | $112B |
|
||
| Media / Entertainment | 2 | $69B |
|
||
Price history
2 events — show timeline
- 2026-04-29 Pending — UNYREIS
- 2026-04-22 Listed $249,900 UNYREIS
Property tax history
+1.9%/yrLatest (2025): $5,481 · +24.6% YoY. Source: county tax records.
Cash-flow waterfall
monthlySold comps — $/sqft
last 12 mo · ≤1 miLoading sold comps…