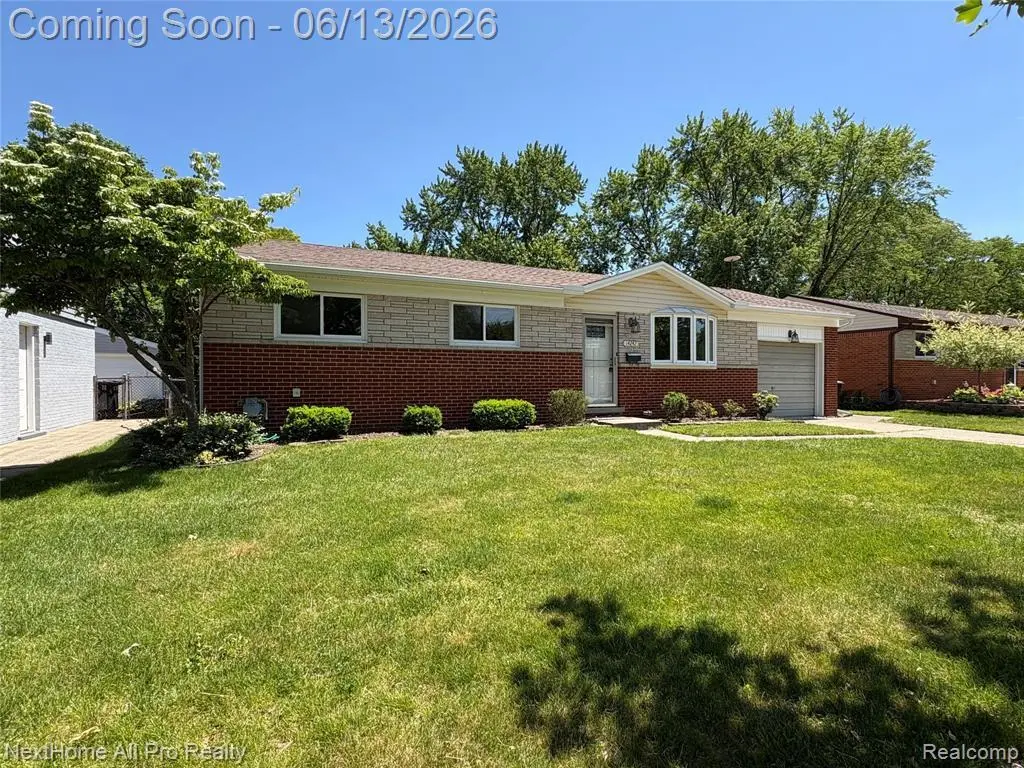
14242 Park St · Livonia, MI
Flood risk 1/10 · Minimal
- FEMA flood zone
- X (unshaded)
- Chance of flooding over 30 yrs
- 0.0%
- Est. flood insurance / yr
- $473 – $860
Fire risk 1/10 · Minimal
- Est. fire insurance / yr
- $784 – $1,456
Heat risk 3/10 · Minor
- Hot days now (above 98°F)
- 7 days/yr
- Hot days in 30 yrs
- 15 days/yr
Wind risk 2/10 · Minimal
- Chance of severe wind over 30 yrs
- —
Air-quality risk 3/10 · Minor
- Unhealthy air days now
- 2 days/yr
- Unhealthy air days in 30 yrs
- 4 days/yr
Risk factors via First Street. Map © Google.
Why this score? — see what drove the F grade
The composite is a weighted blend of 9 inputs, each scored 0–100. Each bar is that input's sub-score; the figure is the points it added to the 100-point composite (weight × sub-score).
- ARV discount +7.5/15.0
- Cash flow +6.7/30.0
- Schools +4.6/10.0
- Livability +3.9/5.0
- Rent growth +2.5/5.0
- Condition / age +2.5/5.0
- 1% rule +1.1/10.0
- DSCR +1.0/10.0
- Appreciation +0.0/10.0
$320,000
🖨 Deal sheet 📄 Offer letter ✓ Due diligence
Listing remarks
Welcome home to this charming 3-bedroom, 1 full bath ranch located in one of Livonia’s most desirable neighborhoods! This well-maintained home features a bright and inviting layout, spacious living areas, and an enclosed patio perfect for relaxing or entertaining year-round. Enjoy the huge fenced backyard with plenty of space for pets, play, gardening, or summer gatherings. Recent updates include a new roof in 2025, adding peace of mind for the next owner. Conveniently located near parks, schools, shopping, dining, and expressways. A fantastic opportunity to own a move-in ready home in a highly sought-after location!
Key facts
- Recent updates
- Conveniently located
- Enclosed patio
Tags
Property features AI
Exterior
- Parking: Attached garage with 1 parking space
- Utilities: Public water; Public sewer (assumed); Electric service (assumed); Natural gas
- Home design: Residential single-story home; Built in 1962; Entry-level living and bedrooms; Frontage approximately 63 feet; Acreage about 0.22 acres; Subdivision: Biltmore Estates 2
- Construction: Basement foundation
- Exterior features: Brick and vinyl siding exterior; Fenced yard; Patio; Paved street frontage
Interior
- Kitchen: Dishwasher; Disposal; Range/Oven; Refrigerator
- Bedrooms: Three bedrooms on the main/entry level (approx. 11 x 11; 9 x 10; 10'); Bedroom floors are wood
- Flooring: Wood flooring in living room and bedrooms; Vinyl flooring in kitchen and dining room; Ceramic flooring in bathroom
- Bathrooms: One full bathroom on the entry level with ceramic flooring (approx. 6 x 10)
- Heating & cooling: Forced air heating (natural gas fuel); Central air conditioning; Gas water heater
- Interior features: Cable/Internet available; Partially finished basement
- Laundry & utility: Basement (partially finished)
Neighborhood map
What this means for you Summary
Snapshot
- This is a 3-bed/1.0-bath single-family listed at $320k.
Deal economics
- At list price, monthly cash flow is $-506 ($-6k/yr) — negative.
- To cash-flow at today's rent, offer at most $231k (28.0% below list).
- To meet the 1% rule (rent ≥ 1% of price), the offer needs to be $196k (38.7% below list).
- Recommended offer: $196k (38.7% below list) — sets the bar for 1% rule.
Location & tenants
- Location reads 77/100 on livability (#116 in MI, #2,784 nationally) — a middle-class / working-renter tenant base. Strengths: employment A+, cost of living A+, housing A+; Watch: amenities D, health & safety D, commute F.
- Livonia Public Schools School District (urban): math 46% / reading 59% proficiency, ranked #77 of 540 in MI (top 14%) — acceptable for families but not a draw, mixed tenant base, ~2y average lease.
- Market conditions: 102 active listings in the ZIP; 2,639 units permitted in Wayne County in 2024 (1,216 in 5+ unit buildings).
Forward outlook
- Local home prices are declining (-3.0%/yr); year-one equity from $2k of loan paydown is wiped out by about $10k of value loss. Plan a longer hold.
- Wayne County population projected at -17% by 2050 — secular population decline; favor cash flow + early exit over multi-decade hold.
Negotiation context
- Only 4 days on market — expect competitive offers; lowballing is unlikely to land.
- Current owner paid $148k; list at $320k implies a 115% gain — meaningful room to come down on a strong offer.
Questions for the listing agent
- What do current leases actually rent for vs. the listed asking? Can we see a recent rent roll and the last 12 months of T-12 income?
- Built in 1962 — when were the roof, HVAC, electrical panel, plumbing, and water heater last replaced?
- Is there a deadline driving the sale (1031 exchange, divorce, estate, relocation)? That informs how much negotiation room exists.
- Schools are B-rated — typically a magnet for longer-tenancy family renters. What's the average tenant stay here, and is there a school-zone premium baked into asking?
- The area grade is low — what's the realistic commute time and amenity access for the typical tenant pool here? Any planned neighborhood developments (good or bad) we should know about?
- What's the average days-on-market for RENTAL listings here right now (not sales)? A rising rental-DOM trend means longer vacancies and softer asking-rent achievability than the comps imply.
- What's the recent tenant-quality profile in this submarket — average credit score on applications, eviction rate, late-payment / NSF rate, and stable-employment percentage? A property-management company in the area should have these aggregated.
- How much new for-sale + rental construction is in the pipeline within 1–3 miles? Heavy new supply typically softens prices + rents 12–24 months out; constrained supply supports both.
Investment metrics
- 1% rule
- 0.61% ✗
- Cap rate
- 4.39%
- Cash-on-cash
- -6.78%
- DSCR
- 0.70
- GRM
- 13.6
CMA / ARV
No comps found within radius.
Projected returns pro-forma
-3.0% appreciation · 3.0% rent growth · sell at horizon
- IRR
- -28.1%
- Equity multiple
- 0.06×
- Total profit
- $-84,176
- Equity at exit
- $47,713
- IRR
- -27.1%
- Equity multiple
- -0.28×
- Total profit
- $-115,102
- Equity at exit
- $27,668
Cash invested: $89,600 (down + closing). Projections, not guarantees.
Landlord ↔ Tenant lean methodology
- Overall (STATE)
- 62 Landlord-Friendly
- State Michigan
- 62 Landlord-Friendly · EVEN
- County
- — inherits STATE
- City
- — inherits STATE
ZIP-level market 48154
- Active inventory
- 102
- Price-to-rent
- 13.6×
Monthly cashflow live
- Estimated rent
- $1,962 medium interval (Pro) →
- Mortgage (P&I)
- −$1,678
- Tax from tax record
- −$245 /mo · $2,936/yr
- Insurance
- −$133
- HOA
- −$0
- Vacancy / Maint / Mgmt
- −$412
- Net cashflow
- $-506
Break-even live
UW: 25.0% down · 7.5% · 30yr · 1.5% tax · 5.0% vac · 8.0% maint · 8.0% mgmt
Financing live
Cash to close
- Down payment
- $80,000
- Closing costs
- $9,600
- Reserves months
- —
- Total cash needed
- —
Loan-product check · same deal, 3 products live
Conventional
25% down · 7.5% · 30yr
- Down + closing
- —
- Monthly P&I
- —
- Monthly cashflow
- —
- DSCR
- —
- Eligible?
- —
Personal DTI + credit; lowest rate.
DSCR
20% down · 8.5% · 30yr
- Down + closing
- —
- Monthly P&I
- —
- Monthly cashflow
- —
- DSCR
- —
- Eligible?
- —
No personal income docs; deal must DSCR.
Hard money
10% down · 12.0% · 12mo
- Down + closing
- —
- Monthly P&I
- —
- Monthly cashflow
- —
- DSCR
- —
- Eligible?
- —
Short-term bridge; refi at stabilization.
Listing history 7 events
-
2026-06-18days on market $320,000 Active 4 DOM
-
2026-06-17days on market $320,000 Active 3 DOM
-
2026-06-16days on market $320,000 Active 2 DOM
-
2026-06-15$320,000 Active 1 DOM
-
2026-06-13status $320,000 Active 1 DOM
-
2026-06-10remarks 624-char remark
-
2026-06-10$320,000 Coming Soon 1 DOM
ⓘ Source: listings_history table (triggers on properties + properties_extension) + one-shot
backfill from property_details.listing_events for pre-trigger history.
Tax reassessment forecast MI · Partial reset (capped growth)
- Current annual tax
- $2,936 · $245/mo
- Projected year-2 tax
- $3,932 · $328/mo
- Expected delta
- +$996/yr (+$83/mo · 33.9%)
ⓘ Screening estimate from a state-policy table — verify with the county assessor before closing.
Climate risk First Street
- Flood 1/10 Low FEMA zone X (unshaded) · 0% chance over 30 yrs
- Wildfire 1/10 Low
- Heat 3/10 Moderate 7 d/yr ≥98°F today · 15 d/yr by 30 yrs out
- Wind 2/10 Low
- Air quality 3/10 Moderate 2 unhealthy d/yr today · 4 by 30 yrs out
Nearby sold comps map
Loading sold comps map…
Walkable amenities ~0.75 mi
Loading nearby amenities…
Taxation est. · year 1
- Rental income
- $23,538
- − Mortgage interest
- −$17,925
- − Property taxes
- −$2,936
- − Insurance
- −$1,600
- − Repairs & maintenance
- −$1,883
- − Management
- −$1,883
- − Depreciation
- −$9,309
- Taxable loss
- −$11,997
- Est. tax savings @ 24.0%
- +$2,879
- After-tax cash flow
- $-3,198/yr
For passive investors: Depreciation is non-cash, so a rental often shows a tax loss while cash-flowing — sheltering income. Rental losses are passive: they offset passive income freely, and up to $25,000/yr can offset ordinary (W-2) income if you actively participate and your MAGI is under $100k (phasing out to $0 by $150k); unused losses carry forward. On sale, claimed depreciation is recaptured at up to 25%, and gains may owe capital-gains tax (a 1031 exchange can defer both). Figures are a year-1 estimate at your 24.0% rate — not tax advice; consult a CPA.
Schools (NCES district)
- District
- Livonia Public Schools School District
- NCES district ID
- 2621840
- Math proficiency
- 46% ▼ -5.00%
- Reading proficiency
- 59% ▬ 0.00%
- Median HH income
- $65,268
- Composite
- 46.27/100
- National rank
- #2480
- State rank
- #77 of 540 in MI
Livability — Livonia
- Score
- 77/100
- State rank
- #116
- US rank
- #2784
Category grades
Schools grade is shown separately in the Schools card above.
Census & demographics
- Census place
- Livonia, MI
- City population
- 56,806
- Population (ZIP)
- 36,915
Population outlook (Wayne County) Hauer SSP2
- Today (2025)
- 1,675,273 people
- By 2030
- 1,620,300 · -3.3%
- By 2040
- 1,502,341 · -10.3%
- By 2050
- 1,384,039 · -17.4%
- By 2075
- 1,124,592 · -32.9%
- By 2100
- 881,193 · -47.4%
Race, ethnicity, and origin ACS 2023
- Neighborhood character
- Predominantly White (85%)
- Race & ethnicity
- White 85% Two or more races 6% Hispanic / Latino 4% Black 4% Asian 2%
- Common ancestry
- Romanian 13% Lithuanian 4% Italian 3%
- Foreign-born
- 6% · Canada
- Languages at home
- 92% English-only · Other Indo-European 3% Arabic 2% Spanish 2%
Political lean MEDSL · Wayne
- 2024 margin
- Strong D (+29.0) · D 62.7% · R 33.7% · Other 3.6%
- 2008→2024 swing
- -20.5pp toward R · 2008: 49.5pp · 2024: 29.0pp
- All cycles
- 2024: D+29.0 2020: D+38.1 2016: D+37.3 2012: D+46.9 2008: D+49.5
Not yet ingested
- Civics
- —
Market trends
- HPI YoY
- ▼ -263.93%
- Current HPI
- 192.3426
- Rent YoY
- —
- Metro
- —
- State GDP YoY
- ▲ 1.37%
- F500 in state
- 28
Industry mix (Fortune 500 HQ in MI)
| Industry | F500 HQs | Revenue |
|---|---|---|
| Automotive Parts | 3 | $48B |
|
||
| Automotive | 2 | $372B |
|
||
| Chemicals | 1 | $45B |
|
||
| Automotive Retail | 1 | $29B |
|
||
| Healthcare / Medical Devices | 1 | $23B |
|
||
| Automotive Technology | 1 | $20B |
|
||
Price history
+113.5% since first listed3 events — show timeline
- 2026-06-10 Coming Soon $320,000 MiRealSource-MiMLS
- 1999-07-12 Sold (MLS) $148,500 REALCOMP
- 1999-05-18 Listed $149,900 REALCOMP
Property tax history
+3.1%/yrLatest (2025): $2,936 · +4.3% YoY. Source: county tax records.
Cash-flow waterfall
monthlySold comps — $/sqft
last 12 mo · ≤1 miLoading sold comps…