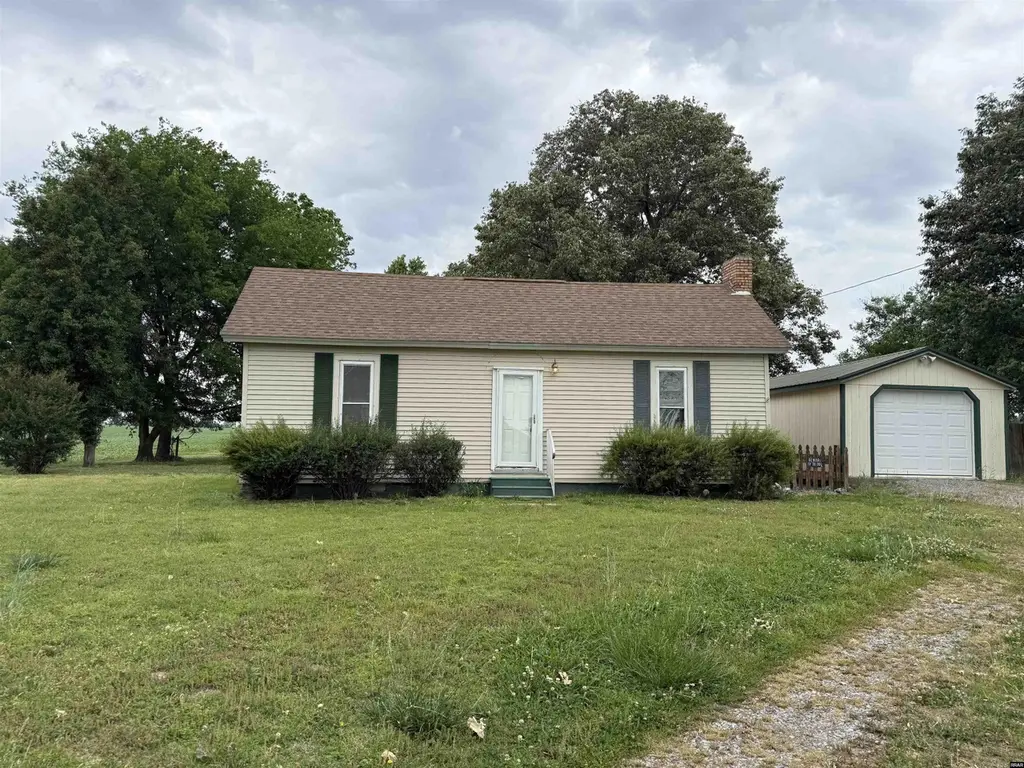
4810 Claude Tucker Rd · Union City, TN
Flood risk 1/10 · Minimal
- FEMA flood zone
- X (unshaded)
- Chance of flooding over 30 yrs
- 0.0%
- Est. flood insurance / yr
- $507 – $1,088
Fire risk 1/10 · Minimal
- Est. fire insurance / yr
- $949 – $1,763
Heat risk 5/10 · Moderate
- Hot days now (above 108°F)
- 7 days/yr
- Hot days in 30 yrs
- 21 days/yr
Wind risk 4/10 · Minor
- Chance of severe wind over 30 yrs
- 9.0%
Air-quality risk 1/10 · Minimal
- Unhealthy air days now
- 0 days/yr
- Unhealthy air days in 30 yrs
- 0 days/yr
Risk factors via First Street. Map © Google.
Why this score? — see what drove the C+ grade
The composite is a weighted blend of 9 inputs, each scored 0–100. Each bar is that input's sub-score; the figure is the points it added to the 100-point composite (weight × sub-score).
- Cash flow +24.8/30.0
- ARV discount +14.8/15.0
- DSCR +8.0/10.0
- 1% rule +5.1/10.0
- Livability +3.4/5.0
- Schools +3.2/10.0
- Rent growth +2.5/5.0
- Condition / age +2.5/5.0
- Appreciation +0.0/10.0
$99,000
🖨 Deal sheet (PDF) 📄 Offer letter ✓ Due diligence
Listing remarks
Great Location with Spacious yard! Home is a nice little home. 2BR, 1BA on approx 1.49 acres. Needs some TLC and work but overall good. Won't last long. Call Today!
Key facts
- Spacious yard
- Approx 1.49 acres
- 1.49 acre lot
Tags
Property features AI
Finance
- Other: Lot has rolling slope; Road access via gravel and paved surfaces; Approximately 1.49 acres
Exterior
- Utilities: Public water; Septic tank sewer
- Home design: Single-family residence; Residential property
- Construction: Vinyl siding
- Exterior features: Asphalt roof; Shed(s) and additional storage
Interior
- Kitchen: Range; Refrigerator
- Flooring: Hardwood; Vinyl
- Bathrooms: 1 full bathroom
- Heating & cooling: Radiant heating; Window air conditioning units
- Interior features: Blinds on windows; Crawl space basement
- Laundry & utility: Washer; Dryer
Neighborhood map
What this means for you Summary
Snapshot
- This is a 2-bed/1.0-bath single-family listed at $99k.
Deal economics
- At list price, monthly cash flow is $210 ($3k/yr) — positive.
- The deal already cash-flows at list — no discount required.
- Meets the 1% rule at list price ($1k rent vs $99k).
- Recommended offer: $96k (3.0% below list) — sets the bar for market timing.
Location & tenants
- Location reads 68/100 on livability (#90 in TN) — a middle-class / working-renter tenant base. Strengths: cost of living A+, housing A+, health & safety A+; Watch: crime F, amenities D-, commute F.
- Obion County (rural): math 40% / reading 37% proficiency, ranked #17 of 139 in TN (top 12%) — families likely to look elsewhere, expect single-tenant / working-renter base with shorter leases.
- Zoned schools: South Fulton Elementary (math 52% / reading 47%, grade D, #119 of 952 statewide, top 14%, 309 students, 0% FRL) — zoned schools average 0% FRL vs 50% district-wide (50 pts lower); this property's tenant base skews higher-income than the district average.
- Market conditions: 31 active listings in the ZIP; 21 units permitted in Obion County in 2024 (0 in 5+ unit buildings).
Forward outlook
- Local home prices are declining (-3.0%/yr); year-one equity from $684 of loan paydown is wiped out by about $3k of value loss. Plan a longer hold.
- Obion County population projected at -22% by 2050 — secular population decline; favor cash flow + early exit over multi-decade hold.
Negotiation context
- It's been on market 33 days — a 3% lower offer ($96k) is reasonable based on typical stale-listing flexibility.
Risks & watch-outs
- Watch-outs: built in 1905 — expect roof / HVAC / electrical / plumbing capex.
- Climate carrying-cost: extreme-heat days projected 7→21/yr by 2055 (HVAC capex compounding) — expect insurance premiums to compound above CPI over the hold.
Questions for the listing agent
- It's been on market 33 days. Have you received any prior offers? Is the seller open to a 3% concession, seller financing, or rate buy-down credit?
- Built in 1905 — when were the roof, HVAC, electrical panel, plumbing, and water heater last replaced?
- Is there a deadline driving the sale (1031 exchange, divorce, estate, relocation)? That informs how much negotiation room exists.
- Schools are F-rated, which usually means shorter tenancies and higher turnover. Who's the typical renter profile here, and what's been the actual vacancy rate?
- Crime grade is F in this area — have there been break-ins, vandalism, or insurance claims at this property in the last 3 years? What carrier currently insures it and at what premium?
- What's the average days-on-market for RENTAL listings here right now (not sales)? A rising rental-DOM trend means longer vacancies and softer asking-rent achievability than the comps imply.
- What's the recent tenant-quality profile in this submarket — average credit score on applications, eviction rate, late-payment / NSF rate, and stable-employment percentage? A property-management company in the area should have these aggregated.
- How much new for-sale + rental construction is in the pipeline within 1–3 miles? Heavy new supply typically softens prices + rents 12–24 months out; constrained supply supports both.
Investment metrics
- 1% rule
- 1.01% ✓
- Cap rate
- 8.84%
- Cash-on-cash
- 9.09%
- DSCR
- 1.40
- GRM
- 8.2
CMA / ARV
- ARV (on-the-fly)
- $118,080
- Comps found
- 1
Show comp detail 1 sale within ~0.75 mi
| Address | Dist | Beds/Ba | Sqft | Sold | Price | $/sf | Match |
|---|---|---|---|---|---|---|---|
| 4335 Cloys Rd | 0.64mi | 2/1.0 | 1,040 (+6%) | 6mo | $125,000 | $120 | 56 |
Match score weights: distance 35% · size 25% · config 20% · recency 20%. Top-matched comps best support the ARV.
Projected returns pro-forma
-3.0% appreciation · 3.0% rent growth · sell at horizon
- IRR
- -2.6%
- Equity multiple
- 0.90×
- Total profit
- $-2,711
- Equity at exit
- $14,761
- IRR
- 7.1%
- Equity multiple
- 1.53×
- Total profit
- $14,672
- Equity at exit
- $8,560
Cash invested: $27,720 (down + closing). Projections, not guarantees.
Landlord ↔ Tenant lean methodology
- Overall (STATE)
- 87 Strongly Landlord-Friendly
- State Tennessee
- 87 Strongly Landlord-Friendly · R+13
- County
- — inherits STATE
- City
- — inherits STATE
ZIP-level market 38261
- Home prices YoY
- -20.9%
- Active inventory
- 31
- Price-to-rent
- 8.2×
Monthly cashflow live
- Estimated rent
- $1,001 medium interval (Pro) →
- Mortgage (P&I)
- −$519
- Tax from tax record
- −$21 /mo · $247/yr
- Insurance
- −$41
- HOA
- −$0
- Vacancy / Maint / Mgmt
- −$210
- Net cashflow
- $210
Break-even live
Sensitivity live
| Price | -10% $266 | -5% $238 | +0% $210 | +5% $182 | +10% $154 |
|---|---|---|---|---|---|
| Rent | -10% $131 | -5% $171 | +0% $210 | +5% $250 | +10% $289 |
| Rate | -1.0pp $260 | -0.5pp $235 | base $210 | +0.5pp $184 | +1.0pp $158 |
UW: 25.0% down · 7.5% · 30yr · 1.5% tax · 5.0% vac · 8.0% maint · 8.0% mgmt
Financing live
Cash to close
- Down payment
- $24,750
- Closing costs
- $2,970
- Reserves months
- —
- Total cash needed
- —
Loan-product check · same deal, 3 products live
Conventional
25% down · 7.5% · 30yr
- Down + closing
- —
- Monthly P&I
- —
- Monthly cashflow
- —
- DSCR
- —
- Eligible?
- —
Personal DTI + credit; lowest rate.
DSCR
20% down · 8.5% · 30yr
- Down + closing
- —
- Monthly P&I
- —
- Monthly cashflow
- —
- DSCR
- —
- Eligible?
- —
No personal income docs; deal must DSCR.
Hard money
10% down · 12.0% · 12mo
- Down + closing
- —
- Monthly P&I
- —
- Monthly cashflow
- —
- DSCR
- —
- Eligible?
- —
Short-term bridge; refi at stabilization.
Listing history 18 events
-
2026-06-21days on market $99,000 Active 33 DOM
-
2026-06-19days on market $99,000 Active 31 DOM
-
2026-06-18days on market $99,000 Active 30 DOM
-
2026-06-17days on market $99,000 Active 29 DOM
-
2026-06-16days on market $99,000 Active 28 DOM
-
2026-06-15days on market $99,000 Active 27 DOM
-
2026-06-14days on market $99,000 Active 25 DOM
-
2026-06-12pricedays on market $99,000 Active 24 DOM
-
2026-06-09days on market $109,000 Active 21 DOM
-
2026-06-08days on market $109,000 Active 20 DOM
-
2026-06-07days on market $109,000 Active 19 DOM
-
2026-06-07days on market $109,000 Active 18 DOM
-
2026-06-04days on market $109,000 Active 15 DOM
-
2026-06-02days on market $109,000 Active 14 DOM
-
2026-06-01days on market $109,000 Active 13 DOM
-
2026-05-31days on market $109,000 Active 12 DOM
-
2026-05-31days on market $109,000 Active 11 DOM
-
2026-05-19$109,000 Active
ⓘ Source: listings_history table (triggers on properties + properties_extension) + one-shot
backfill from property_details.listing_events for pre-trigger history.
Tax reassessment forecast TN · Resets to sale price
- Current annual tax
- $247 · $21/mo
- Projected year-2 tax
- $703 · $59/mo
- Expected delta
- +$456/yr (+$38/mo · 184.6%)
ⓘ Screening estimate from a state-policy table — verify with the county assessor before closing.
Climate risk First Street
- Flood 1/10 Low FEMA zone X (unshaded) · 0% chance over 30 yrs
- Wildfire 1/10 Low
- Heat 5/10 Major 7 d/yr ≥108°F today · 21 d/yr by 30 yrs out
- Wind 4/10 Moderate 9% chance of damaging wind over 30 yrs
- Air quality 1/10 Low 0 unhealthy d/yr today · 0 by 30 yrs out
Nearby sold comps map
Loading sold comps map…
Walkable amenities ~0.75 mi
Loading nearby amenities…
Taxation est. · year 1
- Rental income
- $12,016
- − Mortgage interest
- −$5,546
- − Property taxes
- −$247
- − Insurance
- −$495
- − Repairs & maintenance
- −$961
- − Management
- −$961
- − Depreciation
- −$2,880
- Taxable income
- $926
- Est. tax owed @ 24.0%
- −$222
- After-tax cash flow
- $2,299/yr
For passive investors: Depreciation is non-cash, so a rental often shows a tax loss while cash-flowing — sheltering income. Rental losses are passive: they offset passive income freely, and up to $25,000/yr can offset ordinary (W-2) income if you actively participate and your MAGI is under $100k (phasing out to $0 by $150k); unused losses carry forward. On sale, claimed depreciation is recaptured at up to 25%, and gains may owe capital-gains tax (a 1031 exchange can defer both). Figures are a year-1 estimate at your 24.0% rate — not tax advice; consult a CPA.
Schools (NCES district)
- District
- Obion County
- NCES district ID
- 4703270
- Math proficiency
- 40% ▲ 2.00%
- Reading proficiency
- 37% ▼ -2.00%
- Median HH income
- $41,678
- Composite
- 32.48/100
- National rank
- #5710
- State rank
- #17 of 139 in TN
Livability — Union City
- Score
- 68/100
- State rank
- #90
- US rank
- #9648
Category grades
Schools grade is shown separately in the Schools card above.
Census & demographics
- Population (ZIP)
- 16,338
Population outlook (Obion County) Hauer SSP2
- Today (2025)
- 28,434 people
- By 2030
- 27,100 · -4.7%
- By 2040
- 24,381 · -14.3%
- By 2050
- 22,043 · -22.5%
- By 2075
- 18,236 · -35.9%
- By 2100
- 16,435 · -42.2%
Race, ethnicity, and origin ACS 2023
- Neighborhood character
- Predominantly White (71%)
- Race & ethnicity
- White 71% Black 16% Two or more races 8% Hispanic / Latino 7%
- Hispanic origin (detail)
- Mexican 6%
- Common ancestry
- Slovak 2% Lithuanian 1% Italian 1%
- Foreign-born
- 4% · Canada
- Languages at home
- 92% English-only · Spanish 7%
Political lean MEDSL · Obion
- 2024 margin
- Solid R (+64.9) · D 17.2% · R 82.1%
- 2008→2024 swing
- -30.8pp toward R · 2008: -34.1pp · 2024: -64.9pp
- All cycles
- 2024: R+64.9 2020: R+60.6 2016: R+58.1 2012: R+44.7 2008: R+34.1
Not yet ingested
- Civics
- —
Market trends
- HPI YoY
- ▼ -50.55%
- Current HPI
- 191.8825
- Rent YoY
- —
- Metro
- —
- State GDP YoY
- ▲ 2.78%
- F500 in state
- 22
Industry mix (Fortune 500 HQ in TN)
| Industry | F500 HQs | Revenue |
|---|---|---|
| Healthcare | 3 | $91B |
|
||
| Retail | 3 | $72B |
|
||
| Transportation / Logistics | 1 | $88B |
|
||
| Paper / Packaging | 1 | $19B |
|
||
| Insurance | 1 | $13B |
|
||
| Energy | 1 | $12B |
|
||
Price history
1 event — show timeline
- 2026-05-19 Listed $109,000 RRAR as distributed by MLS GRID
Property tax history
+2.9%/yrLatest (2025): $247 · +0.0% YoY. Source: county tax records.
Cash-flow waterfall
monthlySold comps — $/sqft
last 12 mo · ≤1 miLoading sold comps…