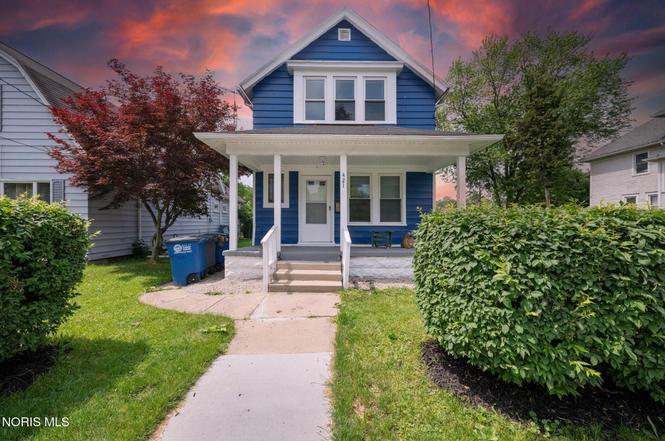
421 Columbus St · Toledo, OH
Flood risk 1/10 · Minimal
- FEMA flood zone
- X (unshaded)
- Chance of flooding over 30 yrs
- 0.0%
- Est. flood insurance / yr
- $507 – $1,088
Fire risk 1/10 · Minimal
- Est. fire insurance / yr
- $713 – $1,323
Heat risk 3/10 · Minor
- Hot days now (above 100°F)
- 7 days/yr
- Hot days in 30 yrs
- 16 days/yr
Wind risk 2/10 · Minimal
- Chance of severe wind over 30 yrs
- —
Air-quality risk 2/10 · Minimal
- Unhealthy air days now
- 1 days/yr
- Unhealthy air days in 30 yrs
- 3 days/yr
Risk factors via First Street. Map © Google.
Why this score? — see what drove the C grade
The composite is a weighted blend of 9 inputs, each scored 0–100. Each bar is that input's sub-score; the figure is the points it added to the 100-point composite (weight × sub-score).
- Cash flow +28.7/30.0
- DSCR +10.0/10.0
- 1% rule +7.6/10.0
- Livability +3.3/5.0
- Rent growth +2.5/5.0
- Condition / age +2.5/5.0
- Schools +1.6/10.0
- ARV discount +0.0/15.0
- Appreciation +0.0/10.0
$84,900
🖨 Deal sheet (PDF) 📄 Offer letter ✓ Due diligence
Listing remarks
Move in ready and beautifully remodeled! This stunning 3 bedroom, 1 bath home features fresh paint throughout, brand new vinyl plank flooring upstairs, and beautifully refinished hardwood floors on the main level. The brand new kitchen boasts a center island, ventilation hood, and modern finishes, while the completely updated bathroom adds even more appeal. Additional updates include a new furnace, hot water tank, lighting, fixtures, porch, and newer windows. A perfect blend of modern updates and timeless charm. MOVE IN READY!
Key facts
- Remodeled
- New furnace
- Brand new kitchen
Tags
Property features AI
Exterior
- Parking: Detached garage; 2 garage spaces (2 total parking spaces)
- Utilities: Public water; Public sewer; Circuit breaker electric
- Home design: Single-family residence (house); Two levels / 2 stories; Not attached, no common walls
- Construction: Aluminum siding and other construction materials; Crawl space foundation; Built for residential use
- Exterior features: Other exterior features; Shingle roof
Interior
- Kitchen: Eat-in Kitchen; Water heater listed among appliances
- Bedrooms: Bedroom 2 on Upper level (9 x 13); Bedroom 3 on Upper level (12 x 11)
- Flooring: Vinyl flooring
- Bathrooms: 1 full bathroom
- Heating & cooling: Natural gas heating; Central air conditioning
- Interior features: Eat-in kitchen; Unfinished basement
- Laundry & utility: Laundry in basement
Neighborhood map
What this means for you Summary
Snapshot
- This is a 3-bed/1.0-bath single-family listed at $85k.
Deal economics
- At list price, monthly cash flow is $284 ($3k/yr) — positive.
- The deal already cash-flows at list — no discount required.
- Meets the 1% rule at list price ($1k rent vs $85k).
- Cap rate 10.3% vs local median 7.6% in Toledo — top-decile yield for the area; either an underpriced asset or a hidden risk that comps aren't pricing in. Stress-test before assuming the spread holds.
Location & tenants
- Location reads 66/100 on livability (#645 in OH) — a middle-class / working-renter tenant base. Strengths: cost of living A+, housing A+, health & safety A+; Watch: amenities C-, crime F, commute F.
- Toledo City (urban): math 15% / reading 24% proficiency, ranked #634 of 656 in OH (top 97%) — low school quality limits family demand, transient renter base, plan for 1-2y turnover; 72% free/reduced lunch — lower-income household profile, screen leases tightly.
- Zoned schools: Woodward High School (math 2% / reading 22%, grade F, #726 of 781 statewide, top 94%, 672 students, 0% FRL) — zoned schools average 0% FRL vs 72% district-wide (72 pts lower); this property's tenant base skews higher-income than the district average.
- Market conditions: 64 active listings in the ZIP; 15 comparable units currently listed for rent nearby; rentals lingering (median 45d on market — plan ~5-8 weeks vacancy on turnover, expect pricing pressure); 53% of comp listings sitting > 30 days — soft ceiling on asking rent; 415 units permitted in Lucas County in 2024 (122 in 5+ unit buildings).
Forward outlook
- Local home prices are declining (-3.0%/yr); year-one equity from $587 of loan paydown is wiped out by about $3k of value loss. Plan a longer hold.
- Lucas County population projected at -16% by 2050 — secular population decline; favor cash flow + early exit over multi-decade hold.
- At projected returns (-3.0% appreciation + 3.0% rent growth), your $24k cash investment doubles in ~9 years — after that, you're playing with house money.
Negotiation context
- Only 6 days on market — expect competitive offers; lowballing is unlikely to land.
- Current owner paid $22k; list at $85k implies a 285% gain — meaningful room to come down on a strong offer.
Risks & watch-outs
- Watch-outs: built in 1902 — expect roof / HVAC / electrical / plumbing capex.
Questions for the listing agent
- Built in 1902 — when were the roof, HVAC, electrical panel, plumbing, and water heater last replaced?
- Is there a deadline driving the sale (1031 exchange, divorce, estate, relocation)? That informs how much negotiation room exists.
- Schools are D-rated, which usually means shorter tenancies and higher turnover. Who's the typical renter profile here, and what's been the actual vacancy rate?
- Crime grade is F in this area — have there been break-ins, vandalism, or insurance claims at this property in the last 3 years? What carrier currently insures it and at what premium?
- What's the average days-on-market for RENTAL listings here right now (not sales)? A rising rental-DOM trend means longer vacancies and softer asking-rent achievability than the comps imply.
- What's the recent tenant-quality profile in this submarket — average credit score on applications, eviction rate, late-payment / NSF rate, and stable-employment percentage? A property-management company in the area should have these aggregated.
- How much new for-sale + rental construction is in the pipeline within 1–3 miles? Heavy new supply typically softens prices + rents 12–24 months out; constrained supply supports both.
Investment metrics
- 1% rule
- 1.26% ✓
- Cap rate
- 10.30%
- Cash-on-cash
- 14.31%
- DSCR
- 1.64
- GRM
- 6.6
CMA / ARV
- ARV (on-the-fly)
- $58,635
- Comps found
- 11
Show comp detail 11 sales within ~0.75 mi
| Address | Dist | Beds/Ba | Sqft | Sold | Price | $/sf | Match |
|---|---|---|---|---|---|---|---|
| 312 Ohio St | 0.11mi | 3/1.5 | 1,376 (+6%) | 3mo | $87,000 | $63 | 81 |
| 329 Columbus St | 0.06mi | 3/1.0 | 1,272 (-2%) | 18mo | $38,500 | $30 | 78 |
| 1970 N Ontario St | 0.51mi | 3/1.0 | 1,271 (-2%) | 6mo | $35,000 | $28 | 67 |
| 1990 N Erie St | 0.46mi | 3/1.5 | 1,289 (-1%) | 11mo | $119,900 | $93 | 66 |
| 417 Cincinnati St | 0.18mi | 3/1.0 | 1,130 (-13%) | 11mo | $61,330 | $54 | 60 |
| 1960 N Erie St | 0.53mi | 3/1.0 | 1,367 (+5%) | 9mo | $30,000 | $22 | 59 |
| 1964 Chase St | 0.51mi | 4/2.0 (+1) | 1,380 (+6%) | 2mo | $14,900 | $11 | 56 |
| 409 Bassett St | 0.58mi | 3/1.0 | 1,430 (+10%) | 9mo | $65,000 | $45 | 49 |
| 331 Buckeye St | 0.67mi | 3/1.5 | 1,424 (+9%) | 4mo | $118,500 | $83 | 48 |
| 2622 N Ontario St | 0.16mi | 2/1.0 (-1) | 1,126 (-14%) | 20mo | $65,000 | $58 | 48 |
| 301 Galena St | 0.47mi | 3/2.0 | 1,218 (-6%) | 19mo | $30,000 | $25 | 47 |
Match score weights: distance 35% · size 25% · config 20% · recency 20%. Top-matched comps best support the ARV.
Projected returns pro-forma
-3.0% appreciation · 3.0% rent growth · sell at horizon
- IRR
- 4.7%
- Equity multiple
- 1.18×
- Total profit
- $4,302
- Equity at exit
- $12,659
- IRR
- 14.1%
- Equity multiple
- 2.14×
- Total profit
- $27,005
- Equity at exit
- $7,341
Cash invested: $23,772 (down + closing). Projections, not guarantees.
Landlord ↔ Tenant lean methodology
- Overall (STATE)
- 73 Landlord-Friendly
- State Ohio
- 73 Landlord-Friendly · R+6
- County
- — inherits STATE
- City
- — inherits STATE
ZIP-level market 43611
- Home prices YoY
- -24.4%
- Active inventory
- 64
- Price-to-rent
- 6.6×
Monthly cashflow live
- Estimated rent
- $1,072 high interval (Pro) →
- Mortgage (P&I)
- −$445
- Tax from tax record
- −$83 /mo · $994/yr
- Insurance
- −$35
- HOA
- −$0
- Vacancy / Maint / Mgmt
- −$225
- Net cashflow
- $284
Break-even live
Sensitivity live
| Price | -10% $332 | -5% $308 | +0% $284 | +5% $259 | +10% $235 |
|---|---|---|---|---|---|
| Rent | -10% $199 | -5% $241 | +0% $284 | +5% $326 | +10% $368 |
| Rate | -1.0pp $326 | -0.5pp $305 | base $284 | +0.5pp $262 | +1.0pp $239 |
UW: 25.0% down · 7.5% · 30yr · 1.5% tax · 5.0% vac · 8.0% maint · 8.0% mgmt
Financing live
Cash to close
- Down payment
- $21,225
- Closing costs
- $2,547
- Reserves months
- —
- Total cash needed
- —
Loan-product check · same deal, 3 products live
Conventional
25% down · 7.5% · 30yr
- Down + closing
- —
- Monthly P&I
- —
- Monthly cashflow
- —
- DSCR
- —
- Eligible?
- —
Personal DTI + credit; lowest rate.
DSCR
20% down · 8.5% · 30yr
- Down + closing
- —
- Monthly P&I
- —
- Monthly cashflow
- —
- DSCR
- —
- Eligible?
- —
No personal income docs; deal must DSCR.
Hard money
10% down · 12.0% · 12mo
- Down + closing
- —
- Monthly P&I
- —
- Monthly cashflow
- —
- DSCR
- —
- Eligible?
- —
Short-term bridge; refi at stabilization.
Rent comps 15 comps
| Address | Beds | Baths | Sqft | Rent | $/sqft | DOM | Units | Dist |
|---|---|---|---|---|---|---|---|---|
| 413 Sandusky St Toledo, OH | 2.0 | 1.0 | 900 | $775 | $0.86 | 24d | 1 | 0.12mi |
| 2453 Caledonia St Toledo, OH | 2.0 | 1.0 | 1179 | $810 | $0.69 | 14d | 1 | 1.00mi |
| 1536 N Erie St Toledo, OH | 4.0 | 1.0 | 1600 | $1,300 | $0.81 | 44d | 1 | 1.05mi |
| 1964 Burr St Toledo, OH | 3.0 | 1.0 | 1159 | $1,250 | $1.08 | 44d | 1 | 1.12mi |
| 3439 Jeannette Ave Toledo, OH | 3.0 | 1.0 | 1098 | $1,095 | $1.00 | 44d | 1 | 1.14mi |
| 1848 Genesee St Toledo, OH | 3.0 | 1.0 | 1069 | $1,300 | $1.22 | 24d | 1 | 1.17mi |
| 1848 Genesee St Toledo, OH | 3.0 | 1.0 | 1069 | $1,200 | $1.12 | 44d | 1 | 1.17mi |
| 1449 N Huron St Toledo, OH | 4.0 | 2.0 | 1430 | $1,045 | $0.73 | 14d | 1 | 1.18mi |
| 622 Whitlock Ave Toledo, OH | 3.0 | 1.0 | 925 | $1,195 | $1.29 | 44d | 1 | 1.26mi |
| 830 Homer Ave Toledo, OH | 3.0 | 1.0 | 1208 | $895 | $0.74 | 44d | 1 | 1.30mi |
| 724 Mulberry St Toledo, OH | 4.0 | 1.0 | 1530 | $995 | $0.65 | 44d | 1 | 1.33mi |
| 630 Mulberry St Toledo, OH | 2.0 | 1.0 | 1000 | $950 | $0.95 | 24d | 1 | 1.34mi |
| 1337 Moore St Toledo, OH | 3.0 | 1.5 | 1194 | $995 | $0.83 | 22d | 1 | 1.35mi |
| 3606 Doyle St Toledo, OH | 3.0 | 2.0 | 1650 | $1,100 | $0.67 | 44d | 1 | 1.44mi |
| 710 E Lake St Toledo, OH | 3.0 | 1.0 | 1242 | $1,000 | $0.81 | 14d | 1 | 1.45mi |
Listing history 6 events
-
2026-06-18days on market $84,900 Active 6 DOM
-
2026-06-17days on market $84,900 Active 5 DOM
-
2026-06-16days on market $84,900 Active 4 DOM
-
2026-06-15days on market $84,900 Active 3 DOM
-
2026-06-14remarks 532-char remark
-
2026-06-14$84,900 Active 1 DOM
ⓘ Source: listings_history table (triggers on properties + properties_extension) + one-shot
backfill from property_details.listing_events for pre-trigger history.
Tax reassessment forecast OH · Partial reset (capped growth)
- Current annual tax
- $994 · $83/mo
- Projected year-2 tax
- $1,159 · $97/mo
- Expected delta
- +$165/yr (+$14/mo · 16.6%)
ⓘ Screening estimate from a state-policy table — verify with the county assessor before closing.
Climate risk First Street
- Flood 1/10 Low FEMA zone X (unshaded) · 0% chance over 30 yrs
- Wildfire 1/10 Low
- Heat 3/10 Moderate 7 d/yr ≥100°F today · 16 d/yr by 30 yrs out
- Wind 2/10 Low
- Air quality 2/10 Low 1 unhealthy d/yr today · 3 by 30 yrs out
Nearby sold comps map
Loading sold comps map…
Walkable amenities ~0.75 mi
Loading nearby amenities…
Taxation est. · year 1
- Rental income
- $12,865
- − Mortgage interest
- −$4,756
- − Property taxes
- −$994
- − Insurance
- −$424
- − Repairs & maintenance
- −$1,029
- − Management
- −$1,029
- − Depreciation
- −$2,470
- Taxable income
- $2,163
- Est. tax owed @ 24.0%
- −$519
- After-tax cash flow
- $2,883/yr
For passive investors: Depreciation is non-cash, so a rental often shows a tax loss while cash-flowing — sheltering income. Rental losses are passive: they offset passive income freely, and up to $25,000/yr can offset ordinary (W-2) income if you actively participate and your MAGI is under $100k (phasing out to $0 by $150k); unused losses carry forward. On sale, claimed depreciation is recaptured at up to 25%, and gains may owe capital-gains tax (a 1031 exchange can defer both). Figures are a year-1 estimate at your 24.0% rate — not tax advice; consult a CPA.
Schools (NCES district)
- District
- Toledo City
- NCES district ID
- 3904490
- Math proficiency
- 15% ▼ -16.00%
- Reading proficiency
- 24% ▼ -13.00%
- Median HH income
- $32,137
- Composite
- 15.76/100
- National rank
- #9276
- State rank
- #634 of 656 in OH
Livability — Toledo
- Score
- 66/100
- State rank
- #645
- US rank
- #11442
Category grades
Schools grade is shown separately in the Schools card above.
Census & demographics
- Census place
- Toledo, OH
- County
- Lucas County · 380,724 people
- City population
- 280,811
- Metro
- Toledo, OH
- Population (ZIP)
- 18,664
- Household income
- $62,042
- Rent vs Own
- Severe rent burden
- 298.0
Population outlook (Lucas County) Hauer SSP2
- Today (2025)
- 420,751 people
- By 2030
- 410,187 · -2.5%
- By 2040
- 384,019 · -8.7%
- By 2050
- 355,125 · -15.6%
- By 2075
- 291,683 · -30.7%
- By 2100
- 233,670 · -44.5%
Race, ethnicity, and origin ACS 2023
- Neighborhood character
- Predominantly White (77%)
- Race & ethnicity
- White 77% Black 11% Hispanic / Latino 8% Two or more races 6%
- Hispanic origin (detail)
- Mexican 6%
- Common ancestry
- Romanian 13% Lithuanian 5% Slovak 2%
- Foreign-born
- 1% · Canada
- Languages at home
- 96% English-only · Spanish 2% French/Haitian/Cajun 1%
Political lean MEDSL · Lucas
- 2024 margin
- D (+12.6) · D 55.8% · R 43.2%
- 2008→2024 swing
- -18.9pp toward R · 2008: 31.4pp · 2024: 12.6pp
- All cycles
- 2024: D+12.6 2020: D+16.8 2016: D+17.4 2012: D+30.4 2008: D+31.4
Not yet ingested
- Civics
- —
Market trends
- HPI YoY
- ▼ -79.15%
- Current HPI
- 245.2841
- Rent YoY
- —
- Metro
- Toledo, OH
- State GDP YoY
- ▲ 1.98%
- F500 in state
- 48
Industry mix (Fortune 500 HQ in OH)
| Industry | F500 HQs | Revenue |
|---|---|---|
| Insurance | 3 | $145B |
|
||
| Industrial Machinery | 3 | $49B |
|
||
| Financial Services | 3 | $24B |
|
||
| Consumer Goods | 2 | $93B |
|
||
| Aerospace / Defense | 2 | $47B |
|
||
| Utilities | 2 | $33B |
|
||
Price history
+285.1% since first listed2 events — show timeline
- 2026-06-08 Listed $84,900 NORIS
- 1990-01-17 Sold (Public Records) $22,047 Public Records
Property tax history
+2.7%/yrLatest (2025): $994 · +3.2% YoY. Source: county tax records.
Cash-flow waterfall
monthlySold comps — $/sqft
last 12 mo · ≤1 miLoading sold comps…