1014 Beulah St · Eldorado, IL
Flood risk 1/10 · Minimal
- FEMA flood zone
- X (unshaded)
- Chance of flooding over 30 yrs
- 0.0%
- Est. flood insurance / yr
- $473 – $860
Fire risk 1/10 · Minimal
- Est. fire insurance / yr
- $804 – $1,492
Heat risk 5/10 · Moderate
- Hot days now (above 108°F)
- 7 days/yr
- Hot days in 30 yrs
- 21 days/yr
Wind risk 2/10 · Minimal
- Chance of severe wind over 30 yrs
- 4.0%
Air-quality risk 2/10 · Minimal
- Unhealthy air days now
- 0 days/yr
- Unhealthy air days in 30 yrs
- 1 days/yr
Risk factors via First Street. Map © Google.
Why this score? — see what drove the B grade
The composite is a weighted blend of 9 inputs, each scored 0–100. Each bar is that input's sub-score; the figure is the points it added to the 100-point composite (weight × sub-score).
- Cash flow +30.0/30.0
- ARV discount +12.2/15.0
- 1% rule +10.0/10.0
- DSCR +10.0/10.0
- Livability +3.2/5.0
- Rent growth +2.5/5.0
- Condition / age +2.5/5.0
- Schools +1.2/10.0
- Appreciation +0.0/10.0
$75,000
🖨 Deal sheet (PDF) 📄 Offer letter ✓ Due diligence
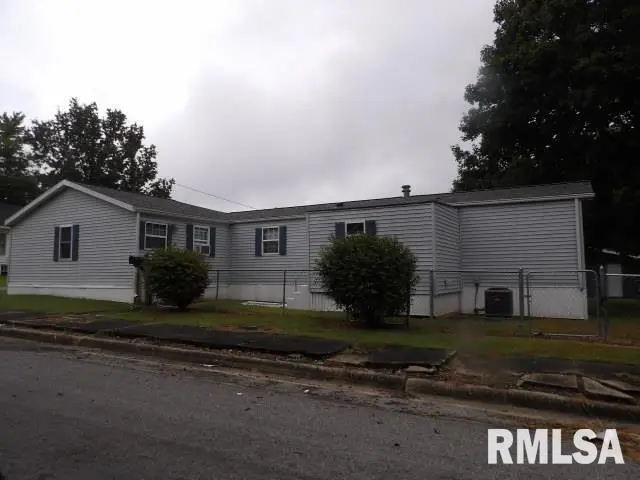
Listing remarks
Well maintained Fleetwood mobile home with additions that have been added on including a screened patio/deck. Inside you will find 3 bdrms, 2 baths, a nice sized living room with corner fireplace. Large kitchen with dining area, laundry room. Detached garage and a carport completes this nice home plus the corner lot that is sits on. Home sold As is
Key facts
- Screened patio
- Corner lot
- 0.25 acre lot
Tags
Property features AI
Finance
- Other: Possession at closing; No special service area
- HOA & community: No master association fees required
Exterior
- Parking: Detached garage and carport (1 garage space; 1 total parking space listed)
- Utilities: Public water; Public sewer; Electric with circuit breakers
- Home design: Detached single manufactured home; Owned fee simple; Age approximately 26–30 years; Living area measured by taped method; Property located in unincorporated area
- Construction: Vinyl siding construction
- Exterior features: Lot dimensions approximately 100 x 110; Lot is less than 0.25 acre; Vinyl siding
Interior
- Kitchen: Kitchen on main level (14 x 13)
- Bedrooms: 3 bedrooms (all on the main level); Bedroom dimensions include 13 x 9 and 11 x 7; master bedroom 11 x 11 (main level, master with full bath)
- Bathrooms: 2 full bathrooms
- Heating & cooling: Natural gas heating; Central air conditioning
- Interior features: 6 total rooms; School bus service available
- Laundry & utility: Main-level laundry room (12 x 8)
Neighborhood map
What this means for you Summary
Snapshot
- This is a 3-bed/2.0-bath single-family listed at $75k.
Deal economics
- At list price, monthly cash flow is $673 ($8k/yr) — positive.
- The deal already cash-flows at list — no discount required.
- Meets the 1% rule at list price ($1k rent vs $75k).
- Recommended offer: $73k (3.0% below list) — sets the bar for market timing.
- Cap rate 17.1% vs local median 9.5% in Eldorado — top-decile yield for the area; either an underpriced asset or a hidden risk that comps aren't pricing in. Stress-test before assuming the spread holds.
Location & tenants
- Location reads 65/100 on livability (#658 in IL) — a middle-class / working-renter tenant base. Strengths: cost of living A+, health & safety A+, housing B+; Watch: crime D-, amenities F, commute F.
- Eldorado CUSD 4 (town): math 11% / reading 19% proficiency, ranked #526 of 620 in IL (top 85%) — low school quality limits family demand, transient renter base, plan for 1-2y turnover.
- Zoned schools: Eldorado Elem School (math 8% / reading 7%, grade F, #1,627 of 2,056 statewide, top 81%, 545 students, 0% FRL); Eldorado Middle School (math 17% / reading 32%, grade F, #332 of 665 statewide, top 55%, 231 students, 0% FRL); Eldorado High School (math 8% / reading 17%, grade F, #506 of 693 statewide, top 74%, 301 students, 0% FRL) — zoned schools average 0% FRL vs 54% district-wide (54 pts lower); this property's tenant base skews higher-income than the district average.
- Market conditions: 46 active listings in the ZIP.
Forward outlook
- Local home prices are declining (-3.0%/yr); year-one equity from $519 of loan paydown is wiped out by about $2k of value loss. Plan a longer hold.
- Saline County population projected at -16% by 2050 — secular population decline; favor cash flow + early exit over multi-decade hold.
- At projected returns (-3.0% appreciation + 3.0% rent growth), your $21k cash investment doubles in ~4 years — after that, you're playing with house money.
Negotiation context
- It's been on market 54 days — a 3% lower offer ($73k) is reasonable based on typical stale-listing flexibility.
- 2 sale attempts with the ask held roughly flat each time — persistent listings suggest the price (not the market) is what's stuck; bring a comps-based counter.
Risks & watch-outs
- Climate carrying-cost: extreme-heat days projected 7→21/yr by 2055 (HVAC capex compounding) — expect insurance premiums to compound above CPI over the hold.
Questions for the listing agent
- It's been on market 54 days. Have you received any prior offers? Is the seller open to a 3% concession, seller financing, or rate buy-down credit?
- Is there a deadline driving the sale (1031 exchange, divorce, estate, relocation)? That informs how much negotiation room exists.
- Schools are F-rated, which usually means shorter tenancies and higher turnover. Who's the typical renter profile here, and what's been the actual vacancy rate?
- Crime grade is D in this area — have there been break-ins, vandalism, or insurance claims at this property in the last 3 years? What carrier currently insures it and at what premium?
- What's the average days-on-market for RENTAL listings here right now (not sales)? A rising rental-DOM trend means longer vacancies and softer asking-rent achievability than the comps imply.
- What's the recent tenant-quality profile in this submarket — average credit score on applications, eviction rate, late-payment / NSF rate, and stable-employment percentage? A property-management company in the area should have these aggregated.
- How much new for-sale + rental construction is in the pipeline within 1–3 miles? Heavy new supply typically softens prices + rents 12–24 months out; constrained supply supports both.
Investment metrics
- 1% rule
- 1.89% ✓
- Cap rate
- 17.06%
- Cash-on-cash
- 38.46%
- DSCR
- 2.71
- GRM
- 4.4
CMA / ARV
- ARV (median comp)
- $83,664
- List price
- $75,000
- Delta
- -10.36%
- Verdict
- UNDERPRICED
- Comps
- 20 within 1.0 mi
Show comp detail 6 sales within ~0.75 mi
| Address | Dist | Beds/Ba | Sqft | Sold | Price | $/sf | Match |
|---|---|---|---|---|---|---|---|
| 1202 Broadway St | 0.14mi | 3/2.0 | 1,364 (-7%) | 22mo | $124,900 | $92 | 63 |
| 2424 Jones St | 0.13mi | 3/1.0 | 1,296 (-12%) | 12mo | $134,000 | $103 | 60 |
| 2815 Jones St | 0.21mi | 2/1.0 (-1) | 1,250 (-15%) | 5mo | $121,100 | $97 | 52 |
| 2051 State St | 0.65mi | 2/1.0 (-1) | 1,547 (+5%) | 10mo | $79,000 | $51 | 43 |
| 2045 State St | 0.66mi | 3/2.0 | 1,333 (-9%) | 20mo | $105,000 | $79 | 37 |
| 1020 State St | 0.59mi | 2/1.5 (-1) | 1,296 (-12%) | 15mo | $58,750 | $45 | 33 |
Match score weights: distance 35% · size 25% · config 20% · recency 20%. Top-matched comps best support the ARV.
Projected returns pro-forma
-3.0% appreciation · 3.0% rent growth · sell at horizon
- IRR
- 34.6%
- Equity multiple
- 2.46×
- Total profit
- $30,693
- Equity at exit
- $11,183
- IRR
- 41.4%
- Equity multiple
- 4.90×
- Total profit
- $81,838
- Equity at exit
- $6,485
Cash invested: $21,000 (down + closing). Projections, not guarantees.
Landlord ↔ Tenant lean methodology
- Overall (STATE)
- 43 Moderately Tenant-Leaning
- State Illinois
- 43 Moderately Tenant-Leaning · D+7
- County
- — inherits STATE
- City
- — inherits STATE
ZIP-level market 62930
- Active inventory
- 46
- Price-to-rent
- 4.4×
Monthly cashflow live
- Estimated rent
- $1,419 medium interval (Pro) →
- Mortgage (P&I)
- −$393
- Tax from tax record
- −$23 /mo · $280/yr
- Insurance
- −$31
- HOA
- −$0
- Vacancy / Maint / Mgmt
- −$298
- Net cashflow
- $673
Break-even live
Sensitivity live
| Price | -10% $716 | -5% $694 | +0% $673 | +5% $652 | +10% $631 |
|---|---|---|---|---|---|
| Rent | -10% $561 | -5% $617 | +0% $673 | +5% $729 | +10% $785 |
| Rate | -1.0pp $711 | -0.5pp $692 | base $673 | +0.5pp $654 | +1.0pp $634 |
UW: 25.0% down · 7.5% · 30yr · 1.5% tax · 5.0% vac · 8.0% maint · 8.0% mgmt
Financing live
Cash to close
- Down payment
- $18,750
- Closing costs
- $2,250
- Reserves months
- —
- Total cash needed
- —
Loan-product check · same deal, 3 products live
Conventional
25% down · 7.5% · 30yr
- Down + closing
- —
- Monthly P&I
- —
- Monthly cashflow
- —
- DSCR
- —
- Eligible?
- —
Personal DTI + credit; lowest rate.
DSCR
20% down · 8.5% · 30yr
- Down + closing
- —
- Monthly P&I
- —
- Monthly cashflow
- —
- DSCR
- —
- Eligible?
- —
No personal income docs; deal must DSCR.
Hard money
10% down · 12.0% · 12mo
- Down + closing
- —
- Monthly P&I
- —
- Monthly cashflow
- —
- DSCR
- —
- Eligible?
- —
Short-term bridge; refi at stabilization.
Listing history 20 events
-
2026-06-21days on market $75,000 Active 54 DOM
-
2026-06-18days on market $75,000 Active 52 DOM
-
2026-06-17days on market $75,000 Active 51 DOM
-
2026-06-16days on market $75,000 Active 50 DOM
-
2026-06-15days on market $75,000 Active 49 DOM
-
2026-06-13days on market $75,000 Active 47 DOM
-
2026-06-12days on market $75,000 Active 46 DOM
-
2026-06-09days on market $75,000 Active 43 DOM
-
2026-06-08days on market $75,000 Active 42 DOM
-
2026-06-07days on market $75,000 Active 41 DOM
-
2026-06-07days on market $75,000 Active 40 DOM
-
2026-06-04days on market $75,000 Active 37 DOM
-
2026-06-02days on market $75,000 Active 36 DOM
-
2026-06-01days on market $75,000 Active 35 DOM
-
2026-05-31days on market $75,000 Active 34 DOM
-
2026-05-31days on market $75,000 Active 33 DOM
-
2026-04-25$75,000 Active 351-char remark
-
2025-12-17historical
-
2025-10-08historical
-
2025-09-25Active
ⓘ Source: listings_history table (triggers on properties + properties_extension) + one-shot
backfill from property_details.listing_events for pre-trigger history.
Tax reassessment forecast IL · Partial reset (capped growth)
- Current annual tax
- $280 · $23/mo
- Projected year-2 tax
- $991 · $83/mo
- Expected delta
- +$711/yr (+$59/mo · 253.6%)
ⓘ Screening estimate from a state-policy table — verify with the county assessor before closing.
Climate risk First Street
- Flood 1/10 Low FEMA zone X (unshaded) · 0% chance over 30 yrs
- Wildfire 1/10 Low
- Heat 5/10 Major 7 d/yr ≥108°F today · 21 d/yr by 30 yrs out
- Wind 2/10 Low 4% chance of damaging wind over 30 yrs
- Air quality 2/10 Low 0 unhealthy d/yr today · 1 by 30 yrs out
Nearby sold comps map
Loading sold comps map…
Walkable amenities ~0.75 mi
Loading nearby amenities…
Taxation est. · year 1
- Rental income
- $17,028
- − Mortgage interest
- −$4,201
- − Property taxes
- −$280
- − Insurance
- −$375
- − Repairs & maintenance
- −$1,362
- − Management
- −$1,362
- − Depreciation
- −$2,182
- Taxable income
- $7,265
- Est. tax owed @ 24.0%
- −$1,744
- After-tax cash flow
- $6,333/yr
For passive investors: Depreciation is non-cash, so a rental often shows a tax loss while cash-flowing — sheltering income. Rental losses are passive: they offset passive income freely, and up to $25,000/yr can offset ordinary (W-2) income if you actively participate and your MAGI is under $100k (phasing out to $0 by $150k); unused losses carry forward. On sale, claimed depreciation is recaptured at up to 25%, and gains may owe capital-gains tax (a 1031 exchange can defer both). Figures are a year-1 estimate at your 24.0% rate — not tax advice; consult a CPA.
Schools (NCES district)
- District
- Eldorado CUSD 4
- NCES district ID
- 1713660
- Math proficiency
- 11% ▼ -10.00%
- Reading proficiency
- 19% ▼ -11.00%
- Median HH income
- $36,707
- Composite
- 12.47/100
- National rank
- #9627
- State rank
- #526 of 620 in IL
Livability — Eldorado
- Score
- 65/100
- State rank
- #658
- US rank
- #13492
Category grades
Schools grade is shown separately in the Schools card above.
Census & demographics
- Census place
- Eldorado, IL
- Population (ZIP)
- 5,763
Population outlook (Saline County) Hauer SSP2
- Today (2025)
- 23,915 people
- By 2030
- 23,262 · -2.7%
- By 2040
- 21,775 · -8.9%
- By 2050
- 20,098 · -16.0%
- By 2075
- 15,234 · -36.3%
- By 2100
- 10,302 · -56.9%
Race, ethnicity, and origin ACS 2023
- Neighborhood character
- Predominantly White (92%)
- Race & ethnicity
- White 92% Hispanic / Latino 3% Two or more races 3% Asian 2%
- Common ancestry
- Slovak 5% Lithuanian 1% Serbian 1%
- Foreign-born
- 3% · Canada, South Korea, Vietnam
- Languages at home
- 98% English-only · Spanish 2%
Political lean MEDSL · Saline
- 2024 margin
- Solid R (+49.0) · D 24.8% · R 73.8% · Other 1.3%
- 2008→2024 swing
- -40.1pp toward R · 2008: -8.9pp · 2024: -49.0pp
- All cycles
- 2024: R+49.0 2020: R+47.9 2016: R+50.7 2012: R+29.0 2008: R+8.9
Not yet ingested
- Civics
- —
Market trends
- HPI YoY
- ▼ -81.64%
- Current HPI
- 75.0826
- Rent YoY
- —
- Metro
- —
- State GDP YoY
- ▲ 1.59%
- F500 in state
- 60
Industry mix (Fortune 500 HQ in IL)
| Industry | F500 HQs | Revenue |
|---|---|---|
| Insurance | 4 | $201B |
|
||
| Consumer Goods | 4 | $87B |
|
||
| Industrial Machinery | 3 | $64B |
|
||
| Healthcare | 2 | $55B |
|
||
| Retail / Pharmacy | 1 | $148B |
|
||
| Agriculture / Food | 1 | $86B |
|
||
Price history
4 events — show timeline
- 2026-04-25 Listed $75,000 MRED as Distributed by MLS Grid
- 2025-12-17 Listing Removed — MRED as Distributed by MLS Grid
- 2025-10-08 Listing Removed — RMLSA as Distributed by MLS Grid
- 2025-09-25 Listed — RMLSA as Distributed by MLS Grid
Property tax history
+59.9%/yrLatest (2024): $280 · +4.5% YoY. Source: county tax records.
Cash-flow waterfall
monthlySold comps — $/sqft
last 12 mo · ≤1 miLoading sold comps…