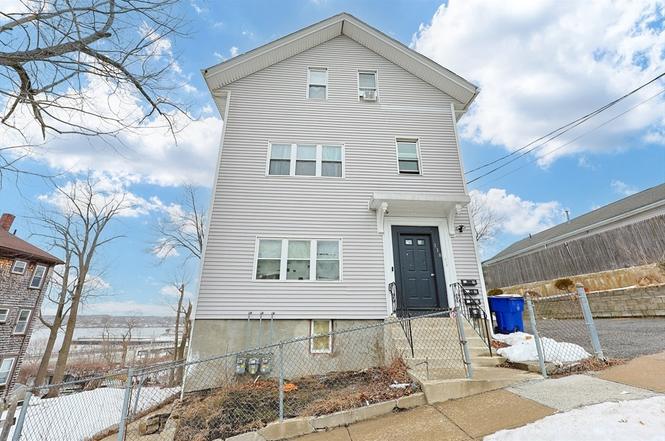
 Triplex
118 Maple St · Fall River, MA
Flood risk 1/10 · Minimal
- FEMA flood zone
- X (unshaded)
- Chance of flooding over 30 yrs
- 0.0%
- Est. flood insurance / yr
- $473 – $860
Fire risk 1/10 · Minimal
- Est. fire insurance / yr
- $915 – $1,699
Heat risk 5/10 · Moderate
- Hot days now (above 96°F)
- 7 days/yr
- Hot days in 30 yrs
- 15 days/yr
Wind risk 8/10 · Major
- Chance of severe wind over 30 yrs
- 80.0%
Air-quality risk 2/10 · Minimal
- Unhealthy air days now
- 1 days/yr
- Unhealthy air days in 30 yrs
- 2 days/yr
Risk factors via First Street. Map © Google.
Why this score? — see what drove the D- grade
The composite is a weighted blend of 9 inputs, each scored 0–100. Each bar is that input's sub-score; the figure is the points it added to the 100-point composite (weight × sub-score).
- Cash flow +15.6/30.0
- DSCR +4.8/10.0
- Rent growth +3.9/5.0
- 1% rule +3.5/10.0
- Livability +3.1/5.0
- ARV discount +2.6/15.0
- Condition / age +2.5/5.0
- Schools +1.9/10.0
- Appreciation +0.0/10.0
$729,000
🖨 Deal sheet (PDF) 📄 Offer letter ✓ Due diligence
Multi-family units
County records classify this as Multi-Family (2-4 Unit). Listing-text estimate: 3 units. confirmed
Listing remarks MLS
Life is Good! Make money here and bet on the train. Buy and hold opportunity for a savvy investor. Don't overthink it...Keep it simple, these units are cash flowing and in a prime location. The train station is literally down the street, you can see it in the drone shot. Unit 1: 3BR $1500/mo...Unit 2: 3BR $1100/mo...Unit 3: 2BR $1200. Again, don't overthink it :) keep it simple and make money. Not a fixer upper or a reclamation project...this one is making money on day one! This is not a brand new dream house...it is an older three family that has been strategically updated, managed and rented out for current market rents. Unit 3 was recently vacated. We have a waiting list of tenants available interested in it at that price. OFFER DEADLINE: MONDAY MARCH 15TH AT 12:00 PM. Seller reserves the right to accept any offer before hand.
Key facts
- Ample street parking
- Spacious driveway
- 4,439 sq ft lot
Tags
Property features AI
Finance
- Other: Property has 3 heating zones; Building area approximately 3,764 (above grade finished area)
- HOA & community: Community offers public transportation access, shopping, parks, walk/jog trails, bike path, highway access, public school access, and T-Station nearby; Not a senior community
Exterior
- Parking: Off-street paved parking; 6 open parking spaces (total 6 spaces)
- Utilities: Public water; Public sewer
- Home design: 3-family property; 3 total stories; Building has multiple units with varying floors/levels
- Construction: Stone and granite foundation; Year built: unknown/mixed
- Exterior features: Shingle roof; City and scenic views; Harbor waterview
Interior
- Kitchen: Range; Dishwasher; Refrigerator
- Bedrooms: Units include multiple bedrooms across three units (see unit levels/floors)
- Bathrooms: 3 full bathrooms
- Heating & cooling: Baseboard heating; Natural gas heating; Space heater
- Interior features: Laundry room; Total of 17 rooms
- Laundry & utility: Washer; Dryer
Neighborhood map
What this means for you Summary
Snapshot
- This is a 3 × 3-bed/1.0-bath units multifamily listed at $729k.
Deal economics
- At list price, monthly cash flow is $305 ($4k/yr) — positive. Per door: $102/mo.
- The deal already cash-flows at list — no discount required.
- To meet the 1% rule (rent ≥ 1% of price), the offer needs to be $622k (14.7% below list).
- Recommended offer: $622k (14.7% below list) — sets the bar for 1% rule.
- Cap rate 6.8% vs local median 3.5% in Fall River — top-decile yield for the area; either an underpriced asset or a hidden risk that comps aren't pricing in. Stress-test before assuming the spread holds.
Location & tenants
- Location reads 61/100 on livability (#221 in MA) — a middle-class / working-renter tenant base. Strengths: health & safety A+; Watch: cost of living D+, crime F, commute F.
- Fall River (suburban): math 17% / reading 28% proficiency, ranked #288 of 302 in MA (top 95%) — low school quality limits family demand, transient renter base, plan for 1-2y turnover; 68% free/reduced lunch — lower-income household profile, screen leases tightly.
- Zoned schools: Henry Lord Community School (math 14% / reading 21%, grade F, #811 of 938 statewide, top 87%, 815 students, 0% FRL); Morton Middle (math 18% / reading 26%, grade F, #246 of 305 statewide, top 81%, 690 students, 0% FRL); B M C Durfee High (math 19% / reading 34%, grade F, #280 of 343 statewide, top 82%, 2,460 students, 0% FRL) — zoned schools average 0% FRL vs 68% district-wide (68 pts lower); this property's tenant base skews higher-income than the district average.
- Market conditions: Rents rising fast (+5.8%/yr); 73 active listings in the ZIP; 760 units permitted in Bristol County in 2024 (142 in 5+ unit buildings).
- At $6,221/mo this rent would consume 120% of the median local household income ($62k/yr) (locally 2239% of renters already pay >50% of income on rent) — very limited rent-growth headroom before tenants either downsize or default.
Forward outlook
- Local home prices are declining (-3.0%/yr); year-one equity from $5k of loan paydown is wiped out by about $22k of value loss. Plan a longer hold.
- Bristol County population projected to shrink 3% by 2050 — rents likely to lag national; underwrite the cash flow, not the appreciation.
Negotiation context
- It's been on market 90 days — a 6% lower offer ($685k) is reasonable based on typical stale-listing flexibility.
- 5 sale attempts since 33y ago with the ask held roughly flat each time — persistent listings suggest the price (not the market) is what's stuck; bring a comps-based counter.
- Current owner paid $508k; 44% above their basis — modest negotiation headroom, anchor on the comps not their cost.
Risks & watch-outs
- Watch-outs: built in 1900 — expect roof / HVAC / electrical / plumbing capex.
- Climate carrying-cost: severe wind risk, 80% chance of damaging wind over 30y; extreme-heat days projected 7→15/yr by 2055 (HVAC capex compounding) — expect insurance premiums to compound above CPI over the hold.
Questions for the listing agent
- It's been on market 90 days. Have you received any prior offers? Is the seller open to a 15% concession, seller financing, or rate buy-down credit?
- Can we see the unit-by-unit rent roll, current vacancy, and any below-market leases? What's the average tenancy length?
- What capital expenditures (roof, boiler, parking lot, exteriors) have been made in the last 5 years, and what's planned in the next 2?
- Built in 1900 — when were the roof, HVAC, electrical panel, plumbing, and water heater last replaced?
- Why hasn't it sold? Are there any deal-killer items the seller is aware of (foundation, flood, title, zoning, code violations)?
- Is there a deadline driving the sale (1031 exchange, divorce, estate, relocation)? That informs how much negotiation room exists.
- Schools are D-rated, which usually means shorter tenancies and higher turnover. Who's the typical renter profile here, and what's been the actual vacancy rate?
- Crime grade is F in this area — have there been break-ins, vandalism, or insurance claims at this property in the last 3 years? What carrier currently insures it and at what premium?
- The area grade is low — what's the realistic commute time and amenity access for the typical tenant pool here? Any planned neighborhood developments (good or bad) we should know about?
- What's the average days-on-market for RENTAL listings here right now (not sales)? A rising rental-DOM trend means longer vacancies and softer asking-rent achievability than the comps imply.
- What's the recent tenant-quality profile in this submarket — average credit score on applications, eviction rate, late-payment / NSF rate, and stable-employment percentage? A property-management company in the area should have these aggregated.
- How much new apartment / multifamily construction is in the pipeline within 1–3 miles? Heavy new supply (>2% of stock underway) typically softens rents 12–24 months out; light construction supports rent growth.
Investment metrics
- 1% rule
- 0.85% ✗
- Cap rate
- 6.80%
- Cash-on-cash
- 1.79%
- DSCR
- 1.08
- GRM
- 9.8
CMA / ARV
- ARV (on-the-fly)
- $657,492
- Comps found
- 12
Show comp detail 12 sales within ~0.75 mi
| Address | Dist | Beds/Ba | Sqft | Sold | Price | $/sf | Match |
|---|---|---|---|---|---|---|---|
| 154 Barnaby St | 0.29mi | 6/3.0 | 3,177 (-10%) | 2mo | $501,000 | $158 | 69 |
| 877 High St | 0.50mi | 6/3.0 | 3,715 (+6%) | 11mo | $649,900 | $175 | 58 |
| 612 June St | 0.43mi | 6/3.0 | 3,633 (+3%) | 20mo | $625,000 | $172 | 58 |
| 545 Robeson St | 0.71mi | 7/3.5 (+1) | 3,535 (+0%) | 2mo | $710,000 | $201 | 57 |
| 356 Linden St | 0.50mi | 7/3.0 (+1) | 3,470 (-1%) | 16mo | $650,000 | $187 | 56 |
| 52 Underwood St | 0.51mi | 6/3.5 | 3,751 (+7%) | 12mo | $680,000 | $181 | 53 |
| 256 Maple St | 0.13mi | 7/3.5 (+1) | 3,890 (+11%) | 20mo | $690,000 | $177 | 53 |
| 82 Summerfield St | 0.71mi | 6/3.0 | 3,723 (+6%) | 8mo | $720,000 | $193 | 50 |
| 294 French St | 0.45mi | 5/4.0 (-1) | 3,636 (+3%) | 19mo | $774,000 | $213 | 48 |
| 101 Cory St | 0.74mi | 6/3.0 | 3,321 (-6%) | 11mo | $640,000 | $193 | 47 |
| 146 Franklin St | 0.44mi | 6/2.0 | 3,052 (-13%) | 8mo | $650,000 | $213 | 47 |
| 702 Robeson St | 0.71mi | 7/3.5 (+1) | 3,250 (-8%) | 18mo | $582,450 | $179 | 32 |
Match score weights: distance 35% · size 25% · config 20% · recency 20%. Top-matched comps best support the ARV.
Projected returns pro-forma
-3.0% appreciation · 5.76% rent growth · sell at horizon
- IRR
- -10.7%
- Equity multiple
- 0.60×
- Total profit
- $-81,102
- Equity at exit
- $108,696
- IRR
- 1.9%
- Equity multiple
- 1.15×
- Total profit
- $30,818
- Equity at exit
- $63,031
Cash invested: $204,120 (down + closing). Projections, not guarantees.
Landlord ↔ Tenant lean methodology
- Overall (STATE)
- 20 Strongly Tenant-Friendly
- State Massachusetts
- 20 Strongly Tenant-Friendly · D+15
- County
- — inherits STATE
- City
- — inherits STATE
ZIP-level market 02720
- Home prices YoY
- -15.1%
- Rents YoY
- 5.8%
- Active inventory
- 73
- Price-to-rent
- 29.3×
Monthly cashflow live
- Estimated rent
- $6,221 high interval (Pro) →
- Mortgage (P&I)
- −$3,823
- Tax from tax record
- −$483 /mo · $5,791/yr
- Insurance
- −$304
- HOA
- −$0
- Vacancy / Maint / Mgmt
- −$1,306
- Net cashflow
- $305
Break-even live
Sensitivity live
| Price | -10% $718 | -5% $512 | +0% $305 | +5% $99 | +10% $-107 |
|---|---|---|---|---|---|
| Rent | -10% $-186 | -5% $60 | +0% $305 | +5% $551 | +10% $797 |
| Rate | -1.0pp $672 | -0.5pp $491 | base $305 | +0.5pp $116 | +1.0pp $-76 |
3-unit breakdown (identical units grouped — click to expand)
| Units | Beds | Baths | Est. rent |
|---|---|---|---|
| 3× units | 3 | 1 | $6,222 |
| #1 | 3 | 1 | $2,074 |
| #2 | 3 | 1 | $2,074 |
| #3 | 3 | 1 | $2,074 |
| Total (3 units) | $6,221 | ||
UW: 25.0% down · 7.5% · 30yr · 1.5% tax · 5.0% vac · 8.0% maint · 8.0% mgmt
Financing live
Cash to close
- Down payment
- $182,250
- Closing costs
- $21,870
- Reserves months
- —
- Total cash needed
- —
Loan-product check · same deal, 3 products live
Conventional
25% down · 7.5% · 30yr
- Down + closing
- —
- Monthly P&I
- —
- Monthly cashflow
- —
- DSCR
- —
- Eligible?
- —
Personal DTI + credit; lowest rate.
DSCR
20% down · 8.5% · 30yr
- Down + closing
- —
- Monthly P&I
- —
- Monthly cashflow
- —
- DSCR
- —
- Eligible?
- —
No personal income docs; deal must DSCR.
Hard money
10% down · 12.0% · 12mo
- Down + closing
- —
- Monthly P&I
- —
- Monthly cashflow
- —
- DSCR
- —
- Eligible?
- —
Short-term bridge; refi at stabilization.
Listing history 35 events
-
2026-06-21days on market $729,000 Active 90 DOM
-
2026-06-18days on market $729,000 Active 87 DOM
-
2026-06-17days on market $729,000 Active 86 DOM
-
2026-06-16days on market $729,000 Active 85 DOM
-
2026-06-15days on market $729,000 Active 84 DOM
-
2026-06-13days on market $729,000 Active 82 DOM
-
2026-06-09days on market $729,000 Active 78 DOM
-
2026-06-08days on market $729,000 Active 77 DOM
-
2026-06-07days on market $729,000 Active 76 DOM
-
2026-06-05days on market $729,000 Active 73 DOM
-
2026-06-03days on market $729,000 Active 72 DOM
-
2026-06-02days on market $729,000 Active 71 DOM
-
2026-06-01days on market $729,000 Active 70 DOM
-
2026-05-31statusdays on market $729,000 Active 69 DOM
-
2026-05-06status Under Agreement
-
2026-04-22historical Contingent
-
2026-03-02$739,000 New
-
2021-05-13soldstatus $507,500 Sold 850-char remark
Show marketing remark (850 chars)
Life is Good! Make money here and bet on the train. Buy and hold opportunity for a savvy investor. Don't overthink it...Keep it simple, these units are cash flowing and in a prime location. The train station is literally down the street, you can see it in the drone shot. Unit 1: 3BR $1500/mo...Unit 2: 3BR $1100/mo...Unit 3: 2BR $1200. Again, don't overthink it :) keep it simple and make money. Not a fixer upper or a reclamation project...this one is making money on day one! This is not a brand new dream house...it is an older three family that has been strategically updated, managed and rented out for current market rents. Unit 3 was recently vacated. We have a waiting list of tenants available interested in it at that price. OFFER DEADLINE: MONDAY MARCH 15TH AT 12:00 PM. Seller reserves the right to accept any offer before hand.
-
2021-03-16status Under Agreement 850-char remark
Show marketing remark (850 chars)
Life is Good! Make money here and bet on the train. Buy and hold opportunity for a savvy investor. Don't overthink it...Keep it simple, these units are cash flowing and in a prime location. The train station is literally down the street, you can see it in the drone shot. Unit 1: 3BR $1500/mo...Unit 2: 3BR $1100/mo...Unit 3: 2BR $1200. Again, don't overthink it :) keep it simple and make money. Not a fixer upper or a reclamation project...this one is making money on day one! This is not a brand new dream house...it is an older three family that has been strategically updated, managed and rented out for current market rents. Unit 3 was recently vacated. We have a waiting list of tenants available interested in it at that price. OFFER DEADLINE: MONDAY MARCH 15TH AT 12:00 PM. Seller reserves the right to accept any offer before hand.
-
2021-03-10$490,000 New 850-char remark
Show marketing remark (850 chars)
Life is Good! Make money here and bet on the train. Buy and hold opportunity for a savvy investor. Don't overthink it...Keep it simple, these units are cash flowing and in a prime location. The train station is literally down the street, you can see it in the drone shot. Unit 1: 3BR $1500/mo...Unit 2: 3BR $1100/mo...Unit 3: 2BR $1200. Again, don't overthink it :) keep it simple and make money. Not a fixer upper or a reclamation project...this one is making money on day one! This is not a brand new dream house...it is an older three family that has been strategically updated, managed and rented out for current market rents. Unit 3 was recently vacated. We have a waiting list of tenants available interested in it at that price. OFFER DEADLINE: MONDAY MARCH 15TH AT 12:00 PM. Seller reserves the right to accept any offer before hand.
-
2016-04-30soldstatus $186,000 Sold 154-char remark
Show marketing remark (154 chars)
Gret three family all redone in the last 7 years.....water views, Live in one unit and live vertualy rent free! Can be sold as a package with MLS #7197023
-
2016-03-28status Under Agreement 154-char remark
Show marketing remark (154 chars)
Gret three family all redone in the last 7 years.....water views, Live in one unit and live vertualy rent free! Can be sold as a package with MLS #7197023
-
2016-03-11price $189,900 154-char remark
Show marketing remark (154 chars)
Gret three family all redone in the last 7 years.....water views, Live in one unit and live vertualy rent free! Can be sold as a package with MLS #7197023
-
2016-03-10$169,900 New 154-char remark
Show marketing remark (154 chars)
Gret three family all redone in the last 7 years.....water views, Live in one unit and live vertualy rent free! Can be sold as a package with MLS #7197023
-
2006-11-16soldstatus $210,000
-
2006-10-20soldstatus $181,283
-
1999-01-06soldstatus $131,300
-
1999-01-05soldstatus $131,300
-
1998-01-04$129,900
-
1997-10-29soldstatus $32,000
-
1997-10-29soldstatus $50,000
-
1993-09-01soldstatus $120,000
-
1993-08-31soldstatus $120,000
-
1993-04-16soldstatus $86,370
-
1993-01-26$155,000
ⓘ Source: listings_history table (triggers on properties + properties_extension) + one-shot
backfill from property_details.listing_events for pre-trigger history.
Tax reassessment forecast MA · Partial reset (capped growth)
- Current annual tax
- $5,791 · $483/mo
- Projected year-2 tax
- $7,379 · $615/mo
- Expected delta
- +$1,588/yr (+$132/mo · 27.4%)
ⓘ Screening estimate from a state-policy table — verify with the county assessor before closing.
Climate risk First Street
- Flood 1/10 Low FEMA zone X (unshaded) · 0% chance over 30 yrs
- Wildfire 1/10 Low
- Heat 5/10 Major 7 d/yr ≥96°F today · 15 d/yr by 30 yrs out
- Wind 8/10 Severe 80% chance of damaging wind over 30 yrs
- Air quality 2/10 Low 1 unhealthy d/yr today · 2 by 30 yrs out
Nearby sold comps map
Loading sold comps map…
Walkable amenities ~0.75 mi
Loading nearby amenities…
Taxation est. · year 1
- Rental income
- $74,652
- − Mortgage interest
- −$40,835
- − Property taxes
- −$5,791
- − Insurance
- −$3,645
- − Repairs & maintenance
- −$5,972
- − Management
- −$5,972
- − Depreciation
- −$21,207
- Taxable loss
- −$8,771
- Est. tax savings @ 24.0%
- +$2,105
- After-tax cash flow
- $5,769/yr
For passive investors: Depreciation is non-cash, so a rental often shows a tax loss while cash-flowing — sheltering income. Rental losses are passive: they offset passive income freely, and up to $25,000/yr can offset ordinary (W-2) income if you actively participate and your MAGI is under $100k (phasing out to $0 by $150k); unused losses carry forward. On sale, claimed depreciation is recaptured at up to 25%, and gains may owe capital-gains tax (a 1031 exchange can defer both). Figures are a year-1 estimate at your 24.0% rate — not tax advice; consult a CPA.
Schools (NCES district)
- District
- Fall River
- NCES district ID
- 2504830
- Math proficiency
- 17% ▼ -15.00%
- Reading proficiency
- 28% ▼ -6.00%
- Median HH income
- $35,773
- Composite
- 18.59/100
- National rank
- #8905
- State rank
- #288 of 302 in MA
Livability — Fall River
- Score
- 61/100
- State rank
- #221
- US rank
- #18220
Category grades
Schools grade is shown separately in the Schools card above.
Census & demographics
- Census place
- Fall River, MA
- County
- Bristol County · 342,083 people
- City population
- 93,033
- Metro
- Providence-Warwick, RI-MA
- Population (ZIP)
- 30,940
- Household income
- $62,196
- Rent vs Own
- Severe rent burden
- 2239.0
Population outlook (Bristol County) Hauer SSP2
- Today (2025)
- 570,212 people
- By 2030
- 571,181 · +0.2%
- By 2040
- 565,389 · -0.8%
- By 2050
- 552,141 · -3.2%
- By 2075
- 520,923 · -8.6%
- By 2100
- 474,363 · -16.8%
Race, ethnicity, and origin ACS 2023
- Neighborhood character
- Predominantly White (75%)
- Race & ethnicity
- White 75% Hispanic / Latino 11% Two or more races 8% Black 6% Asian 3%
- Hispanic origin (detail)
- Puerto Rican 5% Dominican 1%
- Common ancestry
- Russian 37% Lithuanian 7% Romanian 2%
- Foreign-born
- 21% · Canada, China, Jamaica
- Languages at home
- 66% English-only · Other Indo-European 21% Spanish 8% French/Haitian/Cajun 2%
Political lean MEDSL · Bristol
- 2024 margin
- Toss-up / Even · D 49.8% · R 48.5% · Other 1.8%
- 2008→2024 swing
- -21.9pp toward R · 2008: 23.2pp · 2024: 1.3pp
- All cycles
- 2024: D+1.3 2020: D+12.0 2016: D+9.3 2012: D+20.5 2008: D+23.2
Not yet ingested
- Civics
- —
Market trends
- HPI YoY
- ▼ -63.98%
- Current HPI
- 360.4882
- Rent YoY
- ▲ 5.76%
- Metro
- Providence-Warwick, RI-MA
- State GDP YoY
- ▲ 2.28%
- F500 in state
- 38
Industry mix (Fortune 500 HQ in MA)
| Industry | F500 HQs | Revenue |
|---|---|---|
| Technology | 3 | $17B |
|
||
| Insurance | 2 | $84B |
|
||
| Retail | 2 | $76B |
|
||
| Life Sciences | 1 | $43B |
|
||
| Energy Technology | 1 | $31B |
|
||
| Aerospace / Defense | 1 | $18B |
|
||
Price history
+376.8% since first listed21 events — show timeline
- 2026-05-06 Pending — MLS PIN
- 2026-04-22 Contingent — MLS PIN
- 2026-03-02 Listed $739,000 MLS PIN
- 2021-05-13 Sold (MLS) $507,500 MLS PIN
- 2021-03-16 Pending — MLS PIN
- 2021-03-10 Listed $490,000 MLS PIN
- 2016-04-30 Sold (MLS) $186,000 MLS PIN
- 2016-03-28 Pending — MLS PIN
- 2016-03-11 Price Changed $189,900 MLS PIN
- 2016-03-10 Listed $169,900 MLS PIN
- 2006-11-16 Sold (Public Records) $210,000 Public Records
- 2006-10-20 Sold (Public Records) $181,283 Public Records
- 1999-01-06 Sold (MLS) $131,300 MLS PIN
- 1999-01-05 Sold (Public Records) $131,300 Public Records
- 1998-01-04 Listed $129,900 MLS PIN
- 1997-10-29 Sold (Public Records) $50,000 Public Records
- 1997-10-29 Sold (Public Records) $32,000 Public Records
- 1993-09-01 Sold (MLS) $120,000 MLS PIN
- 1993-08-31 Sold (Public Records) $120,000 Public Records
- 1993-04-16 Sold (Public Records) $86,370 Public Records
- 1993-01-26 Listed $155,000 MLS PIN
Property tax history
+7.0%/yrLatest (2023): $5,791 · +31.4% YoY. Source: county tax records.
Cash-flow waterfall
monthlySold comps — $/sqft
last 12 mo · ≤1 miLoading sold comps…