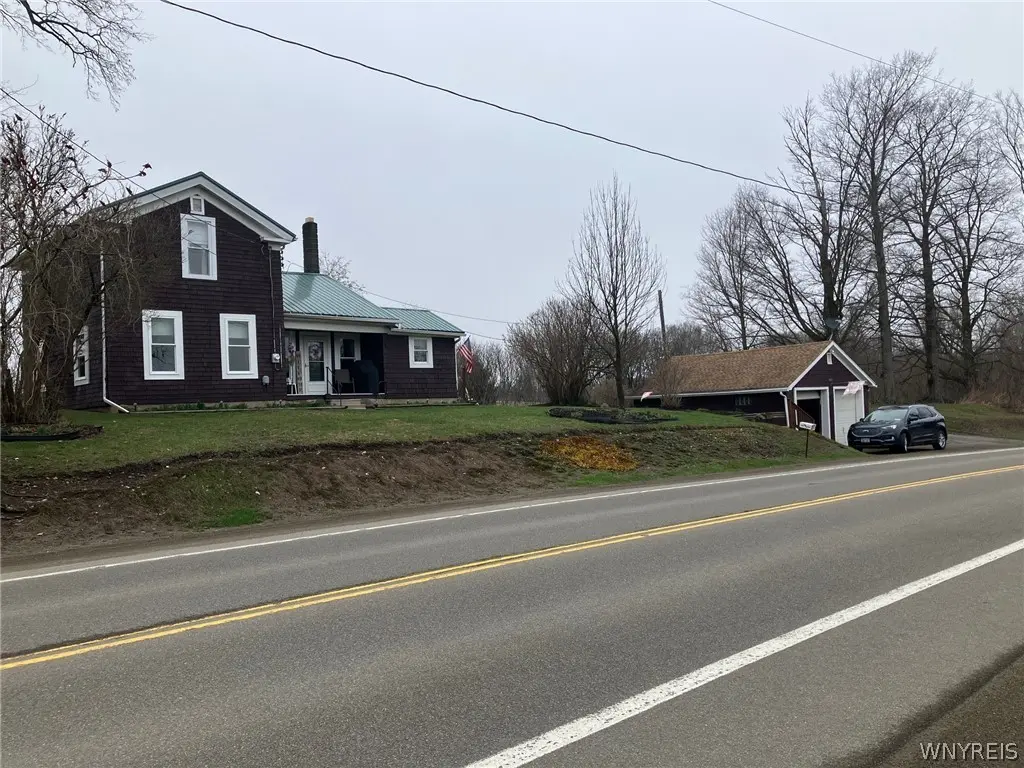
5663 Rt-39 · Pike, NY
Flood risk 1/10 · Minimal
- FEMA flood zone
- X
- Chance of flooding over 30 yrs
- 0.0%
- Est. flood insurance / yr
- $473 – $860
Fire risk 1/10 · Minimal
- Est. fire insurance / yr
- $691 – $1,283
Heat risk 1/10 · Minimal
- Hot days now (above 90°F)
- 7 days/yr
- Hot days in 30 yrs
- 16 days/yr
Wind risk 1/10 · Minimal
- Chance of severe wind over 30 yrs
- —
Air-quality risk 1/10 · Minimal
- Unhealthy air days now
- 0 days/yr
- Unhealthy air days in 30 yrs
- 0 days/yr
Risk factors via First Street. Map © Google.
Why this score? — see what drove the D+ grade
The composite is a weighted blend of 9 inputs, each scored 0–100. Each bar is that input's sub-score; the figure is the points it added to the 100-point composite (weight × sub-score).
- Cash flow +11.3/30.0
- ARV discount +10.6/15.0
- Appreciation +5.4/10.0
- Schools +4.6/10.0
- 1% rule +3.7/10.0
- DSCR +3.3/10.0
- Livability +3.0/5.0
- Rent growth +2.5/5.0
- Condition / age +2.5/5.0
$140,000
🖨 Deal sheet (PDF) 📄 Offer letter ✓ Due diligence
Listing remarks
Come and check out this well maintained 3 bed, 1 bath country home with new kitchen, floors, windows, roof, furnace. So many updates. Large living room with newer gas stove to get cozy on those cool nights! 3 large bedrooms, first floor laundry, detached garage. Letchworth School District.
Key facts
- New floors
- New furnace
- New kitchen
Tags
Neighborhood map
What this means for you Summary
Snapshot
- This is a 3-bed/1.0-bath single-family listed at $140k.
Deal economics
- At list price, monthly cash flow is $-50 ($-601/yr) — negative.
- To cash-flow at today's rent, offer at most $131k (6.3% below list).
- To meet the 1% rule (rent ≥ 1% of price), the offer needs to be $122k (13.1% below list).
- Recommended offer: $122k (13.1% below list) — sets the bar for 1% rule.
Location & tenants
- Location reads 59/100 on livability (#1,024 in NY) — a working-class tenant base; expect higher turnover. Strengths: cost of living A+, housing A+; Watch: employment D+, crime F, amenities F.
- Letchworth Central School District (rural): math 52% / reading 57% proficiency, ranked #318 of 590 in NY (top 54%) — acceptable for families but not a draw, mixed tenant base, ~2y average lease.
- Zoned schools: Letchworth Elementary School (math 72% / reading 62%, grade B+, #525 of 2,108 statewide, top 27%, 368 students, 44% FRL); Letchworth Middle School (math 34% / reading 54%, grade D, #363 of 729 statewide, top 50%, 278 students, 49% FRL); Letchworth Senior High School (math 95% / reading 75%, grade A, #369 of 1,100 statewide, top 34%, 269 students, 41% FRL) — zoned schools average 44% FRL vs 29% district-wide (15 pts higher); higher-poverty schools than district average — tighter screening recommended.
- Market conditions: 16 active listings in the ZIP; 83 units permitted in Wyoming County in 2024 (0 in 5+ unit buildings).
Forward outlook
- In year one you build about $2k of equity ($968 loan paydown + $1k appreciation (0.7% local appreciation)).
- Wyoming County population projected at -16% by 2050 — secular population decline; favor cash flow + early exit over multi-decade hold.
Negotiation context
- Only 5 days on market — expect competitive offers; lowballing is unlikely to land.
Risks & watch-outs
- Watch-outs: built in 1920 — expect roof / HVAC / electrical / plumbing capex.
Questions for the listing agent
- What do current leases actually rent for vs. the listed asking? Can we see a recent rent roll and the last 12 months of T-12 income?
- Built in 1920 — when were the roof, HVAC, electrical panel, plumbing, and water heater last replaced?
- Is there a deadline driving the sale (1031 exchange, divorce, estate, relocation)? That informs how much negotiation room exists.
- Schools are F-rated, which usually means shorter tenancies and higher turnover. Who's the typical renter profile here, and what's been the actual vacancy rate?
- Crime grade is F in this area — have there been break-ins, vandalism, or insurance claims at this property in the last 3 years? What carrier currently insures it and at what premium?
- The area grade is low — what's the realistic commute time and amenity access for the typical tenant pool here? Any planned neighborhood developments (good or bad) we should know about?
- What's the average days-on-market for RENTAL listings here right now (not sales)? A rising rental-DOM trend means longer vacancies and softer asking-rent achievability than the comps imply.
- What's the recent tenant-quality profile in this submarket — average credit score on applications, eviction rate, late-payment / NSF rate, and stable-employment percentage? A property-management company in the area should have these aggregated.
- How much new for-sale + rental construction is in the pipeline within 1–3 miles? Heavy new supply typically softens prices + rents 12–24 months out; constrained supply supports both.
Investment metrics
- 1% rule
- 0.87% ✗
- Cap rate
- 5.86%
- Cash-on-cash
- -1.53%
- DSCR
- 0.93
- GRM
- 9.6
CMA / ARV
- ARV (on-the-fly)
- $150,294
- Comps found
- 1
Show comp detail 1 sale within ~0.75 mi
| Address | Dist | Beds/Ba | Sqft | Sold | Price | $/sf | Match |
|---|---|---|---|---|---|---|---|
| 5663 Rt-39 | 0.00mi | 3/1.0 | 1,354 (0%) | 1mo | $150,000 | $111 | 100 |
Match score weights: distance 35% · size 25% · config 20% · recency 20%. Top-matched comps best support the ARV.
Projected returns pro-forma
0.73% appreciation · 3.0% rent growth · sell at horizon
- IRR
- -1.2%
- Equity multiple
- 0.94×
- Total profit
- $-2,354
- Equity at exit
- $45,848
- IRR
- 3.9%
- Equity multiple
- 1.46×
- Total profit
- $18,093
- Equity at exit
- $59,450
Cash invested: $39,200 (down + closing). Projections, not guarantees.
Landlord ↔ Tenant lean methodology
- Overall (STATE)
- 15 Strongly Tenant-Friendly
- State New York
- 15 Strongly Tenant-Friendly · D+10
- County
- — inherits STATE
- City
- — inherits STATE
ZIP-level market 14427
- Home prices YoY
- 0.3%
- Active inventory
- 16
- Price-to-rent
- 9.6×
Monthly cashflow live
- Estimated rent
- $1,217 medium interval (Pro) →
- Mortgage (P&I)
- −$734
- Tax from tax record
- −$219 /mo · $2,625/yr
- Insurance
- −$58
- HOA
- −$0
- Vacancy / Maint / Mgmt
- −$256
- Net cashflow
- $-50
Break-even live
Sensitivity live
| Price | -10% $29 | -5% $-10 | +0% $-50 | +5% $-90 | +10% $-129 |
|---|---|---|---|---|---|
| Rent | -10% $-146 | -5% $-98 | +0% $-50 | +5% $-2 | +10% $46 |
| Rate | -1.0pp $20 | -0.5pp $-14 | base $-50 | +0.5pp $-86 | +1.0pp $-123 |
UW: 25.0% down · 7.5% · 30yr · 1.5% tax · 5.0% vac · 8.0% maint · 8.0% mgmt
Financing live
Cash to close
- Down payment
- $35,000
- Closing costs
- $4,200
- Reserves months
- —
- Total cash needed
- —
Loan-product check · same deal, 3 products live
Conventional
25% down · 7.5% · 30yr
- Down + closing
- —
- Monthly P&I
- —
- Monthly cashflow
- —
- DSCR
- —
- Eligible?
- —
Personal DTI + credit; lowest rate.
DSCR
20% down · 8.5% · 30yr
- Down + closing
- —
- Monthly P&I
- —
- Monthly cashflow
- —
- DSCR
- —
- Eligible?
- —
No personal income docs; deal must DSCR.
Hard money
10% down · 12.0% · 12mo
- Down + closing
- —
- Monthly P&I
- —
- Monthly cashflow
- —
- DSCR
- —
- Eligible?
- —
Short-term bridge; refi at stabilization.
Listing history 2 events
-
2026-04-06status Pending
-
2026-04-01$140,000 Active
ⓘ Source: listings_history table (triggers on properties + properties_extension) + one-shot
backfill from property_details.listing_events for pre-trigger history.
Tax reassessment forecast NY · Partial reset (capped growth)
- Current annual tax
- $2,625 · $219/mo
- Projected year-2 tax
- $2,625 · $219/mo
- Expected delta
- $0/yr ($0/mo · 0.0%)
ⓘ Screening estimate from a state-policy table — verify with the county assessor before closing.
Climate risk First Street
- Flood 1/10 Low FEMA zone X · 0% chance over 30 yrs
- Wildfire 1/10 Low
- Heat 1/10 Low 7 d/yr ≥90°F today · 16 d/yr by 30 yrs out
- Wind 1/10 Low
- Air quality 1/10 Low 0 unhealthy d/yr today · 0 by 30 yrs out
Nearby sold comps map
Loading sold comps map…
Walkable amenities ~0.75 mi
Loading nearby amenities…
Taxation est. · year 1
- Rental income
- $14,601
- − Mortgage interest
- −$7,842
- − Property taxes
- −$2,625
- − Insurance
- −$700
- − Repairs & maintenance
- −$1,168
- − Management
- −$1,168
- − Depreciation
- −$4,073
- Taxable loss
- −$2,975
- Est. tax savings @ 24.0%
- +$714
- After-tax cash flow
- $113/yr
For passive investors: Depreciation is non-cash, so a rental often shows a tax loss while cash-flowing — sheltering income. Rental losses are passive: they offset passive income freely, and up to $25,000/yr can offset ordinary (W-2) income if you actively participate and your MAGI is under $100k (phasing out to $0 by $150k); unused losses carry forward. On sale, claimed depreciation is recaptured at up to 25%, and gains may owe capital-gains tax (a 1031 exchange can defer both). Figures are a year-1 estimate at your 24.0% rate — not tax advice; consult a CPA.
Schools (NCES district)
- District
- Letchworth Central School District
- NCES district ID
- 3617130
- Math proficiency
- 52% ▼ -6.00%
- Reading proficiency
- 57% ▲ 14.00%
- Median HH income
- $48,908
- Composite
- 46.4/100
- National rank
- #2457
- State rank
- #318 of 590 in NY
Livability — Pike
- Score
- 59/100
- State rank
- #1024
- US rank
- #19969
Category grades
Schools grade is shown separately in the Schools card above.
Census & demographics
- City population
- 110
- Population (ZIP)
- 1,875
Population outlook (Wyoming County) Hauer SSP2
- Today (2025)
- 38,976 people
- By 2030
- 37,826 · -3.0%
- By 2040
- 35,585 · -8.7%
- By 2050
- 32,841 · -15.7%
- By 2075
- 25,920 · -33.5%
- By 2100
- 19,082 · -51.0%
Race, ethnicity, and origin ACS 2023
- Neighborhood character
- Predominantly White (90%)
- Race & ethnicity
- White 90% Two or more races 5% Hispanic / Latino 3% Black 1%
- Common ancestry
- Romanian 10% Iranian 4% Lithuanian 3%
- Foreign-born
- 1%
Political lean MEDSL · Wyoming
- 2024 margin
- Solid R (+48.2) · D 25.9% · R 74.1%
- 2008→2024 swing
- -22.1pp toward R · 2008: -26.1pp · 2024: -48.2pp
- All cycles
- 2024: R+48.2 2020: R+45.5 2016: R+51.0 2012: R+29.6 2008: R+26.1
Not yet ingested
- Civics
- —
Market trends
- HPI YoY
- ▲ 0.73%
- Current HPI
- 256.065
- Rent YoY
- —
- Metro
- —
- State GDP YoY
- ▲ 2.60%
- F500 in state
- 92
Industry mix (Fortune 500 HQ in NY)
| Industry | F500 HQs | Revenue |
|---|---|---|
| Financial Services | 10 | $950B |
|
||
| Consumer Goods | 9 | $162B |
|
||
| Insurance | 4 | $225B |
|
||
| Telecommunications | 2 | $144B |
|
||
| Pharmaceuticals | 2 | $112B |
|
||
| Media / Entertainment | 2 | $69B |
|
||
Price history
2 events — show timeline
- 2026-04-06 Pending — WNYREIS
- 2026-04-01 Listed $140,000 WNYREIS
Property tax history
+5.9%/yrLatest (2025): $2,625 · +0.9% YoY. Source: county tax records.
Cash-flow waterfall
monthlySold comps — $/sqft
last 12 mo · ≤1 miLoading sold comps…