201 E High St · Syracuse, MO
Flood risk 1/10 · Minimal
- FEMA flood zone
- X (unshaded)
- Chance of flooding over 30 yrs
- 0.0%
- Est. flood insurance / yr
- $507 – $1,088
Fire risk 4/10 · Minor
- Est. fire insurance / yr
- $1,054 – $1,958
Heat risk 4/10 · Minor
- Hot days now (above 106°F)
- 7 days/yr
- Hot days in 30 yrs
- 18 days/yr
Wind risk 2/10 · Minimal
- Chance of severe wind over 30 yrs
- 0.0%
Air-quality risk 2/10 · Minimal
- Unhealthy air days now
- 0 days/yr
- Unhealthy air days in 30 yrs
- 1 days/yr
Risk factors via First Street. Map © Google.
Why this score? — see what drove the B grade
The composite is a weighted blend of 9 inputs, each scored 0–100. Each bar is that input's sub-score; the figure is the points it added to the 100-point composite (weight × sub-score).
- Cash flow +30.0/30.0
- DSCR +10.0/10.0
- 1% rule +8.0/10.0
- ARV discount +7.5/15.0
- Appreciation +5.0/10.0
- Livability +2.6/5.0
- Rent growth +2.5/5.0
- Schools +2.5/10.0
- Condition / age +2.5/5.0
$109,999
🖨 Deal sheet 📄 Offer letter ✓ Due diligence
Listing remarks
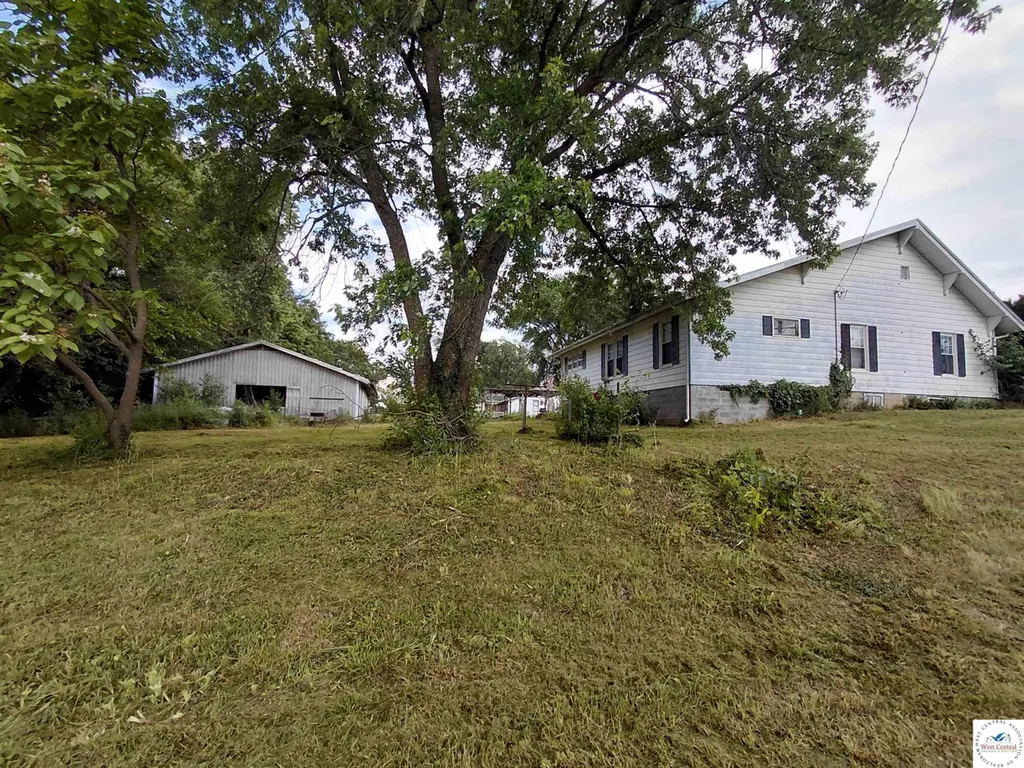
Investment opportunity in the heart of Syracuse! This 4-bedroom, 1.5-bath home sits on a rare triple corner lot and includes a large metal outbuilding (36' x 56') The property needs repairs, cleanup, and cleanout, but appears to have solid bones and plenty of potential. Being sold as-is. First time on the market in decades—don't miss this chance to restore a property with great possibilities.
Key facts
- Triple corner lot
- 0.71 acre lot
- Built 1904
Tags
Property features AI
Exterior
- Parking: No garage
- Utilities: Public water; Public sewer; 220V electrical service (including 220V in laundry)
- Home design: Single family residence; Residential property
- Construction: Metal siding; Foundation: block and concrete perimeter
- Exterior features: Composition roof; Lot about 0.71 acres (30,927.6 sq ft)
Interior
- Kitchen: Dishwasher
- Flooring: Carpet; Vinyl; Wood
- Bathrooms: 1 full bathroom; 1 half bathroom
- Heating & cooling: Natural gas heating; Central air conditioning
- Interior features: Drapes on windows; Full basement
- Laundry & utility: Electric water heater
Neighborhood map
What this means for you Summary
Snapshot
- This is a 4-bed/1.5-bath other listed at $110k.
Deal economics
- At list price, monthly cash flow is $462 ($6k/yr) — positive.
- The deal already cash-flows at list — no discount required.
- Meets the 1% rule at list price ($1k rent vs $110k).
Location & tenants
- Location reads 51/100 on livability (#886 in MO) — a working-class tenant base; expect higher turnover. Strengths: cost of living A+, housing A; Watch: schools F, crime F, amenities F.
- Tipton R-VI (town): math 21% / reading 37% proficiency, ranked #277 of 324 in MO (top 86%) — low school quality limits family demand, transient renter base, plan for 1-2y turnover.
- Market conditions: 2 active listings in the ZIP; 14 units permitted in Morgan County in 2024 (0 in 5+ unit buildings).
Forward outlook
- In year one you build about $4k of equity ($760 loan paydown + $3k appreciation (3.0% local appreciation)).
- Morgan County population projected at -22% by 2050 — secular population decline; favor cash flow + early exit over multi-decade hold.
- At projected returns (3.0% appreciation + 3.0% rent growth), your $31k cash investment doubles in ~4 years — after that, you're playing with house money.
- By year 8, paydown + projected appreciation supports a ~$30k cash-out refi (75% LTV) — recoverable capital for the next deal without selling this one.
Negotiation context
- Only 12 days on market — expect competitive offers; lowballing is unlikely to land.
Risks & watch-outs
- Watch-outs: built in 1904 — expect roof / HVAC / electrical / plumbing capex.
Questions for the listing agent
- Built in 1904 — when were the roof, HVAC, electrical panel, plumbing, and water heater last replaced?
- Is there a deadline driving the sale (1031 exchange, divorce, estate, relocation)? That informs how much negotiation room exists.
- Schools are F-rated, which usually means shorter tenancies and higher turnover. Who's the typical renter profile here, and what's been the actual vacancy rate?
- Crime grade is F in this area — have there been break-ins, vandalism, or insurance claims at this property in the last 3 years? What carrier currently insures it and at what premium?
- What's the average days-on-market for RENTAL listings here right now (not sales)? A rising rental-DOM trend means longer vacancies and softer asking-rent achievability than the comps imply.
- What's the recent tenant-quality profile in this submarket — average credit score on applications, eviction rate, late-payment / NSF rate, and stable-employment percentage? A property-management company in the area should have these aggregated.
- How much new for-sale + rental construction is in the pipeline within 1–3 miles? Heavy new supply typically softens prices + rents 12–24 months out; constrained supply supports both.
Investment metrics
- 1% rule
- 1.30% ✓
- Cap rate
- 11.33%
- Cash-on-cash
- 18.00%
- DSCR
- 1.80
- GRM
- 6.4
CMA / ARV
No comps found within radius.
Projected returns pro-forma
3.0% appreciation · 3.0% rent growth · sell at horizon
- IRR
- 24.4%
- Equity multiple
- 2.38×
- Total profit
- $42,643
- Equity at exit
- $49,460
- IRR
- 25.2%
- Equity multiple
- 4.59×
- Total profit
- $110,531
- Equity at exit
- $76,224
Cash invested: $30,800 (down + closing). Projections, not guarantees.
Landlord ↔ Tenant lean methodology
- Overall (STATE)
- 81 Strongly Landlord-Friendly
- State Missouri
- 81 Strongly Landlord-Friendly · R+10
- County
- — inherits STATE
- City
- — inherits STATE
ZIP-level market 65354
- Active inventory
- 2
- Price-to-rent
- 6.4×
Monthly cashflow live
- Estimated rent
- $1,429 medium interval (Pro) →
- Mortgage (P&I)
- −$577
- Tax from tax record
- −$44 /mo · $530/yr
- Insurance
- −$46
- HOA
- −$0
- Vacancy / Maint / Mgmt
- −$300
- Net cashflow
- $462
Break-even live
UW: 25.0% down · 7.5% · 30yr · 1.5% tax · 5.0% vac · 8.0% maint · 8.0% mgmt
Financing live
Cash to close
- Down payment
- $27,500
- Closing costs
- $3,300
- Reserves months
- —
- Total cash needed
- —
Loan-product check · same deal, 3 products live
Conventional
25% down · 7.5% · 30yr
- Down + closing
- —
- Monthly P&I
- —
- Monthly cashflow
- —
- DSCR
- —
- Eligible?
- —
Personal DTI + credit; lowest rate.
DSCR
20% down · 8.5% · 30yr
- Down + closing
- —
- Monthly P&I
- —
- Monthly cashflow
- —
- DSCR
- —
- Eligible?
- —
No personal income docs; deal must DSCR.
Hard money
10% down · 12.0% · 12mo
- Down + closing
- —
- Monthly P&I
- —
- Monthly cashflow
- —
- DSCR
- —
- Eligible?
- —
Short-term bridge; refi at stabilization.
Listing history 11 events
-
2026-06-18days on market $109,999 Active 12 DOM
-
2026-06-17days on market $109,999 Active 11 DOM
-
2026-06-16days on market $109,999 Active 10 DOM
-
2026-06-16remarks 395-char remark
-
2026-06-15days on market $109,999 Active 9 DOM
-
2026-06-13days on market $109,999 Active 7 DOM
-
2026-06-12days on market $109,999 Active 6 DOM
-
2026-06-09days on market $109,999 Active 3 DOM
-
2026-06-08days on market $109,999 Active 2 DOM
-
2026-06-07remarks 384-char remark
-
2026-06-07$109,999 Active 1 DOM
ⓘ Source: listings_history table (triggers on properties + properties_extension) + one-shot
backfill from property_details.listing_events for pre-trigger history.
Tax reassessment forecast MO · Resets to sale price
- Current annual tax
- $530 · $44/mo
- Projected year-2 tax
- $1,067 · $89/mo
- Expected delta
- +$537/yr (+$45/mo · 101.2%)
ⓘ Screening estimate from a state-policy table — verify with the county assessor before closing.
Climate risk First Street
- Flood 1/10 Low FEMA zone X (unshaded) · 0% chance over 30 yrs
- Wildfire 4/10 Moderate
- Heat 4/10 Moderate 7 d/yr ≥106°F today · 18 d/yr by 30 yrs out
- Wind 2/10 Low 0% chance of damaging wind over 30 yrs
- Air quality 2/10 Low 0 unhealthy d/yr today · 1 by 30 yrs out
Nearby sold comps map
Loading sold comps map…
Walkable amenities ~0.75 mi
Loading nearby amenities…
Taxation est. · year 1
- Rental income
- $17,148
- − Mortgage interest
- −$6,162
- − Property taxes
- −$530
- − Insurance
- −$550
- − Repairs & maintenance
- −$1,372
- − Management
- −$1,372
- − Depreciation
- −$3,200
- Taxable income
- $3,962
- Est. tax owed @ 24.0%
- −$951
- After-tax cash flow
- $4,594/yr
For passive investors: Depreciation is non-cash, so a rental often shows a tax loss while cash-flowing — sheltering income. Rental losses are passive: they offset passive income freely, and up to $25,000/yr can offset ordinary (W-2) income if you actively participate and your MAGI is under $100k (phasing out to $0 by $150k); unused losses carry forward. On sale, claimed depreciation is recaptured at up to 25%, and gains may owe capital-gains tax (a 1031 exchange can defer both). Figures are a year-1 estimate at your 24.0% rate — not tax advice; consult a CPA.
Schools (NCES district)
- District
- Tipton R-VI
- NCES district ID
- 2930330
- Math proficiency
- 21% ▼ -10.00%
- Reading proficiency
- 37% ▼ -4.00%
- Median HH income
- $44,395
- Composite
- 24.78/100
- National rank
- #7599
- State rank
- #277 of 324 in MO
Livability — Syracuse
- Score
- 51/100
- State rank
- #886
- US rank
- #25404
Category grades
Schools grade is shown separately in the Schools card above.
Census & demographics
- Census place
- Syracuse, MO
- Population (ZIP)
- 648
Population outlook (Morgan County) Hauer SSP2
- Today (2025)
- 18,779 people
- By 2030
- 17,891 · -4.7%
- By 2040
- 16,227 · -13.6%
- By 2050
- 14,735 · -21.5%
- By 2075
- 11,433 · -39.1%
- By 2100
- 7,717 · -58.9%
Race, ethnicity, and origin ACS 2023
- Neighborhood character
- Predominantly White (97%)
- Race & ethnicity
- White 97% Two or more races 3% Hispanic / Latino 2%
- Common ancestry
- Lithuanian 3% Scottish 1% Slovak 1%
- Foreign-born
- 1% · Canada
Political lean MEDSL · Morgan
- 2024 margin
- Solid R (+59.7) · D 19.7% · R 79.4%
- 2008→2024 swing
- -39.1pp toward R · 2008: -20.6pp · 2024: -59.7pp
- All cycles
- 2024: R+59.7 2020: R+58.2 2016: R+56.6 2012: R+34.1 2008: R+20.6
Not yet ingested
- Civics
- —
Market trends
- HPI YoY
- —
- Current HPI
- —
- Rent YoY
- —
- Metro
- —
- State GDP YoY
- ▲ 1.84%
- F500 in state
- 20
Industry mix (Fortune 500 HQ in MO)
| Industry | F500 HQs | Revenue |
|---|---|---|
| Healthcare | 1 | $163B |
|
||
| Insurance | 1 | $21B |
|
||
| Industrial Technology | 1 | $17B |
|
||
| Retail | 1 | $16B |
|
||
| Industrial Distribution | 1 | $10B |
|
||
| Utilities | 1 | $9B |
|
||
Price history
1 event — show timeline
- 2026-06-04 Listed $109,999 WCAR
Property tax history
+1.7%/yrLatest (2025): $530 · +19.6% YoY. Source: county tax records.
Cash-flow waterfall
monthlySold comps — $/sqft
last 12 mo · ≤1 miLoading sold comps…