655 Cardinal Dr · Pinch, WV
Flood risk 1/10 · Minimal
- FEMA flood zone
- X (unshaded)
- Chance of flooding over 30 yrs
- 0.0%
- Est. flood insurance / yr
- $473 – $860
Fire risk 5/10 · Moderate
- Est. fire insurance / yr
- $787 – $1,461
Heat risk 5/10 · Moderate
- Hot days now (above 100°F)
- 7 days/yr
- Hot days in 30 yrs
- 20 days/yr
Wind risk 2/10 · Minimal
- Chance of severe wind over 30 yrs
- 1.0%
Air-quality risk 1/10 · Minimal
- Unhealthy air days now
- 0 days/yr
- Unhealthy air days in 30 yrs
- 0 days/yr
Risk factors via First Street. Map © Google.
Why this score? — see what drove the C- grade
The composite is a weighted blend of 9 inputs, each scored 0–100. Each bar is that input's sub-score; the figure is the points it added to the 100-point composite (weight × sub-score).
- Cash flow +23.2/30.0
- DSCR +7.5/10.0
- ARV discount +7.5/15.0
- 1% rule +5.2/10.0
- Livability +3.4/5.0
- Schools +2.9/10.0
- Rent growth +2.5/5.0
- Condition / age +2.5/5.0
- Appreciation +0.0/10.0
$120,000
🖨 Deal sheet 📄 Offer letter ✓ Due diligence
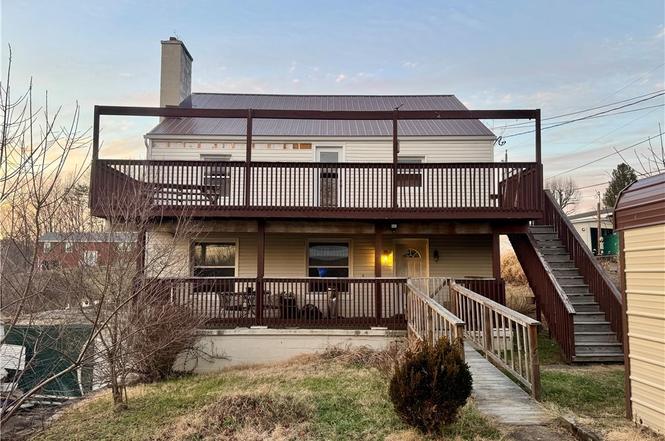
Listing remarks
Opportunity knocks! This 3 BR, 1.5 BA home offers a full finished basement and plenty of potential for the right buyer. Priced competitively, this property is great for anyone looking to add their own updates and build instant equity. Located in a great location, close to shopping, schools and major routes, this home offers both convenience and opportunity. This home could be a fantastic long term investment or a place to truly make your own.
Key facts
- Close to schools
- Great location
- Close to shopping
Tags
Neighborhood map
What this means for you Summary
Snapshot
- This is a 3-bed/1.5-bath single-family listed at $120k.
Deal economics
- At list price, monthly cash flow is $218 ($3k/yr) — positive.
- The deal already cash-flows at list — no discount required.
- Meets the 1% rule at list price ($1k rent vs $120k).
Location & tenants
- Location reads 67/100 on livability (#89 in WV) — a middle-class / working-renter tenant base. Strengths: crime A+, cost of living A+, housing A+; Watch: amenities F, commute F, health & safety F.
- Kanawha County Schools (suburban): math 29% / reading 40% proficiency, ranked #17 of 55 in WV (top 31%) — families likely to look elsewhere, expect single-tenant / working-renter base with shorter leases.
- Zoned schools: Pinch Elementary School (math 42% / reading 47%, grade F, #71 of 377 statewide, top 22%, 321 students, 0% FRL); Elkview Middle School (math 26% / reading 42%, grade F, #36 of 109 statewide, top 35%, 613 students, 0% FRL); Herbert Hoover High School (math 37% / reading 62%, grade D, #7 of 110 statewide, top 6%, 789 students, 0% FRL) — zoned schools average 0% FRL vs 46% district-wide (46 pts lower); this property's tenant base skews higher-income than the district average.
- Market conditions: 38 active listings in the ZIP; 103 units permitted in Kanawha County in 2024 (0 in 5+ unit buildings).
Forward outlook
- Local home prices are declining (-3.0%/yr); year-one equity from $830 of loan paydown is wiped out by about $4k of value loss. Plan a longer hold.
- Kanawha County population projected at -17% by 2050 — secular population decline; favor cash flow + early exit over multi-decade hold.
Negotiation context
- Only 13 days on market — expect competitive offers; lowballing is unlikely to land.
Risks & watch-outs
- Watch-outs: built in 1945 — expect roof / HVAC / electrical / plumbing capex.
- Climate carrying-cost: moderate wildfire risk; extreme-heat days projected 7→20/yr by 2055 (HVAC capex compounding) — expect insurance premiums to compound above CPI over the hold.
Questions for the listing agent
- Built in 1945 — when were the roof, HVAC, electrical panel, plumbing, and water heater last replaced?
- Is there a deadline driving the sale (1031 exchange, divorce, estate, relocation)? That informs how much negotiation room exists.
- Schools are F-rated, which usually means shorter tenancies and higher turnover. Who's the typical renter profile here, and what's been the actual vacancy rate?
- What's the average days-on-market for RENTAL listings here right now (not sales)? A rising rental-DOM trend means longer vacancies and softer asking-rent achievability than the comps imply.
- What's the recent tenant-quality profile in this submarket — average credit score on applications, eviction rate, late-payment / NSF rate, and stable-employment percentage? A property-management company in the area should have these aggregated.
- How much new for-sale + rental construction is in the pipeline within 1–3 miles? Heavy new supply typically softens prices + rents 12–24 months out; constrained supply supports both.
Investment metrics
- 1% rule
- 1.02% ✓
- Cap rate
- 8.47%
- Cash-on-cash
- 7.77%
- DSCR
- 1.35
- GRM
- 8.1
CMA / ARV
- ARV (on-the-fly)
- $276,480
- Comps found
- 6
Show comp detail 6 sales within ~0.75 mi
| Address | Dist | Beds/Ba | Sqft | Sold | Price | $/sf | Match |
|---|---|---|---|---|---|---|---|
| 118 Pinewood Road Rd | 0.44mi | 3/2.5 | 1,958 (-4%) | 17mo | $350,000 | $179 | 54 |
| 1008 Ridgemont Dr | 0.60mi | 4/2.5 (+1) | 2,108 (+3%) | 14mo | $320,000 | $152 | 46 |
| 115 Pinewood Rd | 0.38mi | 4/2.0 (+1) | 2,300 (+12%) | 14mo | $239,500 | $104 | 43 |
| 252 S Pinch Rd | 0.41mi | 3/2.0 | 1,813 (-12%) | 24mo | $245,000 | $135 | 40 |
| 918 Reunion Rd | 0.72mi | 4/2.5 (+1) | 2,162 (+6%) | 11mo | $280,000 | $130 | 39 |
| 122 Morningside Dr | 0.73mi | 3/3.0 | 2,205 (+8%) | 14mo | $262,500 | $119 | 36 |
Match score weights: distance 35% · size 25% · config 20% · recency 20%. Top-matched comps best support the ARV.
Projected returns pro-forma
-3.0% appreciation · 3.0% rent growth · sell at horizon
- IRR
- -4.5%
- Equity multiple
- 0.83×
- Total profit
- $-5,611
- Equity at exit
- $17,892
- IRR
- 5.2%
- Equity multiple
- 1.38×
- Total profit
- $12,851
- Equity at exit
- $10,375
Cash invested: $33,600 (down + closing). Projections, not guarantees.
Landlord ↔ Tenant lean methodology
- Overall (STATE)
- 83 Strongly Landlord-Friendly
- State West Virginia
- 83 Strongly Landlord-Friendly · R+22
- County
- — inherits STATE
- City
- — inherits STATE
ZIP-level market 25071
- Home prices YoY
- -27.1%
- Active inventory
- 38
- Price-to-rent
- 8.1×
Monthly cashflow live
- Estimated rent
- $1,229 medium interval (Pro) →
- Mortgage (P&I)
- −$629
- Tax from tax record
- −$74 /mo · $887/yr
- Insurance
- −$50
- HOA
- −$0
- Vacancy / Maint / Mgmt
- −$258
- Net cashflow
- $218
Break-even live
UW: 25.0% down · 7.5% · 30yr · 1.5% tax · 5.0% vac · 8.0% maint · 8.0% mgmt
Financing live
Cash to close
- Down payment
- $30,000
- Closing costs
- $3,600
- Reserves months
- —
- Total cash needed
- —
Loan-product check · same deal, 3 products live
Conventional
25% down · 7.5% · 30yr
- Down + closing
- —
- Monthly P&I
- —
- Monthly cashflow
- —
- DSCR
- —
- Eligible?
- —
Personal DTI + credit; lowest rate.
DSCR
20% down · 8.5% · 30yr
- Down + closing
- —
- Monthly P&I
- —
- Monthly cashflow
- —
- DSCR
- —
- Eligible?
- —
No personal income docs; deal must DSCR.
Hard money
10% down · 12.0% · 12mo
- Down + closing
- —
- Monthly P&I
- —
- Monthly cashflow
- —
- DSCR
- —
- Eligible?
- —
Short-term bridge; refi at stabilization.
Listing history 9 events
-
2026-06-19days on market $120,000 Active 13 DOM
-
2026-06-18days on market $120,000 Active 12 DOM
-
2026-06-17days on market $120,000 Active 11 DOM
-
2026-06-16days on market $120,000 Active 10 DOM
-
2026-06-15days on market $120,000 Active 9 DOM
-
2026-06-14days on market $120,000 Active 7 DOM
-
2026-06-12pricestatusdays on market $120,000 Active 6 DOM
-
2026-02-03status Pending
-
2026-01-30$125,000 Active
ⓘ Source: listings_history table (triggers on properties + properties_extension) + one-shot
backfill from property_details.listing_events for pre-trigger history.
Tax reassessment forecast WV · Resets to sale price
- Current annual tax
- $887 · $74/mo
- Projected year-2 tax
- $887 · $74/mo
- Expected delta
- $0/yr ($0/mo · 0.0%)
ⓘ Screening estimate from a state-policy table — verify with the county assessor before closing.
Climate risk First Street
- Flood 1/10 Low FEMA zone X (unshaded) · 0% chance over 30 yrs
- Wildfire 5/10 Major
- Heat 5/10 Major 7 d/yr ≥100°F today · 20 d/yr by 30 yrs out
- Wind 2/10 Low 100% chance of damaging wind over 30 yrs
- Air quality 1/10 Low 0 unhealthy d/yr today · 0 by 30 yrs out
Nearby sold comps map
Loading sold comps map…
Walkable amenities ~0.75 mi
Loading nearby amenities…
Taxation est. · year 1
- Rental income
- $14,748
- − Mortgage interest
- −$6,722
- − Property taxes
- −$887
- − Insurance
- −$600
- − Repairs & maintenance
- −$1,180
- − Management
- −$1,180
- − Depreciation
- −$3,491
- Taxable income
- $688
- Est. tax owed @ 24.0%
- −$165
- After-tax cash flow
- $2,447/yr
For passive investors: Depreciation is non-cash, so a rental often shows a tax loss while cash-flowing — sheltering income. Rental losses are passive: they offset passive income freely, and up to $25,000/yr can offset ordinary (W-2) income if you actively participate and your MAGI is under $100k (phasing out to $0 by $150k); unused losses carry forward. On sale, claimed depreciation is recaptured at up to 25%, and gains may owe capital-gains tax (a 1031 exchange can defer both). Figures are a year-1 estimate at your 24.0% rate — not tax advice; consult a CPA.
Schools (NCES district)
- District
- Kanawha County Schools
- NCES district ID
- 5400600
- Math proficiency
- 29% ▼ -13.00%
- Reading proficiency
- 40% ▼ -7.00%
- Median HH income
- $44,329
- Composite
- 29.35/100
- National rank
- #6540
- State rank
- #17 of 55 in WV
Livability — Pinch
- Score
- 67/100
- State rank
- #89
- US rank
- #10402
Category grades
Schools grade is shown separately in the Schools card above.
Census & demographics
- Census place
- Pinch, WV
- City population
- 48
- Population (ZIP)
- 11,243
Population outlook (Kanawha County) Hauer SSP2
- Today (2025)
- 178,946 people
- By 2030
- 172,906 · -3.4%
- By 2040
- 159,874 · -10.7%
- By 2050
- 148,148 · -17.2%
- By 2075
- 123,257 · -31.1%
- By 2100
- 96,454 · -46.1%
Race, ethnicity, and origin ACS 2023
- Neighborhood character
- Predominantly White (96%)
- Race & ethnicity
- White 96% Two or more races 3%
- Common ancestry
- Serbian 3% Slovak 2% Romanian 2%
- Foreign-born
- 1%
- Languages at home
- 98% English-only · German/W. Germanic 1%
Political lean MEDSL · Kanawha
- 2024 margin
- R (+17.4) · D 40.2% · R 57.6% · Other 2.2%
- 2008→2024 swing
- -17.0pp toward R · 2008: -0.4pp · 2024: -17.4pp
- All cycles
- 2024: R+17.4 2020: R+14.7 2016: R+20.6 2012: R+11.9 2008: R+0.4
Not yet ingested
- Civics
- —
Market trends
- HPI YoY
- ▼ -69.64%
- Current HPI
- 187.2213
- Rent YoY
- —
- Metro
- —
- State GDP YoY
- —
- F500 in state
- 0
Price history
2 events — show timeline
- 2026-02-03 Pending — KVBOR
- 2026-01-30 Listed $125,000 KVBOR
Property tax history
+3.8%/yrLatest (2025): $887 · -2.4% YoY. Source: county tax records.
Cash-flow waterfall
monthlySold comps — $/sqft
last 12 mo · ≤1 miLoading sold comps…