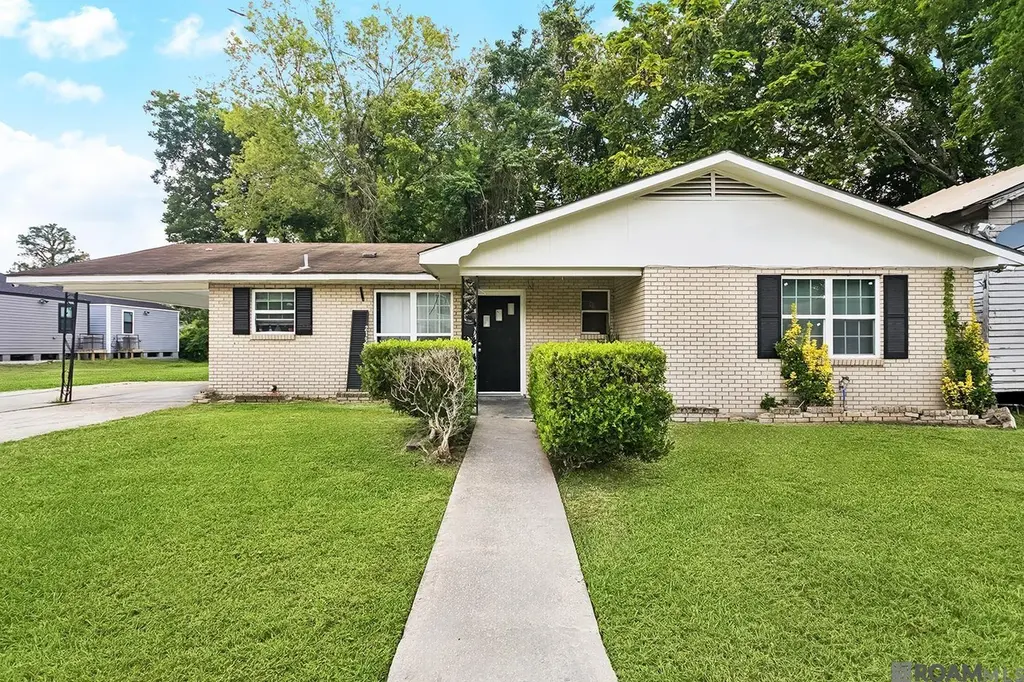
2138 Minnesota St · Baton Rouge, LA
Flood risk 4/10 · Minor
- FEMA flood zone
- AE
- Chance of flooding over 30 yrs
- 0.24%
- Est. flood insurance / yr
- $1,737 – $8,500
Fire risk 1/10 · Minimal
- Est. fire insurance / yr
- $1,269 – $2,357
Heat risk 8/10 · Major
- Hot days now (above 108°F)
- 7 days/yr
- Hot days in 30 yrs
- 20 days/yr
Wind risk 9/10 · Severe
- Chance of severe wind over 30 yrs
- 99.0%
Air-quality risk 2/10 · Minimal
- Unhealthy air days now
- 1 days/yr
- Unhealthy air days in 30 yrs
- 1 days/yr
Risk factors via First Street. Map © Google.
Why this score? — see what drove the C+ grade
The composite is a weighted blend of 9 inputs, each scored 0–100. Each bar is that input's sub-score; the figure is the points it added to the 100-point composite (weight × sub-score).
- Cash flow +30.0/30.0
- 1% rule +10.0/10.0
- DSCR +10.0/10.0
- Rent growth +4.1/5.0
- Livability +3.7/5.0
- Condition / age +2.5/5.0
- Schools +2.4/10.0
- ARV discount +0.0/15.0
- Appreciation +0.0/10.0
$89,900
🖨 Deal sheet 📄 Offer letter ✓ Due diligence
Listing remarks MLS
Bank owned property: Come and see this beautifully updated home featuring no carpet, granite countertops, and more! Schedule your private showing today. Note: Some photos have been virtually staged and digitally enhanced, including the addition or removal of furniture, windows, and/or doors, to help visualize the property's potential. Images may not reflect the property's current condition.
Key facts
- 3,484 sq ft lot
- Built 1950
- Listed 115 days
Neighborhood map
What this means for you Summary
Snapshot
- This is a 3-bed/2.0-bath single-family listed at $90k.
Deal economics
- At list price, monthly cash flow is $115 ($1k/yr) — positive.
- The deal already cash-flows at list — no discount required.
- Meets the 1% rule at list price ($1k rent vs $90k).
- Recommended offer: $82k (9.0% below list) — sets the bar for market timing.
- Cap rate 13.5% vs local median 4.3% in Baton Rouge — top-decile yield for the area; either an underpriced asset or a hidden risk that comps aren't pricing in. Stress-test before assuming the spread holds.
Location & tenants
- Location reads 74/100 on livability (#24 in LA, #4,535 nationally) — a middle-class / working-renter tenant base. Strengths: commute A+, cost of living A+, health & safety A+; Watch: amenities D, crime F, employment D-.
- East Baton Rouge Parish (urban): math 22% / reading 34% proficiency, ranked #47 of 98 in LA (top 48%) — low school quality limits family demand, transient renter base, plan for 1-2y turnover; 77% free/reduced lunch — lower-income household profile, screen leases tightly.
- Market conditions: Rents rising fast (+6.6%/yr); 188 active listings in the ZIP; 21 comparable units currently listed for rent nearby; rentals at typical pace (median 24d on market — plan ~3-4 weeks tenant-placement turnaround); lower-income renter base — watch delinquency; 2,252 units permitted in East Baton Rouge Parish in 2024 (440 in 5+ unit buildings).
- At $1,398/mo this rent would consume 49% of the median local household income ($34k/yr) (locally 1831% of renters already pay >50% of income on rent) — very limited rent-growth headroom before tenants either downsize or default.
Forward outlook
- Local home prices are declining (-3.0%/yr); year-one equity from $622 of loan paydown is wiped out by about $3k of value loss. Plan a longer hold.
- East Baton Rouge County population projected at +4% by 2050 — modest demand growth; plan on rents tracking national, not racing it.
- At projected returns (-3.0% appreciation + 6.6% rent growth), your $25k cash investment doubles in ~9 years — after that, you're playing with house money.
Negotiation context
- It's been on market 115 days — a 9% lower offer ($82k) is reasonable based on typical stale-listing flexibility.
- 12 sale attempts since 2y ago; this cycle's ask has dropped $60k (40%) from the opening price — seller is motivated, your offer sets the floor, not the list.
- Current owner paid $50k; list at $90k implies a 80% gain — meaningful room to come down on a strong offer.
Risks & watch-outs
- Watch-outs: flood insurance adds $427/mo; built in 1950 — expect roof / HVAC / electrical / plumbing capex.
- Climate carrying-cost: in FEMA flood zone AE (mandatory federal flood insurance); severe wind risk, 99% chance of damaging wind over 30y; extreme-heat days projected 7→20/yr by 2055 (HVAC capex compounding) — expect insurance premiums to compound above CPI over the hold.
Questions for the listing agent
- It's been on market 115 days. Have you received any prior offers? Is the seller open to a 9% concession, seller financing, or rate buy-down credit?
- Built in 1950 — when were the roof, HVAC, electrical panel, plumbing, and water heater last replaced?
- What's the actual annual flood-insurance premium (NFIP or private), and is the property in a SFHA with mandatory coverage?
- Why hasn't it sold? Are there any deal-killer items the seller is aware of (foundation, flood, title, zoning, code violations)?
- Is there a deadline driving the sale (1031 exchange, divorce, estate, relocation)? That informs how much negotiation room exists.
- Crime grade is F in this area — have there been break-ins, vandalism, or insurance claims at this property in the last 3 years? What carrier currently insures it and at what premium?
- What's the average days-on-market for RENTAL listings here right now (not sales)? A rising rental-DOM trend means longer vacancies and softer asking-rent achievability than the comps imply.
- What's the recent tenant-quality profile in this submarket — average credit score on applications, eviction rate, late-payment / NSF rate, and stable-employment percentage? A property-management company in the area should have these aggregated.
- How much new for-sale + rental construction is in the pipeline within 1–3 miles? Heavy new supply typically softens prices + rents 12–24 months out; constrained supply supports both.
Investment metrics
- 1% rule
- 1.55% ✓
- Cap rate
- 13.52%
- Cash-on-cash
- 25.82%
- DSCR
- 2.15
- GRM
- 5.4
CMA / ARV
- ARV (median comp)
- $74,235
- List price
- $89,900
- Delta
- 21.10%
- Verdict
- OVERPRICED
- Comps
- 20 within 1.0 mi
Show comp detail 12 sales within ~0.75 mi
| Address | Dist | Beds/Ba | Sqft | Sold | Price | $/sf | Match |
|---|---|---|---|---|---|---|---|
| 2163 Colorado St | 0.23mi | 3/2.5 | 1,413 (+4%) | 9mo | $175,000 | $124 | 73 |
| 1940 Nebraska St | 0.21mi | 3/2.0 | 1,300 (-4%) | 14mo | $34,900 | $27 | 71 |
| 647 Cotton St | 0.53mi | 3/2.0 | 1,350 (-1%) | 9mo | $125,000 | $93 | 67 |
| 2002 Thomas H Delpit Dr | 0.35mi | 3/1.0 | 1,313 (-4%) | 9mo | $98,000 | $75 | 66 |
| 806 Violet St | 0.51mi | 3/2.0 | 1,419 (+4%) | 17mo | $169,900 | $120 | 55 |
| 1507 Lorri Burgess Ave | 0.73mi | 3/2.0 | 1,240 (-9%) | 5mo | $28,560 | $23 | 47 |
| 1555 Utah St | 0.54mi | 3/2.0 | 1,468 (+8%) | 20mo | $60,000 | $41 | 45 |
| 1310 Aster St | 0.72mi | 3/1.0 | 1,244 (-8%) | 6mo | $139,900 | $112 | 43 |
| 857 Geranium St | 0.64mi | 3/1.0 | 1,300 (-4%) | 19mo | $135,000 | $104 | 43 |
| 850 Geranium St | 0.61mi | 3/1.0 | 1,210 (-11%) | 14mo | $152,000 | $126 | 37 |
| 964 Terrace Ave | 0.64mi | 3/2.0 | 1,189 (-13%) | 15mo | $215,000 | $181 | 37 |
| 1950 Georgia St | 0.45mi | 2/1.0 (-1) | 1,200 (-12%) | 16mo | $25,000 | $21 | 36 |
Match score weights: distance 35% · size 25% · config 20% · recency 20%. Top-matched comps best support the ARV.
Projected returns pro-forma
-3.0% appreciation · 6.59% rent growth · sell at horizon
- IRR
- -1.7%
- Equity multiple
- 0.93×
- Total profit
- $-1,756
- Equity at exit
- $13,404
- IRR
- 12.9%
- Equity multiple
- 2.27×
- Total profit
- $32,032
- Equity at exit
- $7,773
Cash invested: $25,172 (down + closing). Projections, not guarantees.
Landlord ↔ Tenant lean methodology
- Overall (STATE)
- 90 Strongly Landlord-Friendly
- State Louisiana
- 90 Strongly Landlord-Friendly · R+12
- County
- — inherits STATE
- City
- — inherits STATE
ZIP-level market 70802
- Rents YoY
- 6.6%
- Active inventory
- 188
- Price-to-rent
- 5.4×
Monthly cashflow live
- Estimated rent
- $1,398 high interval (Pro) →
- Mortgage (P&I)
- −$471
- Tax from tax record
- −$54 /mo · $646/yr
- Insurance
- −$37
- Flood insurance flood zone
- −$427 /mo · $5,118/yr
- HOA
- −$0
- Vacancy / Maint / Mgmt
- −$294
- Net cashflow
- $115
Break-even live
UW: 25.0% down · 7.5% · 30yr · 1.5% tax · 5.0% vac · 8.0% maint · 8.0% mgmt
Financing live
Cash to close
- Down payment
- $22,475
- Closing costs
- $2,697
- Reserves months
- —
- Total cash needed
- —
Loan-product check · same deal, 3 products live
Conventional
25% down · 7.5% · 30yr
- Down + closing
- —
- Monthly P&I
- —
- Monthly cashflow
- —
- DSCR
- —
- Eligible?
- —
Personal DTI + credit; lowest rate.
DSCR
20% down · 8.5% · 30yr
- Down + closing
- —
- Monthly P&I
- —
- Monthly cashflow
- —
- DSCR
- —
- Eligible?
- —
No personal income docs; deal must DSCR.
Hard money
10% down · 12.0% · 12mo
- Down + closing
- —
- Monthly P&I
- —
- Monthly cashflow
- —
- DSCR
- —
- Eligible?
- —
Short-term bridge; refi at stabilization.
Rent comps 21 comps
| Address | Beds | Baths | Sqft | Rent | $/sqft | DOM | Units | Dist |
|---|---|---|---|---|---|---|---|---|
| 1917 Minnesota St Unit A Baton Rouge, LA | 2.0 | 2.0 | 917 | $1,350 | $1.47 | 23d | 1 | 0.15mi |
| 1917 Minnesota St Unit A Baton Rouge, LA | 2.0 | 2.0 | 917 | $1,350 | $1.47 | 43d | 1 | 0.15mi |
| 634 W Grant St Baton Rouge, LA | 3.0 | 2.0 | 1467 | $1,850 | $1.26 | 43d | 1 | 0.26mi |
| 470 E McKinley St Baton Rouge, LA | 3.0 | 1.0 | 1200 | $1,185 | $0.99 | 23d | 1 | 0.41mi |
| 101 Baton Rouge, LA | 1.0–2.0 | 1.0–2.0 | 803 | $1,696 | $2.11 | 14d | 28 | 0.57mi |
| 1104 E Harrison St Unit A Baton Rouge, LA | 2.0 | 2.0 | 1100 | $975 | $0.89 | 43d | 1 | 0.57mi |
| 3101 Highland Rd Baton Rouge, LA | 2.0 | 1.0 | 955 | $1,038 | $1.09 | 14d | 2 | 0.58mi |
| 2273 Carolina St Baton Rouge, LA | 3.0 | 2.0 | 1244 | $1,050 | $0.84 | 43d | 1 | 0.70mi |
| 1133 Maximillian St Baton Rouge, LA | 3.0 | 2.0 | 1240 | $1,100 | $0.89 | 43d | 1 | 0.73mi |
| 1538 Fig St Baton Rouge, LA | 3.0 | 1.0 | 1100 | $1,100 | $1.00 | 23d | 1 | 0.77mi |
| 417 E State St Baton Rouge, LA | 3.0 | 1.0–2.0 | 849 | $1,350 | $1.59 | 14d | 26 | 0.77mi |
| 408 E State St Unit B Baton Rouge, LA | 2.0 | 2.0 | 1258 | $1,100 | $0.87 | 43d | 1 | 0.79mi |
| 1430 S 17th St Baton Rouge, LA | 3.0 | 2.0 | 1136 | $3,499 | $3.08 | 43d | 1 | 0.91mi |
| 1327 S 17th St Baton Rouge, LA | 2.0 | 1.0 | 955 | $950 | $0.99 | 23d | 1 | 0.96mi |
| 1702 Terrace Ave Baton Rouge, LA | 4.0 | 2.0 | 1117 | $1,400 | $1.25 | 23d | 1 | 0.96mi |
| 636 Napoleon St Baton Rouge, LA | 2.0 | 1.0 | 1065 | $1,650 | $1.55 | 14d | 1 | 1.06mi |
| 648 Penalver St Unit 2 Baton Rouge, LA | 2.0 | 1.0 | 1000 | $1,200 | $1.20 | 14d | 1 | 1.06mi |
| 802 S 18th St Baton Rouge, LA | 3.0 | 2.0 | 1293 | $1,690 | $1.31 | 23d | 1 | 1.21mi |
| 718 Park Blvd Unit 1 Baton Rouge, LA | 2.0 | 1.0 | 1189 | $1,500 | $1.26 | 23d | 1 | 1.30mi |
| 710 Park Blvd #6 Baton Rouge, LA | 2.0 | 1.0 | 1111 | $1,800 | $1.62 | 14d | 1 | 1.31mi |
| 2539 Fiero St Baton Rouge, LA | 2.0 | 2.0 | 1752 | $2,600 | $1.48 | 43d | 1 | 1.38mi |
Listing history 37 events
-
2026-06-18days on market $89,900 Active 115 DOM
-
2026-06-17days on market $89,900 Active 114 DOM
-
2026-06-16days on market $89,900 Active 113 DOM
-
2026-06-15days on market $89,900 Active 112 DOM
-
2026-06-14days on market $89,900 Active 110 DOM
-
2026-06-10days on market $89,900 Active 107 DOM
-
2026-06-09days on market $89,900 Active 106 DOM
-
2026-06-08days on market $89,900 Active 105 DOM
-
2026-06-07days on market $89,900 Active 104 DOM
-
2026-06-05pricedays on market $89,900 Active 101 DOM
-
2026-06-03days on market $119,900 Active 100 DOM
-
2026-06-02days on market $119,900 Active 99 DOM
-
2026-06-01days on market $119,900 Active 98 DOM
-
2026-05-31days on market $119,900 Active 97 DOM
-
2026-05-31days on market $119,900 Active 96 DOM
-
2026-05-15status Active 393-char remark
Show marketing remark (405 chars)
Bank owned property: Come and see this beautifully updated home featuring no carpet, granite countertops, and more! Schedule your private showing today. Note: Some photos have been virtually staged and digitally enhanced, including the addition or removal of furniture, windows, and/or doors, to help visualize the property’s potential. Images may not reflect the property’s current condition.
-
2026-05-15status Active 405-char remark
Show marketing remark (405 chars)
Bank owned property: Come and see this beautifully updated home featuring no carpet, granite countertops, and more! Schedule your private showing today. Note: Some photos have been virtually staged and digitally enhanced, including the addition or removal of furniture, windows, and/or doors, to help visualize the property’s potential. Images may not reflect the property’s current condition.
-
2026-05-13status Active
-
2026-05-13status Active
-
2026-04-21status Pending 393-char remark
Show marketing remark (405 chars)
Bank owned property: Come and see this beautifully updated home featuring no carpet, granite countertops, and more! Schedule your private showing today. Note: Some photos have been virtually staged and digitally enhanced, including the addition or removal of furniture, windows, and/or doors, to help visualize the property’s potential. Images may not reflect the property’s current condition.
-
2026-04-21status Pending 405-char remark
Show marketing remark (405 chars)
Bank owned property: Come and see this beautifully updated home featuring no carpet, granite countertops, and more! Schedule your private showing today. Note: Some photos have been virtually staged and digitally enhanced, including the addition or removal of furniture, windows, and/or doors, to help visualize the property’s potential. Images may not reflect the property’s current condition.
-
2026-04-21status Pending
Show marketing remark (405 chars)
Bank owned property: Come and see this beautifully updated home featuring no carpet, granite countertops, and more! Schedule your private showing today. Note: Some photos have been virtually staged and digitally enhanced, including the addition or removal of furniture, windows, and/or doors, to help visualize the property’s potential. Images may not reflect the property’s current condition.
-
2026-04-21historical Active Under Contract
Show marketing remark (405 chars)
Bank owned property: Come and see this beautifully updated home featuring no carpet, granite countertops, and more! Schedule your private showing today. Note: Some photos have been virtually staged and digitally enhanced, including the addition or removal of furniture, windows, and/or doors, to help visualize the property’s potential. Images may not reflect the property’s current condition.
-
2026-03-05price $119,900
-
2026-03-05price $119,900
-
2026-03-04price $119,900 393-char remark
Show marketing remark (405 chars)
Bank owned property: Come and see this beautifully updated home featuring no carpet, granite countertops, and more! Schedule your private showing today. Note: Some photos have been virtually staged and digitally enhanced, including the addition or removal of furniture, windows, and/or doors, to help visualize the property’s potential. Images may not reflect the property’s current condition.
-
2026-03-04price $119,900 405-char remark
Show marketing remark (405 chars)
Bank owned property: Come and see this beautifully updated home featuring no carpet, granite countertops, and more! Schedule your private showing today. Note: Some photos have been virtually staged and digitally enhanced, including the addition or removal of furniture, windows, and/or doors, to help visualize the property’s potential. Images may not reflect the property’s current condition.
-
2026-01-30$150,000 Active 393-char remark
Show marketing remark (405 chars)
Bank owned property: Come and see this beautifully updated home featuring no carpet, granite countertops, and more! Schedule your private showing today. Note: Some photos have been virtually staged and digitally enhanced, including the addition or removal of furniture, windows, and/or doors, to help visualize the property’s potential. Images may not reflect the property’s current condition.
-
2026-01-30$150,000 Active 405-char remark
Show marketing remark (405 chars)
Bank owned property: Come and see this beautifully updated home featuring no carpet, granite countertops, and more! Schedule your private showing today. Note: Some photos have been virtually staged and digitally enhanced, including the addition or removal of furniture, windows, and/or doors, to help visualize the property’s potential. Images may not reflect the property’s current condition.
-
2026-01-23$150,000 Active
-
2026-01-23$150,000 Active
-
2025-08-11$150,000 Active
-
2025-08-11$150,000 Active
-
2024-12-12$150,000
-
2024-09-21price $150,000
-
2024-06-27$150,000 Active
-
2021-10-04soldstatus $50,000
ⓘ Source: listings_history table (triggers on properties + properties_extension) + one-shot
backfill from property_details.listing_events for pre-trigger history.
Tax reassessment forecast LA · Resets to sale price
- Current annual tax
- $646 · $54/mo
- Projected year-2 tax
- $646 · $54/mo
- Expected delta
- $0/yr ($0/mo · 0.0%)
ⓘ Screening estimate from a state-policy table — verify with the county assessor before closing.
Climate risk First Street
- Flood 4/10 Moderate FEMA zone AE · 24% chance over 30 yrs
- Wildfire 1/10 Low
- Heat 8/10 Severe 7 d/yr ≥108°F today · 20 d/yr by 30 yrs out
- Wind 9/10 Extreme 99% chance of damaging wind over 30 yrs
- Air quality 2/10 Low 1 unhealthy d/yr today · 1 by 30 yrs out
Nearby sold comps map
Loading sold comps map…
Walkable amenities ~0.75 mi
Loading nearby amenities…
Taxation est. · year 1
- Rental income
- $16,775
- − Mortgage interest
- −$5,036
- − Property taxes
- −$646
- − Insurance
- −$5,568
- − Repairs & maintenance
- −$1,342
- − Management
- −$1,342
- − Depreciation
- −$2,615
- Taxable income
- $227
- Est. tax owed @ 24.0%
- −$54
- After-tax cash flow
- $1,327/yr
For passive investors: Depreciation is non-cash, so a rental often shows a tax loss while cash-flowing — sheltering income. Rental losses are passive: they offset passive income freely, and up to $25,000/yr can offset ordinary (W-2) income if you actively participate and your MAGI is under $100k (phasing out to $0 by $150k); unused losses carry forward. On sale, claimed depreciation is recaptured at up to 25%, and gains may owe capital-gains tax (a 1031 exchange can defer both). Figures are a year-1 estimate at your 24.0% rate — not tax advice; consult a CPA.
Schools (NCES district)
- District
- East Baton Rouge Parish
- NCES district ID
- 2200540
- Math proficiency
- 22% ▼ -36.00%
- Reading proficiency
- 34% ▼ -31.00%
- Median HH income
- $46,263
- Composite
- 24.14/100
- National rank
- #7745
- State rank
- #47 of 98 in LA
Livability — Baton Rouge
- Score
- 74/100
- State rank
- #24
- US rank
- #4535
Category grades
Schools grade is shown separately in the Schools card above.
Census & demographics
- Census place
- Baton Rouge, LA
- County
- East Baton Rouge Parish · 399,686 people
- City population
- 351,868
- Metro
- Baton Rouge, LA
- Population (ZIP)
- 25,118
- Household income
- $34,458
- Rent vs Own
- Severe rent burden
- 1831.0
Population outlook (East Baton Rouge County) Hauer SSP2
- Today (2025)
- 464,810 people
- By 2030
- 472,137 · +1.6%
- By 2040
- 480,243 · +3.3%
- By 2050
- 484,422 · +4.2%
- By 2075
- 492,069 · +5.9%
- By 2100
- 476,347 · +2.5%
Race, ethnicity, and origin ACS 2023
- Neighborhood character
- Predominantly Black (69%)
- Race & ethnicity
- Black 69% White 20% Two or more races 5% Hispanic / Latino 5% Asian 3%
- Common ancestry
- Lithuanian 2% Italian 1% Iranian 0%
- Foreign-born
- 6% · Canada, Vietnam
- Languages at home
- 91% English-only · Spanish 3% Tagalog/Filipino 1% Other Indo-European 1%
Political lean MEDSL · East Baton Rouge
- 2024 margin
- D (+11.1) · D 54.5% · R 43.4% · Other 2.1%
- 2008→2024 swing
- +8.9pp toward D · 2008: 2.2pp · 2024: 11.1pp
- All cycles
- 2024: D+11.1 2020: D+13.1 2016: D+9.2 2012: D+5.2 2008: D+2.2
Not yet ingested
- Civics
- —
Market trends
- HPI YoY
- ▼ -137.02%
- Current HPI
- 47.7285
- Rent YoY
- ▲ 6.59%
- Metro
- Baton Rouge, LA
- State GDP YoY
- ▲ 3.29%
- F500 in state
- 10
Industry mix (Fortune 500 HQ in LA)
| Industry | F500 HQs | Revenue |
|---|---|---|
| Telecommunications | 2 | $23B |
|
||
| Utilities | 1 | $12B |
|
||
| Wholesale / Distribution | 1 | $5B |
|
||
| Advertising | 1 | $2B |
|
||
Price history
+139.8% since first listed22 events — show timeline
- 2026-05-15 Relisted — AcadianaMLS
- 2026-05-15 Relisted — GBRMLS
- 2026-05-13 Relisted — AcadianaMLS
- 2026-05-13 Relisted — GSREIN
- 2026-04-21 Pending — AcadianaMLS
- 2026-04-21 Pending — GBRMLS
- 2026-04-21 Pending — AcadianaMLS
- 2026-04-21 Contingent — GSREIN
- 2026-03-05 Price Changed $119,900 AcadianaMLS
- 2026-03-05 Price Changed $119,900 GSREIN
- 2026-03-04 Price Changed $119,900 AcadianaMLS
- 2026-03-04 Price Changed $119,900 GBRMLS
- 2026-01-30 Listed $150,000 GBRMLS
- 2026-01-30 Listed $150,000 AcadianaMLS
- 2026-01-23 Listed $150,000 GSREIN
- 2026-01-23 Listed $150,000 AcadianaMLS
- 2025-08-11 Listed $150,000 GBRMLS
- 2025-08-11 Listed $150,000 AcadianaMLS
- 2024-12-12 Listed $150,000 AcadianaMLS
- 2024-09-21 Price Changed $150,000 GSREIN
- 2024-06-27 Listed $150,000 AcadianaMLS
- 2021-10-04 Sold (Public Records) $50,000 Public Records
Property tax history
+2.6%/yrLatest (2025): $646 · +4.5% YoY. Source: county tax records.
Cash-flow waterfall
monthlySold comps — $/sqft
last 12 mo · ≤1 miLoading sold comps…