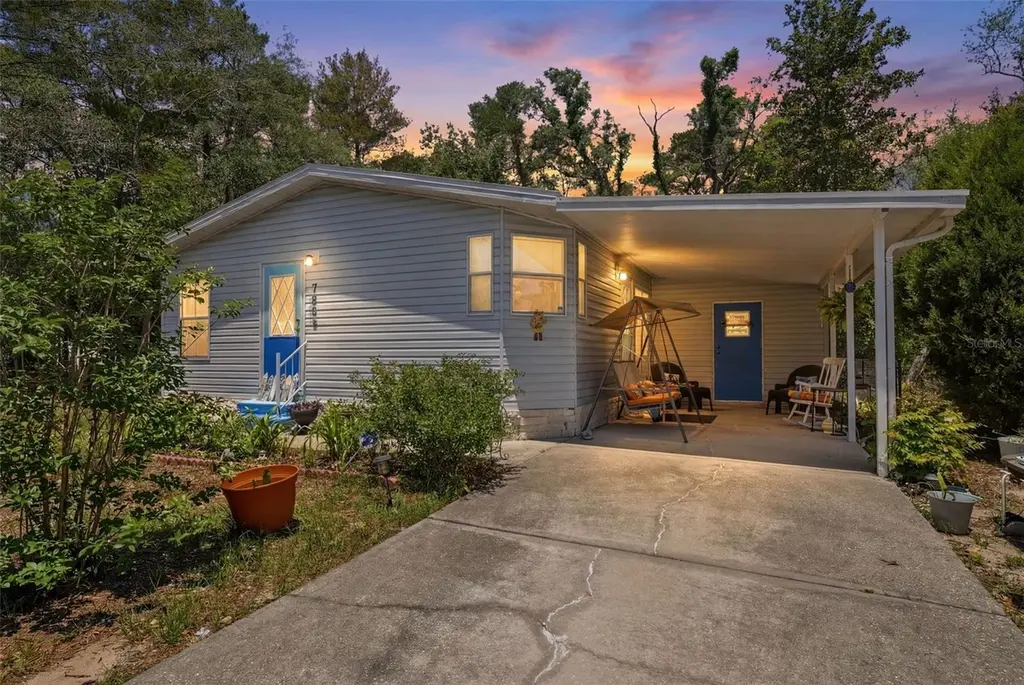
7355 Myhope Cir · Spring Hill, FL
Flood risk 3/10 · Minor
- FEMA flood zone
- X (unshaded)
- Chance of flooding over 30 yrs
- 0.2%
- Est. flood insurance / yr
- $507 – $1,088
Fire risk 4/10 · Minor
- Est. fire insurance / yr
- $947 – $1,759
Heat risk 10/10 · Severe
- Hot days now (above 110°F)
- 7 days/yr
- Hot days in 30 yrs
- 25 days/yr
Wind risk 10/10 · Severe
- Chance of severe wind over 30 yrs
- 99.0%
Air-quality risk 3/10 · Minor
- Unhealthy air days now
- 1 days/yr
- Unhealthy air days in 30 yrs
- 4 days/yr
Risk factors via First Street. Map © Google.
Why this score? — see what drove the D+ grade
The composite is a weighted blend of 9 inputs, each scored 0–100. Each bar is that input's sub-score; the figure is the points it added to the 100-point composite (weight × sub-score).
- Cash flow +22.6/30.0
- DSCR +7.2/10.0
- 1% rule +4.8/10.0
- Schools +4.2/10.0
- Livability +3.2/5.0
- Condition / age +2.5/5.0
- Rent growth +2.3/5.0
- ARV discount +0.0/15.0
- Appreciation +0.0/10.0
$165,000
🖨 Deal sheet 📄 Offer letter ✓ Due diligence
Listing remarks MLS
HUD property sold as-is. Case no. 093-609004 Information from sources deemed to be reliable but not guaranteed. Buyer to verify all information. This home is priced below market and is a true must see.
Key facts
- Cleared yard space
- Half acre
- Double closets
Tags
Property features AI
Finance
- Other: Homestead exempt; No lease restrictions; Partially furnished; Lot is approximately 0.5 acre (paved road access)
- HOA & community: No association; Street lights in community
Exterior
- Parking: Carport (1 space)
- Utilities: Public water; Septic tank; Electricity connected; Fiber optic available
- Home design: Manufactured double-wide home; One story; Faces south; Entry level: One
- Construction: Vinyl siding; Shingle roof; Crawlspace foundation; Built as a double wide
- Exterior features: Dog run; Shed(s)
Interior
- Kitchen: Range; Refrigerator
- Bedrooms: 2 bedrooms
- Flooring: Vinyl
- Bathrooms: 2 full bathrooms
- Heating & cooling: Central heating; Central air conditioning
- Interior features: High ceilings; Thermostat
- Laundry & utility: Laundry room; Electric water heater
Neighborhood map
What this means for you Summary
Snapshot
- This is a 2-bed/2.0-bath manufactured listed at $165k.
Deal economics
- At list price, monthly cash flow is $281 ($3k/yr) — positive.
- The deal already cash-flows at list — no discount required.
- To meet the 1% rule (rent ≥ 1% of price), the offer needs to be $161k (2.2% below list).
- Recommended offer: $161k (2.2% below list) — sets the bar for 1% rule.
- Cap rate 8.3% vs local median 4.4% in Spring Hill — top-decile yield for the area; either an underpriced asset or a hidden risk that comps aren't pricing in. Stress-test before assuming the spread holds.
Location & tenants
- Location reads 63/100 on livability (#738 in FL) — a middle-class / working-renter tenant base. Strengths: cost of living A+, housing A+; Watch: health & safety C-, employment D+, amenities F.
- Hernando (suburban): math 50% / reading 50% proficiency, ranked #38 of 73 in FL (top 52%) — acceptable for families but not a draw, mixed tenant base, ~2y average lease.
- Market conditions: Rents soft (-0.9%/yr); 386 active listings in the ZIP; 3 comparable units currently listed for rent nearby; rentals leasing fast (median 12d on market — plan ~1-2 weeks tenant-placement turnaround); 2,505 units permitted in Hernando County in 2024 (318 in 5+ unit buildings).
- This rent runs 34% of the median local income ($57k/yr) — at the standard rent-burdened threshold; future hikes will face affordability resistance.
Forward outlook
- Local home prices are declining (-3.0%/yr); year-one equity from $1k of loan paydown is wiped out by about $5k of value loss. Plan a longer hold.
- Hernando County population projected at +11% by 2050 — modest demand growth; plan on rents tracking national, not racing it.
Negotiation context
- Only 4 days on market — expect competitive offers; lowballing is unlikely to land.
- 2 sale attempts since 10y ago with the ask held roughly flat each time — persistent listings suggest the price (not the market) is what's stuck; bring a comps-based counter.
- Current owner paid $37k; list at $165k implies a 346% gain — meaningful room to come down on a strong offer.
Risks & watch-outs
- Climate carrying-cost: severe wind risk, 99% chance of damaging wind over 30y; extreme-heat days projected 7→25/yr by 2055 (HVAC capex compounding) — expect insurance premiums to compound above CPI over the hold.
Questions for the listing agent
- Is there a deadline driving the sale (1031 exchange, divorce, estate, relocation)? That informs how much negotiation room exists.
- The area grade is low — what's the realistic commute time and amenity access for the typical tenant pool here? Any planned neighborhood developments (good or bad) we should know about?
- What's the average days-on-market for RENTAL listings here right now (not sales)? A rising rental-DOM trend means longer vacancies and softer asking-rent achievability than the comps imply.
- What's the recent tenant-quality profile in this submarket — average credit score on applications, eviction rate, late-payment / NSF rate, and stable-employment percentage? A property-management company in the area should have these aggregated.
- How much new for-sale + rental construction is in the pipeline within 1–3 miles? Heavy new supply typically softens prices + rents 12–24 months out; constrained supply supports both.
Investment metrics
- 1% rule
- 0.98% ✗
- Cap rate
- 8.33%
- Cash-on-cash
- 7.29%
- DSCR
- 1.32
- GRM
- 8.5
CMA / ARV
- ARV (on-the-fly)
- $120,960
- Comps found
- 7
Show comp detail 7 sales within ~0.75 mi
| Address | Dist | Beds/Ba | Sqft | Sold | Price | $/sf | Match |
|---|---|---|---|---|---|---|---|
| 3286 Stone Hedge St | 0.31mi | 2/2.0 | 864 (0%) | 9mo | $121,000 | $140 | 78 |
| 3239 Morrison Way | 0.42mi | 2/2.0 | 924 (+7%) | 2mo | $110,000 | $119 | 67 |
| 7289 Toucan Trl | 0.15mi | 3/1.0 (+1) | 792 (-8%) | 4mo | $100,000 | $126 | 67 |
| 3339 Susan Dr | 0.20mi | 2/2.0 | 920 (+6%) | 17mo | $90,000 | $98 | 66 |
| 3245 Painters St | 0.32mi | 2/2.0 | 960 (+11%) | 10mo | $159,900 | $167 | 58 |
| 3387 Fiskway St | 0.47mi | 2/2.0 | 960 (+11%) | 8mo | $155,000 | $161 | 53 |
| 3300 Horseshoe Ln | 0.70mi | 2/2.0 | 896 (+4%) | 19mo | $130,000 | $145 | 45 |
Match score weights: distance 35% · size 25% · config 20% · recency 20%. Top-matched comps best support the ARV.
Projected returns pro-forma
-3.0% appreciation · 0.0% rent growth · sell at horizon
- IRR
- -8.3%
- Equity multiple
- 0.70×
- Total profit
- $-13,651
- Equity at exit
- $24,602
- IRR
- -2.7%
- Equity multiple
- 0.84×
- Total profit
- $-7,401
- Equity at exit
- $14,266
Cash invested: $46,200 (down + closing). Projections, not guarantees.
Landlord ↔ Tenant lean methodology
- Overall (STATE)
- 87 Strongly Landlord-Friendly
- State Florida
- 87 Strongly Landlord-Friendly · R+3
- County
- — inherits STATE
- City
- — inherits STATE
ZIP-level market 34606
- Home prices YoY
- -24.7%
- Rents YoY
- -0.9%
- Active inventory
- 386
- Price-to-rent
- 8.5×
Monthly cashflow live
- Estimated rent
- $1,613 medium interval (Pro) →
- Mortgage (P&I)
- −$865
- Tax from tax record
- −$59 /mo · $714/yr
- Insurance
- −$69
- HOA
- −$0
- Vacancy / Maint / Mgmt
- −$339
- Net cashflow
- $281
Break-even live
UW: 25.0% down · 7.5% · 30yr · 1.5% tax · 5.0% vac · 8.0% maint · 8.0% mgmt
Financing live
Cash to close
- Down payment
- $41,250
- Closing costs
- $4,950
- Reserves months
- —
- Total cash needed
- —
Loan-product check · same deal, 3 products live
Conventional
25% down · 7.5% · 30yr
- Down + closing
- —
- Monthly P&I
- —
- Monthly cashflow
- —
- DSCR
- —
- Eligible?
- —
Personal DTI + credit; lowest rate.
DSCR
20% down · 8.5% · 30yr
- Down + closing
- —
- Monthly P&I
- —
- Monthly cashflow
- —
- DSCR
- —
- Eligible?
- —
No personal income docs; deal must DSCR.
Hard money
10% down · 12.0% · 12mo
- Down + closing
- —
- Monthly P&I
- —
- Monthly cashflow
- —
- DSCR
- —
- Eligible?
- —
Short-term bridge; refi at stabilization.
Rent comps 3 comps
| Address | Beds | Baths | Sqft | Rent | $/sqft | DOM | Units | Dist |
|---|---|---|---|---|---|---|---|---|
| 7423 Mohawk Trl Spring Hill, FL | 3.0 | 2.0 | 1114 | $1,795 | $1.61 | 18d | 1 | 0.34mi |
| 3204 Painters St Spring Hill, FL | 2.0 | 2.0 | 749 | $1,300 | $1.74 | 11d | 1 | 0.39mi |
| 4300 Bridgewater Club Loop Spring Hill, FL | 2.0–4.0 | 2.0–3.0 | 1214 | $1,268 | $1.04 | 1d | 13 | 0.92mi |
Listing history 6 events
-
2026-05-21status Pending
-
2026-05-16$165,000 Active
-
2016-05-19soldstatus $37,000 201-char remark
Show marketing remark (201 chars)
HUD property sold as-is. Case no. 093-609004 Information from sources deemed to be reliable but not guaranteed. Buyer to verify all information. This home is priced below market and is a true must see.
-
2016-03-28$37,000 201-char remark
Show marketing remark (201 chars)
HUD property sold as-is. Case no. 093-609004 Information from sources deemed to be reliable but not guaranteed. Buyer to verify all information. This home is priced below market and is a true must see.
-
2002-04-26soldstatus $40,000
-
1998-02-11soldstatus $29,200
ⓘ Source: listings_history table (triggers on properties + properties_extension) + one-shot
backfill from property_details.listing_events for pre-trigger history.
Tax reassessment forecast FL · Resets to sale price
- Current annual tax
- $714 · $59/mo
- Projected year-2 tax
- $1,370 · $114/mo
- Expected delta
- +$656/yr (+$55/mo · 91.9%)
ⓘ Screening estimate from a state-policy table — verify with the county assessor before closing.
Climate risk First Street
- Flood 3/10 Moderate FEMA zone X (unshaded) · 20% chance over 30 yrs
- Wildfire 4/10 Moderate
- Heat 10/10 Extreme 7 d/yr ≥110°F today · 25 d/yr by 30 yrs out
- Wind 10/10 Extreme 99% chance of damaging wind over 30 yrs
- Air quality 3/10 Moderate 1 unhealthy d/yr today · 4 by 30 yrs out
Nearby sold comps map
Loading sold comps map…
Walkable amenities ~0.75 mi
Loading nearby amenities…
Taxation est. · year 1
- Rental income
- $19,355
- − Mortgage interest
- −$9,243
- − Property taxes
- −$714
- − Insurance
- −$825
- − Repairs & maintenance
- −$1,548
- − Management
- −$1,548
- − Depreciation
- −$4,800
- Taxable income
- $677
- Est. tax owed @ 24.0%
- −$162
- After-tax cash flow
- $3,206/yr
For passive investors: Depreciation is non-cash, so a rental often shows a tax loss while cash-flowing — sheltering income. Rental losses are passive: they offset passive income freely, and up to $25,000/yr can offset ordinary (W-2) income if you actively participate and your MAGI is under $100k (phasing out to $0 by $150k); unused losses carry forward. On sale, claimed depreciation is recaptured at up to 25%, and gains may owe capital-gains tax (a 1031 exchange can defer both). Figures are a year-1 estimate at your 24.0% rate — not tax advice; consult a CPA.
Schools (NCES district)
- District
- Hernando
- NCES district ID
- 1200810
- Math proficiency
- 50% ▼ -8.00%
- Reading proficiency
- 50% ▼ -4.00%
- Median HH income
- $41,985
- Composite
- 42.03/100
- National rank
- #3329
- State rank
- #38 of 73 in FL
Livability — Spring Hill
- Score
- 63/100
- State rank
- #738
- US rank
- #15937
Category grades
Schools grade is shown separately in the Schools card above.
Census & demographics
- Census place
- Spring Hill, FL
- County
- Hernando County · 169,677 people
- City population
- 83,915
- Metro
- Tampa-St. Petersburg-Clearwater, FL
- Population (ZIP)
- 28,668
- Household income
- $57,337
- Rent vs Own
- Severe rent burden
- 733.0
Population outlook (Hernando County) Hauer SSP2
- Today (2025)
- 189,218 people
- By 2030
- 194,367 · +2.7%
- By 2040
- 203,398 · +7.5%
- By 2050
- 209,589 · +10.8%
- By 2075
- 218,452 · +15.4%
- By 2100
- 205,923 · +8.8%
Race, ethnicity, and origin ACS 2023
- Neighborhood character
- Predominantly White (74%)
- Race & ethnicity
- White 74% Hispanic / Latino 16% Two or more races 13% Black 4%
- Hispanic origin (detail)
- Mexican 1% Puerto Rican 10% Cuban 2%
- Common ancestry
- Romanian 4% Lithuanian 3% Slovak 2%
- Foreign-born
- 8% · Canada, Jamaica
- Languages at home
- 87% English-only · Spanish 11% German/W. Germanic 1%
Political lean MEDSL · Hernando
- 2024 margin
- Solid R (+37.0) · D 31.1% · R 68.2%
- 2008→2024 swing
- -33.5pp toward R · 2008: -3.6pp · 2024: -37.0pp
- All cycles
- 2024: R+37.0 2020: R+30.2 2016: R+29.0 2012: R+8.5 2008: R+3.6
Not yet ingested
- Civics
- —
Market trends
- HPI YoY
- ▼ -98.11%
- Current HPI
- 298.5201
- Rent YoY
- ▼ -0.89%
- Metro
- Tampa-St. Petersburg-Clearwater, FL
- State GDP YoY
- ▲ 3.28%
- F500 in state
- 36
Industry mix (Fortune 500 HQ in FL)
| Industry | F500 HQs | Revenue |
|---|---|---|
| Industrial Technology | 2 | $29B |
|
||
| Insurance | 2 | $17B |
|
||
| Retail | 1 | $60B |
|
||
| Technology Distribution | 1 | $58B |
|
||
| Homebuilding | 1 | $35B |
|
||
| Technology Manufacturing | 1 | $35B |
|
||
Price history
+465.1% since first listed6 events — show timeline
- 2026-05-21 Pending — Stellar MLS as Distributed by MLS Grid
- 2026-05-16 Listed $165,000 Stellar MLS as Distributed by MLS Grid
- 2016-05-19 Sold (MLS) $37,000 Stellar MLS as Distributed by MLS Grid
- 2016-03-28 Listed $37,000 Stellar MLS as Distributed by MLS Grid
- 2002-04-26 Sold (Public Records) $40,000 Public Records
- 1998-02-11 Sold (Public Records) $29,200 Public Records
Property tax history
+0.1%/yrLatest (2025): $714 · -11.7% YoY. Source: county tax records.
Cash-flow waterfall
monthlySold comps — $/sqft
last 12 mo · ≤1 miLoading sold comps…