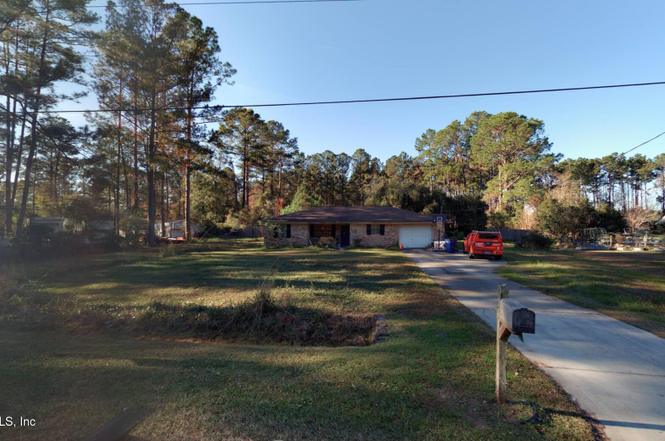
54591 Dornbush Rd · Nassau Village-Ratliff, FL
Flood risk 1/10 · Minimal
- FEMA flood zone
- X (unshaded)
- Chance of flooding over 30 yrs
- 0.0%
- Est. flood insurance / yr
- $507 – $1,088
Fire risk 7/10 · Major
- Est. fire insurance / yr
- $947 – $1,759
Heat risk 9/10 · Severe
- Hot days now (above 108°F)
- 7 days/yr
- Hot days in 30 yrs
- 20 days/yr
Wind risk 9/10 · Severe
- Chance of severe wind over 30 yrs
- 99.0%
Air-quality risk 5/10 · Moderate
- Unhealthy air days now
- 8 days/yr
- Unhealthy air days in 30 yrs
- 8 days/yr
Risk factors via First Street. Map © Google.
Why this score? — see what drove the D+ grade
The composite is a weighted blend of 9 inputs, each scored 0–100. Each bar is that input's sub-score; the figure is the points it added to the 100-point composite (weight × sub-score).
- ARV discount +15.0/15.0
- Appreciation +10.0/10.0
- Cash flow +7.4/30.0
- Schools +6.0/10.0
- Rent growth +2.5/5.0
- Livability +2.5/5.0
- Condition / age +2.5/5.0
- DSCR +1.5/10.0
- 1% rule +1.0/10.0
$254,000
🖨 Deal sheet (PDF) 📄 Offer letter ✓ Due diligence
Listing remarks
Brick home on just over 1 acre with pond and citrus trees. Featuring a split-bedroom floor plan, brick fireplace and plenty of potential. This property offers a great opportunity for buyers looking to add their personal touch with some TLC, including paint, flooring, and backyard maintenance. Being sold AS-IS with no repairs. Cash or conventional financing only.
Key facts
- 1.14 acre lot
- 2 garage spots
- Built 1991
Property features AI
Finance
- HOA & community: Not a senior community
Exterior
- Parking: 2-car garage
- Utilities: Septic tank; Cable available; Electricity connected
- Home design: Single family residence; One level
- Exterior features: Shingle roof; Road frontage on a county road; Asphalt road surface; Approximately 1.14-acre lot
Interior
- Kitchen: Dishwasher; Microwave; Refrigerator
- Bedrooms: 3 bedrooms
- Flooring: Carpet
- Bathrooms: 2 full bathrooms
- Heating & cooling: Central heating; Central air conditioning
- Interior features: Dishwasher; Microwave; Refrigerator
Neighborhood map
What this means for you Summary
Snapshot
- This is a 3-bed/2.0-bath single-family listed at $254k.
Deal economics
- At list price, monthly cash flow is $-331 ($-4k/yr) — negative.
- To cash-flow at today's rent, offer at most $196k (23.0% below list).
- To meet the 1% rule (rent ≥ 1% of price), the offer needs to be $152k (40.1% below list).
- Recommended offer: $152k (40.1% below list) — sets the bar for 1% rule.
- Cap rate 4.7% vs local median 2.1% in Nassau Village-Ratliff — top-decile yield for the area; either an underpriced asset or a hidden risk that comps aren't pricing in. Stress-test before assuming the spread holds.
Location & tenants
- Location reads: area grade D — affects rentability + tenant quality, not the cash-flow math above.
- Nassau (town): math 74% / reading 65% proficiency, ranked #4 of 73 in FL (top 6%) — acceptable for families but not a draw, mixed tenant base, ~2y average lease.
- Zoned schools: Callahan Elementary School (658 students, 51% FRL); Callahan Middle School (math 79% / reading 65%, grade A, #52 of 571 statewide, top 10%, 705 students, 46% FRL); West Nassau County High School (math 39% / reading 55%, grade D-, #207 of 667 statewide, top 32%, 974 students, 40% FRL).
- Market conditions: 103 active listings in the ZIP; 953 units permitted in Nassau County in 2024 (24 in 5+ unit buildings).
Forward outlook
- In year one you build about $27k of equity ($2k loan paydown + $25k appreciation (10.0% local appreciation)).
- Nassau County population projected at +17% by 2050 — long-run rental-demand tailwind backs the buy-and-hold thesis.
- By year 2, paydown + projected appreciation supports a ~$44k cash-out refi (75% LTV) — recoverable capital for the next deal without selling this one.
Negotiation context
- Only 6 days on market — expect competitive offers; lowballing is unlikely to land.
- Current owner paid $170k; 49% above their basis — modest negotiation headroom, anchor on the comps not their cost.
Risks & watch-outs
- Climate carrying-cost: severe wind risk, 99% chance of damaging wind over 30y; major wildfire risk; extreme-heat days projected 7→20/yr by 2055 (HVAC capex compounding) — expect insurance premiums to compound above CPI over the hold.
Questions for the listing agent
- What do current leases actually rent for vs. the listed asking? Can we see a recent rent roll and the last 12 months of T-12 income?
- Is there a deadline driving the sale (1031 exchange, divorce, estate, relocation)? That informs how much negotiation room exists.
- The area grade is low — what's the realistic commute time and amenity access for the typical tenant pool here? Any planned neighborhood developments (good or bad) we should know about?
- What's the average days-on-market for RENTAL listings here right now (not sales)? A rising rental-DOM trend means longer vacancies and softer asking-rent achievability than the comps imply.
- What's the recent tenant-quality profile in this submarket — average credit score on applications, eviction rate, late-payment / NSF rate, and stable-employment percentage? A property-management company in the area should have these aggregated.
- How much new for-sale + rental construction is in the pipeline within 1–3 miles? Heavy new supply typically softens prices + rents 12–24 months out; constrained supply supports both.
Investment metrics
- 1% rule
- 0.60% ✗
- Cap rate
- 4.73%
- Cash-on-cash
- -5.58%
- DSCR
- 0.75
- GRM
- 13.9
CMA / ARV
- ARV (on-the-fly)
- $335,385
- Comps found
- 2
Show comp detail 2 sales within ~0.75 mi
| Address | Dist | Beds/Ba | Sqft | Sold | Price | $/sf | Match |
|---|---|---|---|---|---|---|---|
| 54292 Armstrong Rd | 0.38mi | 3/2.0 | 1,340 (+3%) | 13mo | $325,000 | $243 | 67 |
| 54123 Lisa Dr | 0.51mi | 3/2.0 | 1,481 (+14%) | 1mo | $380,000 | $257 | 53 |
Match score weights: distance 35% · size 25% · config 20% · recency 20%. Top-matched comps best support the ARV.
Projected returns pro-forma
10.0% appreciation · 3.0% rent growth · sell at horizon
- IRR
- 20.3%
- Equity multiple
- 2.65×
- Total profit
- $117,145
- Equity at exit
- $228,823
- IRR
- 18.5%
- Equity multiple
- 6.08×
- Total profit
- $361,321
- Equity at exit
- $493,466
Cash invested: $71,120 (down + closing). Projections, not guarantees.
Landlord ↔ Tenant lean methodology
- Overall (STATE)
- 87 Strongly Landlord-Friendly
- State Florida
- 87 Strongly Landlord-Friendly · R+3
- County
- — inherits STATE
- City
- — inherits STATE
ZIP-level market 32011
- Home prices YoY
- 19.2%
- Active inventory
- 103
- Price-to-rent
- 13.9×
Monthly cashflow live
- Estimated rent
- $1,522 medium interval (Pro) →
- Mortgage (P&I)
- −$1,332
- Tax from tax record
- −$96 /mo · $1,150/yr
- Insurance
- −$106
- HOA
- −$0
- Vacancy / Maint / Mgmt
- −$320
- Net cashflow
- $-331
Break-even live
Sensitivity live
| Price | -10% $-187 | -5% $-259 | +0% $-331 | +5% $-403 | +10% $-475 |
|---|---|---|---|---|---|
| Rent | -10% $-451 | -5% $-391 | +0% $-331 | +5% $-271 | +10% $-211 |
| Rate | -1.0pp $-203 | -0.5pp $-266 | base $-331 | +0.5pp $-397 | +1.0pp $-464 |
UW: 25.0% down · 7.5% · 30yr · 1.5% tax · 5.0% vac · 8.0% maint · 8.0% mgmt
Financing live
Cash to close
- Down payment
- $63,500
- Closing costs
- $7,620
- Reserves months
- —
- Total cash needed
- —
Loan-product check · same deal, 3 products live
Conventional
25% down · 7.5% · 30yr
- Down + closing
- —
- Monthly P&I
- —
- Monthly cashflow
- —
- DSCR
- —
- Eligible?
- —
Personal DTI + credit; lowest rate.
DSCR
20% down · 8.5% · 30yr
- Down + closing
- —
- Monthly P&I
- —
- Monthly cashflow
- —
- DSCR
- —
- Eligible?
- —
No personal income docs; deal must DSCR.
Hard money
10% down · 12.0% · 12mo
- Down + closing
- —
- Monthly P&I
- —
- Monthly cashflow
- —
- DSCR
- —
- Eligible?
- —
Short-term bridge; refi at stabilization.
Listing history 6 events
-
2026-06-21days on market $254,000 Active 6 DOM
-
2026-06-18remarks 364-char remark
-
2026-06-18days on market $254,000 Active 3 DOM
-
2026-06-17days on market $254,000 Active 2 DOM
-
2026-06-15remarks 319-char remark
-
2026-06-15$254,000 Active 1 DOM
ⓘ Source: listings_history table (triggers on properties + properties_extension) + one-shot
backfill from property_details.listing_events for pre-trigger history.
Tax reassessment forecast FL · Resets to sale price
- Current annual tax
- $1,150 · $96/mo
- Projected year-2 tax
- $2,108 · $176/mo
- Expected delta
- +$958/yr (+$80/mo · 83.3%)
ⓘ Screening estimate from a state-policy table — verify with the county assessor before closing.
Climate risk First Street
- Flood 1/10 Low FEMA zone X (unshaded) · 0% chance over 30 yrs
- Wildfire 7/10 Severe
- Heat 9/10 Extreme 7 d/yr ≥108°F today · 20 d/yr by 30 yrs out
- Wind 9/10 Extreme 99% chance of damaging wind over 30 yrs
- Air quality 5/10 Major 8 unhealthy d/yr today · 8 by 30 yrs out
Nearby sold comps map
Loading sold comps map…
Walkable amenities ~0.75 mi
Loading nearby amenities…
Taxation est. · year 1
- Rental income
- $18,270
- − Mortgage interest
- −$14,228
- − Property taxes
- −$1,150
- − Insurance
- −$1,270
- − Repairs & maintenance
- −$1,462
- − Management
- −$1,462
- − Depreciation
- −$7,389
- Taxable loss
- −$8,691
- Est. tax savings @ 24.0%
- +$2,086
- After-tax cash flow
- $-1,885/yr
For passive investors: Depreciation is non-cash, so a rental often shows a tax loss while cash-flowing — sheltering income. Rental losses are passive: they offset passive income freely, and up to $25,000/yr can offset ordinary (W-2) income if you actively participate and your MAGI is under $100k (phasing out to $0 by $150k); unused losses carry forward. On sale, claimed depreciation is recaptured at up to 25%, and gains may owe capital-gains tax (a 1031 exchange can defer both). Figures are a year-1 estimate at your 24.0% rate — not tax advice; consult a CPA.
Schools (NCES district)
- District
- Nassau
- NCES district ID
- 1201350
- Math proficiency
- 74% ▼ -2.00%
- Reading proficiency
- 65% ▼ -2.00%
- Median HH income
- $58,267
- Composite
- 59.79/100
- National rank
- #899
- State rank
- #4 of 73 in FL
Livability — Nassau Village-Ratliff
No livability data for this city. (Only ~50 U.S. cities are tracked.)
Census & demographics
- Census place
- Nassau Village-Ratliff, FL
- Population (ZIP)
- 15,716
Population outlook (Nassau County) Hauer SSP2
- Today (2025)
- 88,419 people
- By 2030
- 92,679 · +4.8%
- By 2040
- 99,257 · +12.3%
- By 2050
- 103,378 · +16.9%
- By 2075
- 109,726 · +24.1%
- By 2100
- 107,006 · +21.0%
Race, ethnicity, and origin ACS 2023
- Neighborhood character
- Predominantly White (92%)
- Race & ethnicity
- White 92% Black 3% Hispanic / Latino 3% Two or more races 3%
- Common ancestry
- Italian 2% Slovak 2% Lithuanian 1%
- Foreign-born
- 2% · Canada
- Languages at home
- 98% English-only · Spanish 1%
Political lean MEDSL · Nassau
- 2024 margin
- Solid R (+46.9) · D 26.1% · R 73.1%
- 2008→2024 swing
- -3.1pp toward R · 2008: -43.8pp · 2024: -46.9pp
- All cycles
- 2024: R+46.9 2020: R+45.9 2016: R+50.2 2012: R+48.6 2008: R+43.8
Not yet ingested
- Civics
- —
Market trends
- HPI YoY
- ▲ 56.56%
- Current HPI
- 351.8301
- Rent YoY
- —
- Metro
- —
- State GDP YoY
- ▲ 3.28%
- F500 in state
- 36
Industry mix (Fortune 500 HQ in FL)
| Industry | F500 HQs | Revenue |
|---|---|---|
| Industrial Technology | 2 | $29B |
|
||
| Insurance | 2 | $17B |
|
||
| Retail | 1 | $60B |
|
||
| Technology Distribution | 1 | $58B |
|
||
| Homebuilding | 1 | $35B |
|
||
| Technology Manufacturing | 1 | $35B |
|
||
Price history
+483.9% since first listed5 events — show timeline
- 2026-06-15 Listed $254,000 realMLS
- 2008-04-04 Sold (Public Records) $170,000 Public Records
- 2003-07-16 Sold (Public Records) $128,000 Public Records
- 1991-10-18 Sold (Public Records) $70,300 Public Records
- 1990-04-05 Sold (Public Records) $43,500 Public Records
Property tax history
+2.9%/yrLatest (2025): $1,150 · +2.0% YoY. Source: county tax records.
Cash-flow waterfall
monthlySold comps — $/sqft
last 12 mo · ≤1 miLoading sold comps…