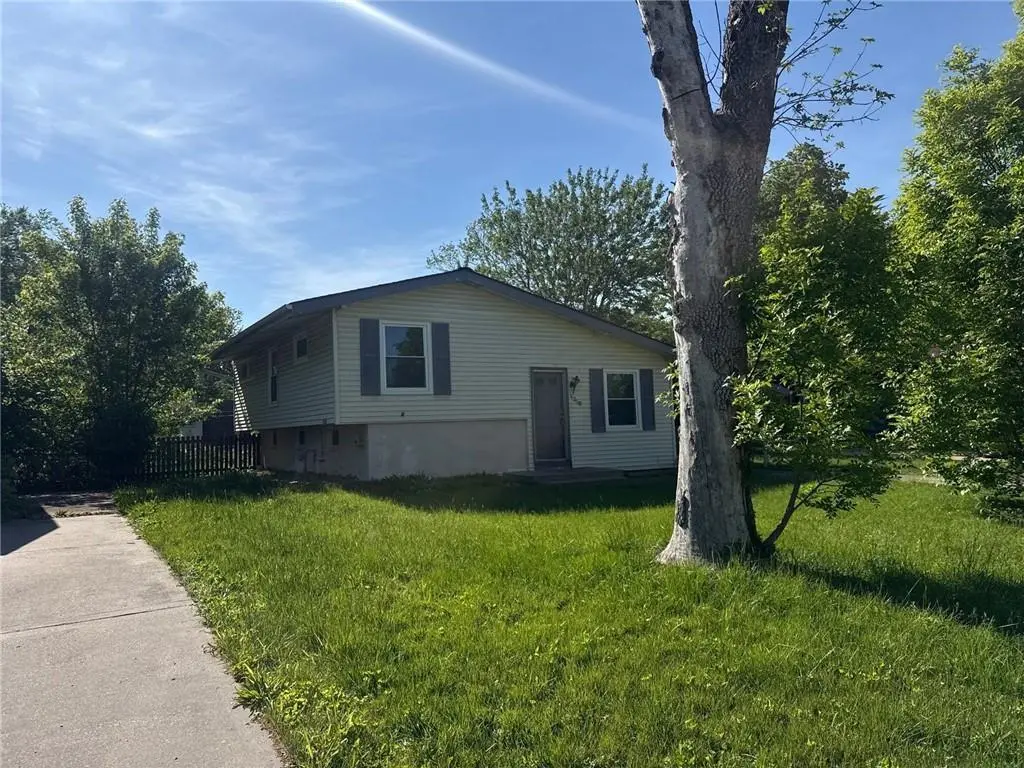
4258 N Colorado Ave · Kansas City, MO
Flood risk 1/10 · Minimal
- FEMA flood zone
- X (unshaded)
- Chance of flooding over 30 yrs
- 0.0%
- Est. flood insurance / yr
- $473 – $860
Fire risk 1/10 · Minimal
- Est. fire insurance / yr
- $1,054 – $1,958
Heat risk 4/10 · Minor
- Hot days now (above 108°F)
- 7 days/yr
- Hot days in 30 yrs
- 17 days/yr
Wind risk 2/10 · Minimal
- Chance of severe wind over 30 yrs
- —
Air-quality risk 3/10 · Minor
- Unhealthy air days now
- 2 days/yr
- Unhealthy air days in 30 yrs
- 3 days/yr
Risk factors via First Street. Map © Google.
Why this score? — see what drove the C- grade
The composite is a weighted blend of 9 inputs, each scored 0–100. Each bar is that input's sub-score; the figure is the points it added to the 100-point composite (weight × sub-score).
- Cash flow +15.7/30.0
- ARV discount +15.0/15.0
- DSCR +4.8/10.0
- Livability +3.9/5.0
- 1% rule +3.8/10.0
- Schools +3.8/10.0
- Rent growth +2.6/5.0
- Condition / age +2.5/5.0
- Appreciation +0.0/10.0
$159,900
🖨 Deal sheet 📄 Offer letter ✓ Due diligence
Listing remarks MLS
Great location to be close to everything! Tucked in a cute neighborhood & away from main road, enjoy the quiet of your fenced backyard & large deck. Interior boasts new paint in living room with loft ceilings. Sellers added a full bath in lower level, making it into a 4th non-conforming bedroom (due to window not being large enough to call it a true bedroom) Rare to find this floorplan under $100K with 2 full baths. Perfect reason to stop renting & start building equity in your 1st home. Come check it out today!
Key facts
- Convenient carport
- 7,841 sq ft lot
- Built 1957
Tags
Property features AI
Finance
- Other: Living area reported as 1,312 (source: public records); Above-grade finished area reported as 928; below-grade finished area reported as 384
- HOA & community: No association fees; Some maintenance provided
Exterior
- Parking: Carport
- Utilities: Public water; Public sewer
- Home design: Single-family residence; Residential property; California split floor plan
- Construction: Frame construction; Composition roof; Basement with concrete construction; Home age approximately 51–75 years
- Exterior features: Metal fencing; Not in a flood plain
Interior
- Kitchen: Includes eat-in kitchen (appliances not specified)
- Bedrooms: 3 bedrooms
- Flooring: Wood floors
- Bathrooms: 2 full bathrooms
- Heating & cooling: Natural gas heating; Electric cooling
- Interior features: Eat-in kitchen; California split floor plan
- Laundry & utility: Laundry located in basement
Neighborhood map
What this means for you Summary
Snapshot
- This is a 3-bed/1.0-bath single-family listed at $160k.
Deal economics
- At list price, monthly cash flow is $69 ($834/yr) — positive.
- The deal already cash-flows at list — no discount required.
- To meet the 1% rule (rent ≥ 1% of price), the offer needs to be $141k (11.5% below list).
- Recommended offer: $141k (11.5% below list) — sets the bar for 1% rule.
- Cap rate 6.8% vs local median 3.9% in Kansas City — top-decile yield for the area; either an underpriced asset or a hidden risk that comps aren't pricing in. Stress-test before assuming the spread holds.
Location & tenants
- Location reads 78/100 on livability (#28 in MO, #2,671 nationally) — a middle-class / working-renter tenant base. Strengths: amenities A+, commute A+, cost of living A+; Watch: schools C-, crime F.
- North Kansas City 74 (urban): math 38% / reading 49% proficiency, ranked #98 of 324 in MO (top 30%) — families likely to look elsewhere, expect single-tenant / working-renter base with shorter leases.
- Market conditions: Rents flat; 50 active listings in the ZIP; 8 comparable units currently listed for rent nearby; rentals at typical pace (median 24d on market — plan ~3-4 weeks tenant-placement turnaround); 341 units permitted in Clay County in 2024 (40 in 5+ unit buildings).
Forward outlook
- Local home prices are declining (-3.0%/yr); year-one equity from $1k of loan paydown is wiped out by about $5k of value loss. Plan a longer hold.
- Clay County population projected at +24% by 2050 — long-run rental-demand tailwind backs the buy-and-hold thesis.
Negotiation context
- It's been on market 43 days — a 3% lower offer ($155k) is reasonable based on typical stale-listing flexibility.
- 7 sale attempts since 27y ago; this cycle's ask has dropped $10k (6%) from the opening price — seller is motivated, your offer sets the floor, not the list.
Risks & watch-outs
- Watch-outs: built in 1957 — expect roof / HVAC / electrical / plumbing capex.
Questions for the listing agent
- It's been on market 43 days. Have you received any prior offers? Is the seller open to a 12% concession, seller financing, or rate buy-down credit?
- Built in 1957 — when were the roof, HVAC, electrical panel, plumbing, and water heater last replaced?
- Is there a deadline driving the sale (1031 exchange, divorce, estate, relocation)? That informs how much negotiation room exists.
- Crime grade is F in this area — have there been break-ins, vandalism, or insurance claims at this property in the last 3 years? What carrier currently insures it and at what premium?
- What's the average days-on-market for RENTAL listings here right now (not sales)? A rising rental-DOM trend means longer vacancies and softer asking-rent achievability than the comps imply.
- What's the recent tenant-quality profile in this submarket — average credit score on applications, eviction rate, late-payment / NSF rate, and stable-employment percentage? A property-management company in the area should have these aggregated.
- How much new for-sale + rental construction is in the pipeline within 1–3 miles? Heavy new supply typically softens prices + rents 12–24 months out; constrained supply supports both.
Investment metrics
- 1% rule
- 0.88% ✗
- Cap rate
- 6.81%
- Cash-on-cash
- 1.86%
- DSCR
- 1.08
- GRM
- 9.4
CMA / ARV
- ARV (median comp)
- $227,655
- List price
- $159,900
- Delta
- -29.76%
- Verdict
- UNDERPRICED
- Comps
- 20 within 1.0 mi
Show comp detail 12 sales within ~0.75 mi
| Address | Dist | Beds/Ba | Sqft | Sold | Price | $/sf | Match |
|---|---|---|---|---|---|---|---|
| 5301 NE 42nd Ter | 0.05mi | 3/2.0 | 936 (+1%) | 2mo | $216,000 | $231 | 90 |
| 5012 NE 42nd St | 0.17mi | 3/2.0 | 960 (+3%) | 3mo | $220,000 | $229 | 80 |
| 4357 N Drury Ave | 0.20mi | 3/1.0 | 864 (-7%) | 3mo | $210,000 | $243 | 77 |
| 5111 NE 44th Ter | 0.23mi | 3/2.0 | 960 (+3%) | 4mo | $230,000 | $240 | 77 |
| 5401 NE Russell Rd | 0.38mi | 3/1.0 | 878 (-5%) | 1mo | $200,000 | $228 | 72 |
| 5008 NE 46th St | 0.45mi | 3/2.0 | 912 (-2%) | 3mo | $150,000 | $164 | 70 |
| 4437 N Jackson Ave | 0.69mi | 3/1.0 | 925 (-0%) | 1mo | $169,900 | $184 | 67 |
| 5115 NE 46th St | 0.41mi | 2/1.5 (-1) | 996 (+7%) | 1mo | $185,000 | $186 | 61 |
| 4420 N Jackson Ave | 0.70mi | 2/1.0 (-1) | 912 (-2%) | 2mo | $164,950 | $181 | 58 |
| 4823 NE 46th St | 0.46mi | 3/1.5 | 1,032 (+11%) | 4mo | $230,000 | $223 | 55 |
| 4412 N Jackson Ave | 0.69mi | 3/1.0 | 831 (-10%) | 0mo | $170,000 | $205 | 50 |
| 4701 N Oakley Ave | 0.63mi | 2/2.0 (-1) | 1,000 (+8%) | 2mo | $223,000 | $223 | 47 |
Match score weights: distance 35% · size 25% · config 20% · recency 20%. Top-matched comps best support the ARV.
Projected returns pro-forma
-3.0% appreciation · 0.49% rent growth · sell at horizon
- IRR
- -16.1%
- Equity multiple
- 0.44×
- Total profit
- $-24,984
- Equity at exit
- $23,842
- IRR
- -12.6%
- Equity multiple
- 0.34×
- Total profit
- $-29,712
- Equity at exit
- $13,825
Cash invested: $44,772 (down + closing). Projections, not guarantees.
Landlord ↔ Tenant lean methodology
- Overall (STATE)
- 81 Strongly Landlord-Friendly
- State Missouri
- 81 Strongly Landlord-Friendly · R+10
- County
- — inherits STATE
- City
- — inherits STATE
ZIP-level market 64117
- Rents YoY
- 0.5%
- Active inventory
- 50
- Price-to-rent
- 9.4×
Monthly cashflow live
- Estimated rent
- $1,415 high interval (Pro) →
- Mortgage (P&I)
- −$839
- Tax from tax record
- −$143 /mo · $1,715/yr
- Insurance
- −$67
- HOA
- −$0
- Vacancy / Maint / Mgmt
- −$297
- Net cashflow
- $69
Break-even live
Sensitivity live
| Price | -10% $160 | -5% $115 | +0% $69 | +5% $24 | +10% $-21 |
|---|---|---|---|---|---|
| Rent | -10% $-42 | -5% $14 | +0% $69 | +5% $125 | +10% $181 |
| Rate | -1.0pp $150 | -0.5pp $110 | base $69 | +0.5pp $28 | +1.0pp $-14 |
UW: 25.0% down · 7.5% · 30yr · 1.5% tax · 5.0% vac · 8.0% maint · 8.0% mgmt
Financing live
Cash to close
- Down payment
- $39,975
- Closing costs
- $4,797
- Reserves months
- —
- Total cash needed
- —
Loan-product check · same deal, 3 products live
Conventional
25% down · 7.5% · 30yr
- Down + closing
- —
- Monthly P&I
- —
- Monthly cashflow
- —
- DSCR
- —
- Eligible?
- —
Personal DTI + credit; lowest rate.
DSCR
20% down · 8.5% · 30yr
- Down + closing
- —
- Monthly P&I
- —
- Monthly cashflow
- —
- DSCR
- —
- Eligible?
- —
No personal income docs; deal must DSCR.
Hard money
10% down · 12.0% · 12mo
- Down + closing
- —
- Monthly P&I
- —
- Monthly cashflow
- —
- DSCR
- —
- Eligible?
- —
Short-term bridge; refi at stabilization.
Rent comps 8 comps
| Address | Beds | Baths | Sqft | Rent | $/sqft | DOM | Units | Dist |
|---|---|---|---|---|---|---|---|---|
| 4515 NE 46th Ter Kansas City, MO | 3.0 | 1.0 | 1047 | $1,585 | $1.51 | 24d | 1 | 0.63mi |
| 4431 NE Winn Rd Kansas City, MO | 2.0 | 1.0 | 600 | $1,000 | $1.67 | 24d | 1 | 0.71mi |
| 4623 NE Winn Rd Kansas City, MO | 2.0 | 1.0–2.0 | 852 | $1,185 | $1.39 | 3d | 18 | 0.83mi |
| 3501 N Drury Ave Kansas City, MO | 2.0 | 1.0 | 890 | $1,295 | $1.46 | 21d | 1 | 0.84mi |
| 3622 N Chouteau Trfy Kansas City, MO | 2.0 | 2.0 | 1000 | $1,125 | $1.12 | 44d | 1 | 1.06mi |
| 5042 N Bellaire Ave Kansas City, MO | 2.0 | 1.0 | 900 | $1,391 | $1.55 | 24d | 1 | 1.11mi |
| 4140 N Walrond Ave Unit 1-40010 Kansas City, MO | 2.0 | 1.0 | 732 | $1,000 | $1.37 | 20d | 1 | 1.25mi |
| 3735 N Walrond Ave Kansas City, MO | 3.0 | 1.5 | 936 | $1,175 | $1.26 | 20d | 1 | 1.39mi |
Listing history 32 events
-
2026-06-18days on market $159,900 Active 43 DOM
-
2026-06-17days on market $159,900 Active 42 DOM
-
2026-06-16pricedays on market $159,900 Active 41 DOM
-
2026-06-15days on market $169,900 Active 40 DOM
-
2026-06-13days on market $169,900 Active 38 DOM
-
2026-06-13days on market $169,900 Active 37 DOM
-
2026-06-09days on market $169,900 Active 34 DOM
-
2026-06-08days on market $169,900 Active 33 DOM
-
2026-06-07days on market $169,900 Active 32 DOM
-
2026-06-05days on market $169,900 Active 29 DOM
-
2026-06-03days on market $169,900 Active 28 DOM
-
2026-06-02days on market $169,900 Active 27 DOM
-
2026-06-01days on market $169,900 Active 26 DOM
-
2026-05-31days on market $169,900 Active 25 DOM
-
2026-05-06$169,900 Active 490-char remark
-
2025-09-17historical
-
2025-08-20price $180,000
-
2025-07-24price $184,000
-
2025-06-06$199,950 Active
-
2022-08-19soldstatus
-
2016-08-26soldstatus
-
2016-08-25soldstatus Sold
Show marketing remark (535 chars)
Great location to be close to everything! Tucked in a cute neighborhood & away from main road, enjoy the quiet of your fenced backyard & large deck. Interior boasts new paint in living room with loft ceilings. Sellers added a full bath in lower level, making it into a 4th non-conforming bedroom (due to window not being large enough to call it a true bedroom) Rare to find this floorplan under $100K with 2 full baths. Perfect reason to stop renting & start building equity in your 1st home. Come check it out today!
-
2016-07-04historical Contingent - Accepting Backup Offers
Show marketing remark (535 chars)
Great location to be close to everything! Tucked in a cute neighborhood & away from main road, enjoy the quiet of your fenced backyard & large deck. Interior boasts new paint in living room with loft ceilings. Sellers added a full bath in lower level, making it into a 4th non-conforming bedroom (due to window not being large enough to call it a true bedroom) Rare to find this floorplan under $100K with 2 full baths. Perfect reason to stop renting & start building equity in your 1st home. Come check it out today!
-
2016-06-18price $91,000
Show marketing remark (535 chars)
Great location to be close to everything! Tucked in a cute neighborhood & away from main road, enjoy the quiet of your fenced backyard & large deck. Interior boasts new paint in living room with loft ceilings. Sellers added a full bath in lower level, making it into a 4th non-conforming bedroom (due to window not being large enough to call it a true bedroom) Rare to find this floorplan under $100K with 2 full baths. Perfect reason to stop renting & start building equity in your 1st home. Come check it out today!
-
2016-06-08$93,000 Active
Show marketing remark (535 chars)
Great location to be close to everything! Tucked in a cute neighborhood & away from main road, enjoy the quiet of your fenced backyard & large deck. Interior boasts new paint in living room with loft ceilings. Sellers added a full bath in lower level, making it into a 4th non-conforming bedroom (due to window not being large enough to call it a true bedroom) Rare to find this floorplan under $100K with 2 full baths. Perfect reason to stop renting & start building equity in your 1st home. Come check it out today!
-
2014-09-29$90,000
-
2014-01-16$99,000
-
2003-09-25soldstatus
-
2003-08-18$95,500
-
1999-02-26soldstatus
-
1999-02-26soldstatus
-
1999-01-12$75,950
ⓘ Source: listings_history table (triggers on properties + properties_extension) + one-shot
backfill from property_details.listing_events for pre-trigger history.
Tax reassessment forecast MO · Resets to sale price
- Current annual tax
- $1,715 · $143/mo
- Projected year-2 tax
- $1,715 · $143/mo
- Expected delta
- $0/yr ($0/mo · 0.0%)
ⓘ Screening estimate from a state-policy table — verify with the county assessor before closing.
Climate risk First Street
- Flood 1/10 Low FEMA zone X (unshaded) · 0% chance over 30 yrs
- Wildfire 1/10 Low
- Heat 4/10 Moderate 7 d/yr ≥108°F today · 17 d/yr by 30 yrs out
- Wind 2/10 Low
- Air quality 3/10 Moderate 2 unhealthy d/yr today · 3 by 30 yrs out
Nearby sold comps map
Loading sold comps map…
Walkable amenities ~0.75 mi
Loading nearby amenities…
Taxation est. · year 1
- Rental income
- $16,975
- − Mortgage interest
- −$8,957
- − Property taxes
- −$1,715
- − Insurance
- −$800
- − Repairs & maintenance
- −$1,358
- − Management
- −$1,358
- − Depreciation
- −$4,652
- Taxable loss
- −$1,863
- Est. tax savings @ 24.0%
- +$447
- After-tax cash flow
- $1,281/yr
For passive investors: Depreciation is non-cash, so a rental often shows a tax loss while cash-flowing — sheltering income. Rental losses are passive: they offset passive income freely, and up to $25,000/yr can offset ordinary (W-2) income if you actively participate and your MAGI is under $100k (phasing out to $0 by $150k); unused losses carry forward. On sale, claimed depreciation is recaptured at up to 25%, and gains may owe capital-gains tax (a 1031 exchange can defer both). Figures are a year-1 estimate at your 24.0% rate — not tax advice; consult a CPA.
Schools (NCES district)
- District
- North Kansas City 74
- NCES district ID
- 2922800
- Math proficiency
- 38% ▼ -11.00%
- Reading proficiency
- 49% ▼ -3.00%
- Median HH income
- $55,444
- Composite
- 37.88/100
- National rank
- #4321
- State rank
- #98 of 324 in MO
Livability — Kansas City
- Score
- 78/100
- State rank
- #28
- US rank
- #2671
Category grades
Schools grade is shown separately in the Schools card above.
Census & demographics
- Census place
- Kansas City, MO
- County
- Clay County · 220,651 people
- City population
- 439,467
- Metro
- Kansas City, MO-KS
- Population (ZIP)
- 14,919
- Household income
- $59,601
- Rent vs Own
- Severe rent burden
- 788.0
Population outlook (Clay County) Hauer SSP2
- Today (2025)
- 266,022 people
- By 2030
- 280,057 · +5.3%
- By 2040
- 306,153 · +15.1%
- By 2050
- 328,630 · +23.5%
- By 2075
- 375,182 · +41.0%
- By 2100
- 392,861 · +47.7%
Race, ethnicity, and origin ACS 2023
- Neighborhood character
- Diverse neighborhood (Simpson 0.56)
- Race & ethnicity
- White 63% Hispanic / Latino 15% Black 14% Two or more races 8% Asian 2%
- Hispanic origin (detail)
- Mexican 9%
- Common ancestry
- Arab 3% Lithuanian 2% Serbian 1%
- Foreign-born
- 13% · Canada
- Languages at home
- 84% English-only · Spanish 9% Other Indo-European 3% Arabic 2%
Political lean MEDSL · Clay
- 2024 margin
- Lean R (+5.6) · D 46.4% · R 52.0% · Other 1.6%
- 2008→2024 swing
- -4.9pp toward R · 2008: -0.7pp · 2024: -5.6pp
- All cycles
- 2024: R+5.6 2020: R+4.1 2016: R+11.1 2012: R+8.4 2008: R+0.7
Not yet ingested
- Civics
- —
Market trends
- HPI YoY
- ▼ -229.68%
- Current HPI
- 304.5632
- Rent YoY
- ▲ 0.49%
- Metro
- Kansas City, MO-KS
- State GDP YoY
- ▲ 1.84%
- F500 in state
- 20
Industry mix (Fortune 500 HQ in MO)
| Industry | F500 HQs | Revenue |
|---|---|---|
| Healthcare | 1 | $163B |
|
||
| Insurance | 1 | $21B |
|
||
| Industrial Technology | 1 | $17B |
|
||
| Retail | 1 | $16B |
|
||
| Industrial Distribution | 1 | $10B |
|
||
| Utilities | 1 | $9B |
|
||
Price history
+110.5% since first listed19 events — show timeline
- 2026-06-16 Price Changed $159,900 Heartland MLS as Distributed by MLS Grid
- 2026-05-06 Listed $169,900 Heartland MLS as Distributed by MLS Grid
- 2025-09-17 Listing Removed — Heartland MLS as Distributed by MLS Grid
- 2025-08-20 Price Changed $180,000 Heartland MLS as Distributed by MLS Grid
- 2025-07-24 Price Changed $184,000 Heartland MLS as Distributed by MLS Grid
- 2025-06-06 Listed $199,950 Heartland MLS as Distributed by MLS Grid
- 2022-08-19 Sold (Public Records) — Public Records
- 2016-08-26 Sold (Public Records) — Public Records
- 2016-08-25 Sold (MLS) — Heartland MLS as Distributed by MLS Grid
- 2016-07-04 Contingent — Heartland MLS as Distributed by MLS Grid
- 2016-06-18 Price Changed $91,000 Heartland MLS as Distributed by MLS Grid
- 2016-06-08 Listed $93,000 Heartland MLS as Distributed by MLS Grid
- 2014-09-29 Listed $90,000 Heartland MLS as Distributed by MLS Grid
- 2014-01-16 Listed $99,000 Heartland MLS as Distributed by MLS Grid
- 2003-09-25 Sold (MLS) — Heartland MLS as Distributed by MLS Grid
- 2003-08-18 Listed $95,500 Heartland MLS as Distributed by MLS Grid
- 1999-02-26 Sold (Public Records) — Public Records
- 1999-02-26 Sold (MLS) — Heartland MLS as Distributed by MLS Grid
- 1999-01-12 Listed $75,950 Heartland MLS as Distributed by MLS Grid
Property tax history
+3.6%/yrLatest (2025): $1,715 · +3.3% YoY. Source: county tax records.
Cash-flow waterfall
monthlySold comps — $/sqft
last 12 mo · ≤1 miLoading sold comps…