 Multi-family
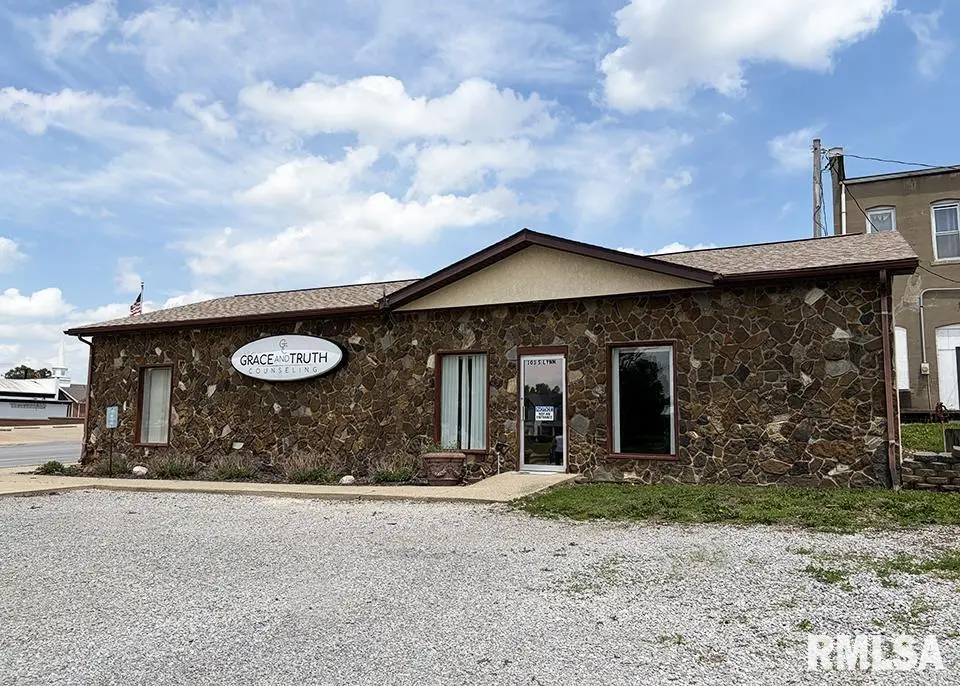
235 Chestnut St · Louisville, IL
Flood risk No data
- FEMA flood zone
- —
- Chance of flooding over 30 yrs
- —
- Est. flood insurance / yr
- —
Fire risk No data
- Est. fire insurance / yr
- —
Heat risk No data
- Hot days now (above threshold)
- —
- Hot days in 30 yrs
- —
Wind risk No data
- Chance of severe wind over 30 yrs
- —
Air-quality risk No data
- Unhealthy air days now
- —
- Unhealthy air days in 30 yrs
- —
Risk factors via First Street. Map © Google.
Why this score? — see what drove the B+ grade
The composite is a weighted blend of 9 inputs, each scored 0–100. Each bar is that input's sub-score; the figure is the points it added to the 100-point composite (weight × sub-score).
- Cash flow +30.0/30.0
- 1% rule +10.0/10.0
- DSCR +10.0/10.0
- Appreciation +8.6/10.0
- ARV discount +7.5/15.0
- Condition / age +3.8/5.0
- Livability +3.0/5.0
- Rent growth +2.5/5.0
- Schools +1.1/10.0
$85,000
🖨 Deal sheet 📄 Offer letter ✓ Due diligence
Multi-family units
County records classify this as Multi-Family (2-4 Unit). Listing-text estimate: 1 unit. estimate disagrees with records
Listing remarks
Ready to make it your own business space or multifamily living space. It could even become a single family home! Located at 235 Chestnut St. in Louisville, IL, this versatile commercial property offers two separate office spaces, each featuring its own HVAC system, bathroom, and water heater for added convenience and flexibility. The front office includes a kitchenette and dedicated storage room, making it ideal for a variety of business uses. Both spaces are move-in ready while still offering the opportunity to customize and update to fit your business vision and needs. So many possibilities for this property to become your next adventure!
Key facts
- Single family home
- Commercial property
- Hvac system
Tags
Property features AI
Finance
- Other: Located downtown across from Clay County State Bank (directions noted as downtown Louisville); MLS area: Other; Listing status: Active
Exterior
- Parking: Total of about 8 parking spaces (on-street parking); Each unit is associated with 2 parking spaces (2 uncovered per unit)
- Utilities: Public water; Public sewer
- Home design: Residential income property; Built in 1949; Approximately 1,800 total building area
- Construction: Shingle roof; No new construction
- Exterior features: Level lot; Lot dimensions approximately 80 x 84
Interior
- Bedrooms: Each unit has 1 bedroom
- Bathrooms: Each unit has a half bathroom
- Heating & cooling: Forced air heating; Central air conditioning
- Interior features: Two-unit residential income property; No basement
Neighborhood map
What this means for you Summary
Snapshot
- This is a 2-bed/1.0-bath multifamily listed at $85k. Condition is rated good.
Deal economics
- At list price, monthly cash flow is $676 ($8k/yr) — positive.
- The deal already cash-flows at list — no discount required.
- Meets the 1% rule at list price ($2k rent vs $85k).
- Recommended offer: $82k (3.0% below list) — sets the bar for market timing.
Location & tenants
- Location reads 60/100 on livability (#958 in IL) — a middle-class / working-renter tenant base. Strengths: cost of living A+, crime A; Watch: schools F, amenities F, commute F.
- North Clay CUSD 25 (rural): math 12% / reading 13% proficiency, ranked #548 of 620 in IL (top 88%) — low school quality limits family demand, transient renter base, plan for 1-2y turnover.
- Market conditions: 5 active listings in the ZIP; 2 units permitted in Clay County in 2024 (0 in 5+ unit buildings).
Forward outlook
- In year one you build about $7k of equity ($588 loan paydown + $6k appreciation (7.2% local appreciation)).
- Clay County population projected at -23% by 2050 — secular population decline; favor cash flow + early exit over multi-decade hold.
- At projected returns (7.2% appreciation + 3.0% rent growth), your $24k cash investment doubles in ~2 years — after that, you're playing with house money.
- By year 6, paydown + projected appreciation supports a ~$37k cash-out refi (75% LTV) — recoverable capital for the next deal without selling this one.
Negotiation context
- It's been on market 31 days — a 3% lower offer ($82k) is reasonable based on typical stale-listing flexibility.
Risks & watch-outs
- Watch-outs: built in 1949 — expect roof / HVAC / electrical / plumbing capex.
Questions for the listing agent
- It's been on market 31 days. Have you received any prior offers? Is the seller open to a 3% concession, seller financing, or rate buy-down credit?
- Built in 1949 — when were the roof, HVAC, electrical panel, plumbing, and water heater last replaced?
- Is there a deadline driving the sale (1031 exchange, divorce, estate, relocation)? That informs how much negotiation room exists.
- Schools are F-rated, which usually means shorter tenancies and higher turnover. Who's the typical renter profile here, and what's been the actual vacancy rate?
- What's the average days-on-market for RENTAL listings here right now (not sales)? A rising rental-DOM trend means longer vacancies and softer asking-rent achievability than the comps imply.
- What's the recent tenant-quality profile in this submarket — average credit score on applications, eviction rate, late-payment / NSF rate, and stable-employment percentage? A property-management company in the area should have these aggregated.
- How much new apartment / multifamily construction is in the pipeline within 1–3 miles? Heavy new supply (>2% of stock underway) typically softens rents 12–24 months out; light construction supports rent growth.
Investment metrics
- 1% rule
- 1.88% ✓
- Cap rate
- 15.83%
- Cash-on-cash
- 34.07%
- DSCR
- 2.52
- GRM
- 4.4
CMA / ARV
No comps found within radius.
Projected returns pro-forma
7.19% appreciation · 3.0% rent growth · sell at horizon
- IRR
- 46.2%
- Equity multiple
- 4.10×
- Total profit
- $73,741
- Equity at exit
- $59,959
- IRR
- 42.2%
- Equity multiple
- 8.65×
- Total profit
- $182,094
- Equity at exit
- $114,866
Cash invested: $23,800 (down + closing). Projections, not guarantees.
Landlord ↔ Tenant lean methodology
- Overall (STATE)
- 43 Moderately Tenant-Leaning
- State Illinois
- 43 Moderately Tenant-Leaning · D+7
- County
- — inherits STATE
- City
- — inherits STATE
ZIP-level market 62858
- Home prices YoY
- 4.7%
- Active inventory
- 5
- Price-to-rent
- 8.9×
Monthly cashflow live
- Estimated rent
- $1,599 medium interval (Pro) →
- Mortgage (P&I)
- −$446
- Tax est. 1.5%
- −$106 /mo · $1,275/yr
- Insurance
- −$35
- HOA
- −$0
- Vacancy / Maint / Mgmt
- −$336
- Net cashflow
- $676
Break-even live
2-unit breakdown (identical units grouped — click to expand)
| Units | Beds | Baths | Est. rent |
|---|---|---|---|
| 2× units | 0 | 1 | $1,598 |
| #1 | 0 | 1 | $799 |
| #2 | 0 | 1 | $799 |
| Total (2 units) | $1,599 | ||
UW: 25.0% down · 7.5% · 30yr · 1.5% tax · 5.0% vac · 8.0% maint · 8.0% mgmt
Financing live
Cash to close
- Down payment
- $21,250
- Closing costs
- $2,550
- Reserves months
- —
- Total cash needed
- —
Loan-product check · same deal, 3 products live
Conventional
25% down · 7.5% · 30yr
- Down + closing
- —
- Monthly P&I
- —
- Monthly cashflow
- —
- DSCR
- —
- Eligible?
- —
Personal DTI + credit; lowest rate.
DSCR
20% down · 8.5% · 30yr
- Down + closing
- —
- Monthly P&I
- —
- Monthly cashflow
- —
- DSCR
- —
- Eligible?
- —
No personal income docs; deal must DSCR.
Hard money
10% down · 12.0% · 12mo
- Down + closing
- —
- Monthly P&I
- —
- Monthly cashflow
- —
- DSCR
- —
- Eligible?
- —
Short-term bridge; refi at stabilization.
Listing history 16 events
-
2026-06-18days on market $85,000 Active 31 DOM
-
2026-06-17days on market $85,000 Active 30 DOM
-
2026-06-16days on market $85,000 Active 29 DOM
-
2026-06-15days on market $85,000 Active 28 DOM
-
2026-06-13days on market $85,000 Active 26 DOM
-
2026-06-12days on market $85,000 Active 25 DOM
-
2026-06-09days on market $85,000 Active 22 DOM
-
2026-06-08days on market $85,000 Active 21 DOM
-
2026-06-07days on market $85,000 Active 20 DOM
-
2026-06-07days on market $85,000 Active 19 DOM
-
2026-06-04days on market $85,000 Active 16 DOM
-
2026-06-02days on market $85,000 Active 15 DOM
-
2026-06-01days on market $85,000 Active 14 DOM
-
2026-05-31days on market $85,000 Active 13 DOM
-
2026-05-31days on market $85,000 Active 12 DOM
-
2026-05-16$85,000 Active
ⓘ Source: listings_history table (triggers on properties + properties_extension) + one-shot
backfill from property_details.listing_events for pre-trigger history.
Nearby sold comps map
Loading sold comps map…
Walkable amenities ~0.75 mi
Loading nearby amenities…
Taxation est. · year 1
- Rental income
- $19,188
- − Mortgage interest
- −$4,761
- − Property taxes
- −$1,275
- − Insurance
- −$425
- − Repairs & maintenance
- −$1,535
- − Management
- −$1,535
- − Depreciation
- −$2,473
- Taxable income
- $7,184
- Est. tax owed @ 24.0%
- −$1,724
- After-tax cash flow
- $6,385/yr
For passive investors: Depreciation is non-cash, so a rental often shows a tax loss while cash-flowing — sheltering income. Rental losses are passive: they offset passive income freely, and up to $25,000/yr can offset ordinary (W-2) income if you actively participate and your MAGI is under $100k (phasing out to $0 by $150k); unused losses carry forward. On sale, claimed depreciation is recaptured at up to 25%, and gains may owe capital-gains tax (a 1031 exchange can defer both). Figures are a year-1 estimate at your 24.0% rate — not tax advice; consult a CPA.
Condition & rehab AI · 12 photos
This multi-family property is move-in ready with good condition and potential for cosmetic updates to enhance its resale and rental value.
Value-add opportunities
- Both Paint exterior walls — Enhances curb appeal and resale value
- Both Replace carpets — Improves comfort and rental appeal
Renovation cost estimate screening
Value-add ROI direction
- Both Paint exterior walls — Enhances curb appeal and resale value ↑
- Both Replace carpets — Improves comfort and rental appeal ↑
ⓘ Cost ranges are severity-bucket heuristics (US national rule-of-thumb). Get contractor quotes + a written scope before underwriting a rehab budget.
Schools (NCES district)
- District
- North Clay CUSD 25
- NCES district ID
- 1728810
- Math proficiency
- 12% ▼ -6.00%
- Reading proficiency
- 13% ▼ -8.00%
- Median HH income
- $44,677
- Composite
- 11.19/100
- National rank
- #9727
- State rank
- #548 of 620 in IL
Livability — Louisville
- Score
- 60/100
- State rank
- #958
- US rank
- #18656
Category grades
Schools grade is shown separately in the Schools card above.
Census & demographics
- Census place
- Louisville, IL
- Population (ZIP)
- 3,385
Population outlook (Clay County) Hauer SSP2
- Today (2025)
- 12,388 people
- By 2030
- 11,808 · -4.7%
- By 2040
- 10,644 · -14.1%
- By 2050
- 9,500 · -23.3%
- By 2075
- 6,985 · -43.6%
- By 2100
- 4,811 · -61.2%
Race, ethnicity, and origin ACS 2023
- Neighborhood character
- Predominantly White (95%)
- Race & ethnicity
- White 95% Two or more races 2% Hispanic / Latino 2% Black 1%
- Common ancestry
- Iranian 1% Scottish 1%
- Foreign-born
- 0%
- Languages at home
- 97% English-only · Spanish 3%
Political lean MEDSL · Clay
- 2024 margin
- Solid R (+67.3) · D 15.6% · R 82.9% · Other 1.5%
- 2008→2024 swing
- -44.1pp toward R · 2008: -23.3pp · 2024: -67.3pp
- All cycles
- 2024: R+67.3 2020: R+65.2 2016: R+63.6 2012: R+44.1 2008: R+23.3
Not yet ingested
- Civics
- —
Market trends
- HPI YoY
- ▲ 7.19%
- Current HPI
- 158.9107
- Rent YoY
- —
- Metro
- —
- State GDP YoY
- ▲ 1.59%
- F500 in state
- 60
Industry mix (Fortune 500 HQ in IL)
| Industry | F500 HQs | Revenue |
|---|---|---|
| Insurance | 4 | $201B |
|
||
| Consumer Goods | 4 | $87B |
|
||
| Industrial Machinery | 3 | $64B |
|
||
| Healthcare | 2 | $55B |
|
||
| Retail / Pharmacy | 1 | $148B |
|
||
| Agriculture / Food | 1 | $86B |
|
||
Price history
1 event — show timeline
- 2026-05-16 Listed $85,000 RMLSA as Distributed by MLS Grid
Cash-flow waterfall
monthlySold comps — $/sqft
last 12 mo · ≤1 miLoading sold comps…