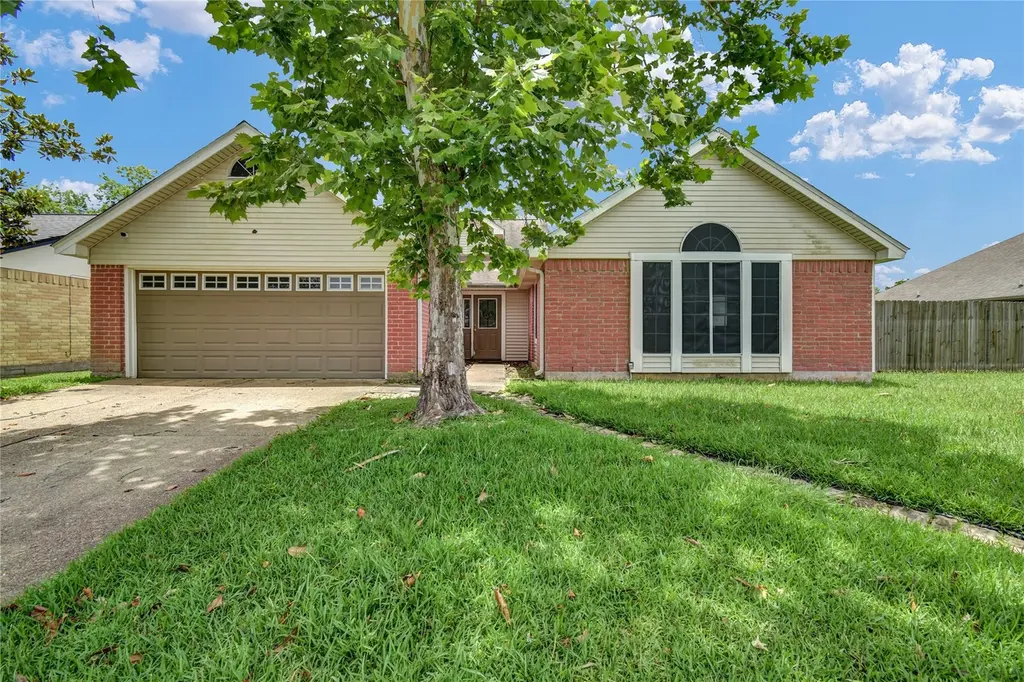
3 Chuckwagon Ct · Angleton, TX
Flood risk 1/10 · Minimal
- FEMA flood zone
- X (unshaded)
- Chance of flooding over 30 yrs
- 0.0%
- Est. flood insurance / yr
- $507 – $1,088
Fire risk 5/10 · Moderate
- Est. fire insurance / yr
- $1,222 – $2,270
Heat risk 10/10 · Severe
- Hot days now (above 111°F)
- 7 days/yr
- Hot days in 30 yrs
- 25 days/yr
Wind risk 9/10 · Severe
- Chance of severe wind over 30 yrs
- 99.0%
Air-quality risk 2/10 · Minimal
- Unhealthy air days now
- 1 days/yr
- Unhealthy air days in 30 yrs
- 1 days/yr
Risk factors via First Street. Map © Google.
Why this score? — see what drove the C+ grade
The composite is a weighted blend of 9 inputs, each scored 0–100. Each bar is that input's sub-score; the figure is the points it added to the 100-point composite (weight × sub-score).
- Cash flow +20.1/30.0
- ARV discount +15.0/15.0
- 1% rule +6.9/10.0
- DSCR +6.4/10.0
- Livability +3.7/5.0
- Schools +3.5/10.0
- Rent growth +2.5/5.0
- Condition / age +2.5/5.0
- Appreciation +0.0/10.0
$205,000
🖨 Deal sheet 📄 Offer letter ✓ Due diligence
Listing remarks MLS
PERFECT LOCATION, WALK TO SCHOOLS, AND FREEDOM PARK, OPEN LIVING, DINING AND BREAKFAST AREA, QUIET DEN OFF KITCHEN, FRENCH DOORS LEADING TO BEAUTIFUL DECK, SUPER LARGE (1/4 ACRE FENCED YARD) MASTER BATH WITH DRESSING AREA AND PRIVATE PATIO FOR MORNING COFFEE, FOUR BEDROOMS DOWN, ONE COULD BE MEDIA ROOM, HAS ELECTRIC SCREEN THAT LETS DOWN, ALONG WITH SPEAKER SYSTEM, BONUS LOFT ROOM, SMALL OFFICE AND HUGE STORAGE CLOSET, WELCOME ENTRY WITH CLOSET, WBFP, LOTS OF STORAGE.
Key facts
- 0.25 acre lot
- 2 garage spots
- Built 1984
Property features AI
Finance
- Other: Seller disclosure available
- HOA & community: Sonora HOA with an annual fee of $275
Exterior
- Parking: Attached 2-car garage
- Utilities: Public water; Public sewer
- Home design: Residential property; Built in 1984; Single-level entry on slab foundation
- Construction: Brick and vinyl siding exterior; Composition roof; Slab foundation
- Exterior features: Subdivision lot
Interior
- Bedrooms: Up to 5 possible bedrooms; Primary/main bedroom located on the first floor
- Bathrooms: 2 full bathrooms
- Heating & cooling: Central heating (electric); Central air conditioning (electric)
- Interior features: One fireplace; Total of 4 rooms
Neighborhood map
What this means for you Summary
Snapshot
- This is a 4-bed/3.0-bath single-family listed at $205k.
Deal economics
- At list price, monthly cash flow is $257 ($3k/yr) — positive.
- The deal already cash-flows at list — no discount required.
- Meets the 1% rule at list price ($2k rent vs $205k).
- Cap rate 7.8% vs local median 4.0% in Angleton — top-decile yield for the area; either an underpriced asset or a hidden risk that comps aren't pricing in. Stress-test before assuming the spread holds.
Location & tenants
- Location reads 74/100 on livability (#171 in TX, #4,520 nationally) — a middle-class / working-renter tenant base. Strengths: cost of living A+, housing A+, employment A-; Watch: amenities F, commute F.
- Angleton ISD (suburban): math 36% / reading 44% proficiency, ranked #375 of 826 in TX (top 45%) — families likely to look elsewhere, expect single-tenant / working-renter base with shorter leases.
- Zoned schools: Rancho Isabella El (math 42% / reading 47%, grade F, #1,155 of 4,322 statewide, top 29%, 418 students, 68% FRL); Angleton J H School (math 26% / reading 41%, grade F, #911 of 1,662 statewide, top 56%, 1,561 students, 68% FRL); Angleton H S (math 22% / reading 45%, grade F, #1,011 of 1,632 statewide, top 63%, 2,066 students, 67% FRL).
- Market conditions: 921 active listings in the ZIP; 2 comparable units currently listed for rent nearby; solid renter incomes; 3,960 units permitted in Brazoria County in 2024 (593 in 5+ unit buildings).
- This rent runs 33% of the median local income ($89k/yr) — at the standard rent-burdened threshold; future hikes will face affordability resistance.
Forward outlook
- Local home prices are declining (-3.0%/yr); year-one equity from $1k of loan paydown is wiped out by about $6k of value loss. Plan a longer hold.
- Brazoria County population projected at +44% by 2050 — long-run rental-demand tailwind backs the buy-and-hold thesis.
Negotiation context
- Only 8 days on market — expect competitive offers; lowballing is unlikely to land.
- 3 sale attempts since 12y ago with the ask held roughly flat each time — persistent listings suggest the price (not the market) is what's stuck; bring a comps-based counter.
Risks & watch-outs
- Watch-outs: property tax is 2.8% of price.
- Climate carrying-cost: severe wind risk, 99% chance of damaging wind over 30y; moderate wildfire risk; extreme-heat days projected 7→25/yr by 2055 (HVAC capex compounding) — expect insurance premiums to compound above CPI over the hold.
Questions for the listing agent
- Property tax is high relative to price — has the assessment been appealed recently, and will the sale trigger a re-assessment?
- What does the HOA fee cover, when was the last increase, and are there any pending special assessments or reserve-fund shortfalls?
- Is there a deadline driving the sale (1031 exchange, divorce, estate, relocation)? That informs how much negotiation room exists.
- Schools are D-rated, which usually means shorter tenancies and higher turnover. Who's the typical renter profile here, and what's been the actual vacancy rate?
- What's the average days-on-market for RENTAL listings here right now (not sales)? A rising rental-DOM trend means longer vacancies and softer asking-rent achievability than the comps imply.
- What's the recent tenant-quality profile in this submarket — average credit score on applications, eviction rate, late-payment / NSF rate, and stable-employment percentage? A property-management company in the area should have these aggregated.
- How much new for-sale + rental construction is in the pipeline within 1–3 miles? Heavy new supply typically softens prices + rents 12–24 months out; constrained supply supports both.
Investment metrics
- 1% rule
- 1.19% ✓
- Cap rate
- 7.80%
- Cash-on-cash
- 5.37%
- DSCR
- 1.24
- GRM
- 7.0
CMA / ARV
- ARV (on-the-fly)
- $337,659
- Comps found
- 12
Show comp detail 12 sales within ~0.75 mi
| Address | Dist | Beds/Ba | Sqft | Sold | Price | $/sf | Match |
|---|---|---|---|---|---|---|---|
| 829 Greystone Ln | 0.55mi | 4/3.0 | 2,300 (+0%) | 6mo | $361,400 | $157 | 69 |
| 110 Kelly St | 0.66mi | 4/2.5 | 2,267 (-1%) | 1mo | $260,360 | $115 | 64 |
| 1508 N Blue Bonnet Ln | 0.40mi | 4/2.5 | 2,477 (+8%) | 3mo | $450,000 | $182 | 64 |
| 18 Keystone Ct | 0.64mi | 3/3.0 (-1) | 2,316 (+1%) | 4mo | $355,900 | $154 | 61 |
| 7 Keystone Ct | 0.59mi | 4/2.0 | 2,202 (-4%) | 4mo | $357,400 | $162 | 58 |
| 640 Greystone Ln | 0.72mi | 4/2.0 | 2,320 (+1%) | 3mo | $350,400 | $151 | 58 |
| 1523 Windrose Bnd | 0.74mi | 4/2.5 | 2,388 (+4%) | 1mo | $299,500 | $125 | 56 |
| 117 Lasso St | 0.44mi | 4/3.0 | 1,957 (-15%) | 6mo | $239,900 | $123 | 49 |
| 16 Keystone Ct | 0.62mi | 4/2.0 | 2,500 (+9%) | 4mo | $360,900 | $144 | 49 |
| 6 Keystone Ct | 0.60mi | 4/2.0 | 2,557 (+11%) | 5mo | $360,400 | $141 | 45 |
| 644 Greystone Ln | 0.71mi | 4/2.0 | 2,557 (+11%) | 2mo | $360,400 | $141 | 42 |
| 1506 Windrose Bnd | 0.71mi | 3/2.5 (-1) | 1,963 (-14%) | 6mo | $289,000 | $147 | 31 |
Match score weights: distance 35% · size 25% · config 20% · recency 20%. Top-matched comps best support the ARV.
Projected returns pro-forma
-3.0% appreciation · 3.0% rent growth · sell at horizon
- IRR
- -7.9%
- Equity multiple
- 0.71×
- Total profit
- $-16,669
- Equity at exit
- $30,566
- IRR
- 1.8%
- Equity multiple
- 1.13×
- Total profit
- $7,326
- Equity at exit
- $17,725
Cash invested: $57,400 (down + closing). Projections, not guarantees.
Landlord ↔ Tenant lean methodology
- Overall (STATE)
- 87 Strongly Landlord-Friendly
- State Texas
- 87 Strongly Landlord-Friendly · R+5
- County
- — inherits STATE
- City
- — inherits STATE
ZIP-level market 77515
- Home prices YoY
- -5.1%
- Active inventory
- 921
- Price-to-rent
- 7.0×
Monthly cashflow live
- Estimated rent
- $2,436 medium interval (Pro) →
- Mortgage (P&I)
- −$1,075
- Tax from tax record
- −$484 /mo · $5,809/yr
- Insurance
- −$85
- HOA
- −$23
- Vacancy / Maint / Mgmt
- −$512
- Net cashflow
- $257
Break-even live
UW: 25.0% down · 7.5% · 30yr · 1.5% tax · 5.0% vac · 8.0% maint · 8.0% mgmt
Financing live
Cash to close
- Down payment
- $51,250
- Closing costs
- $6,150
- Reserves months
- —
- Total cash needed
- —
Loan-product check · same deal, 3 products live
Conventional
25% down · 7.5% · 30yr
- Down + closing
- —
- Monthly P&I
- —
- Monthly cashflow
- —
- DSCR
- —
- Eligible?
- —
Personal DTI + credit; lowest rate.
DSCR
20% down · 8.5% · 30yr
- Down + closing
- —
- Monthly P&I
- —
- Monthly cashflow
- —
- DSCR
- —
- Eligible?
- —
No personal income docs; deal must DSCR.
Hard money
10% down · 12.0% · 12mo
- Down + closing
- —
- Monthly P&I
- —
- Monthly cashflow
- —
- DSCR
- —
- Eligible?
- —
Short-term bridge; refi at stabilization.
Rent comps 2 comps
| Address | Beds | Baths | Sqft | Rent | $/sqft | DOM | Units | Dist |
|---|---|---|---|---|---|---|---|---|
| 513 Robin St Angleton, TX | 4.0 | 2.0 | 1900 | $2,495 | $1.31 | 22d | 1 | 0.90mi |
| 3606 Atlas Point Ln Angleton, TX | 3.0 | 2.0 | 1876 | $2,250 | $1.20 | 1d | 1 | 1.33mi |
HOA detail
- Monthly dues
- $23 · $276/yr
- Likely covers
- electric
Listing history 6 events
-
2026-06-18days on market $205,000 Active 8 DOM
-
2026-06-17days on market $205,000 Active 7 DOM
-
2026-06-16days on market $205,000 Active 6 DOM
-
2026-06-15days on market $205,000 Active 5 DOM
-
2026-06-13remarks 662-char remark
-
2026-06-13$205,000 Active 3 DOM
ⓘ Source: listings_history table (triggers on properties + properties_extension) + one-shot
backfill from property_details.listing_events for pre-trigger history.
Tax reassessment forecast TX · Resets to sale price
- Current annual tax
- $5,809 · $484/mo
- Projected year-2 tax
- $5,809 · $484/mo
- Expected delta
- $0/yr ($0/mo · 0.0%)
ⓘ Screening estimate from a state-policy table — verify with the county assessor before closing.
Climate risk First Street
- Flood 1/10 Low FEMA zone X (unshaded) · 0% chance over 30 yrs
- Wildfire 5/10 Major
- Heat 10/10 Extreme 7 d/yr ≥111°F today · 25 d/yr by 30 yrs out
- Wind 9/10 Extreme 99% chance of damaging wind over 30 yrs
- Air quality 2/10 Low 1 unhealthy d/yr today · 1 by 30 yrs out
Nearby sold comps map
Loading sold comps map…
Walkable amenities ~0.75 mi
Loading nearby amenities…
Taxation est. · year 1
- Rental income
- $29,232
- − Mortgage interest
- −$11,483
- − Property taxes
- −$5,809
- − Insurance
- −$1,025
- − Repairs & maintenance
- −$2,339
- − Management
- −$2,339
- − HOA
- −$276
- − Depreciation
- −$5,964
- Taxable loss
- −$2
- Est. tax savings @ 24.0%
- +$1
- After-tax cash flow
- $3,083/yr
For passive investors: Depreciation is non-cash, so a rental often shows a tax loss while cash-flowing — sheltering income. Rental losses are passive: they offset passive income freely, and up to $25,000/yr can offset ordinary (W-2) income if you actively participate and your MAGI is under $100k (phasing out to $0 by $150k); unused losses carry forward. On sale, claimed depreciation is recaptured at up to 25%, and gains may owe capital-gains tax (a 1031 exchange can defer both). Figures are a year-1 estimate at your 24.0% rate — not tax advice; consult a CPA.
Schools (NCES district)
- District
- Angleton ISD
- NCES district ID
- 4808310
- Math proficiency
- 36% ▼ -8.00%
- Reading proficiency
- 44% ▲ 1.00%
- Median HH income
- $55,670
- Composite
- 35.01/100
- National rank
- #5046
- State rank
- #375 of 826 in TX
Livability — Angleton
- Score
- 74/100
- State rank
- #171
- US rank
- #4520
Category grades
Schools grade is shown separately in the Schools card above.
Census & demographics
- Census place
- Angleton, TX
- County
- Brazoria County · 374,982 people
- City population
- 34,088
- Metro
- Houston-The Woodlands-Sugar Land, TX
- Population (ZIP)
- 34,088
- Household income
- $88,787
- Rent vs Own
- Severe rent burden
- 785.0
Population outlook (Brazoria County) Hauer SSP2
- Today (2025)
- 420,414 people
- By 2030
- 457,585 · +8.8%
- By 2040
- 532,232 · +26.6%
- By 2050
- 605,399 · +44.0%
- By 2075
- 779,358 · +85.4%
- By 2100
- 883,759 · +110.2%
Race, ethnicity, and origin ACS 2023
- Neighborhood character
- Diverse neighborhood (Simpson 0.58)
- Race & ethnicity
- White 55% Hispanic / Latino 33% Two or more races 18% Black 8% Asian 2%
- Hispanic origin (detail)
- Mexican 28%
- Common ancestry
- Lithuanian 3% Romanian 2% Slovak 1%
- Foreign-born
- 8% · Canada, Vietnam
- Languages at home
- 78% English-only · Spanish 20% Other Asian/Pacific 1%
Political lean MEDSL · Brazoria
- 2024 margin
- R (+19.7) · D 39.5% · R 59.2% · Other 1.3%
- 2008→2024 swing
- +9.9pp toward D · 2008: -29.6pp · 2024: -19.7pp
- All cycles
- 2024: R+19.7 2020: R+18.2 2016: R+24.6 2012: R+34.2 2008: R+29.6
Not yet ingested
- Civics
- —
Market trends
- HPI YoY
- ▼ -15.59%
- Current HPI
- 288.7286
- Rent YoY
- —
- Metro
- Houston-The Woodlands-Sugar Land, TX
- State GDP YoY
- ▲ 3.95%
- F500 in state
- 110
Industry mix (Fortune 500 HQ in TX)
| Industry | F500 HQs | Revenue |
|---|---|---|
| Energy | 16 | $1,198B |
|
||
| Technology | 5 | $198B |
|
||
| Engineering / Construction | 4 | $72B |
|
||
| Energy Services | 3 | $60B |
|
||
| Utilities | 3 | $41B |
|
||
| Healthcare | 2 | $330B |
|
||
Price history
+18.8% since first listed7 events — show timeline
- 2026-06-10 Listed $205,000 HARMLS
- 2014-11-12 Listing Removed — HARMLS
- 2014-10-09 Sold (Public Records) — Public Records
- 2014-10-08 Sold (MLS) — BCBR
- 2014-09-05 Listed $172,500 HARMLS
- 2014-05-12 Listed $172,500 BCBR
- 2001-05-14 Sold (Public Records) — Public Records
Property tax history
+1.7%/yrLatest (2025): $5,809 · -0.8% YoY. Source: county tax records.
Cash-flow waterfall
monthlySold comps — $/sqft
last 12 mo · ≤1 miLoading sold comps…