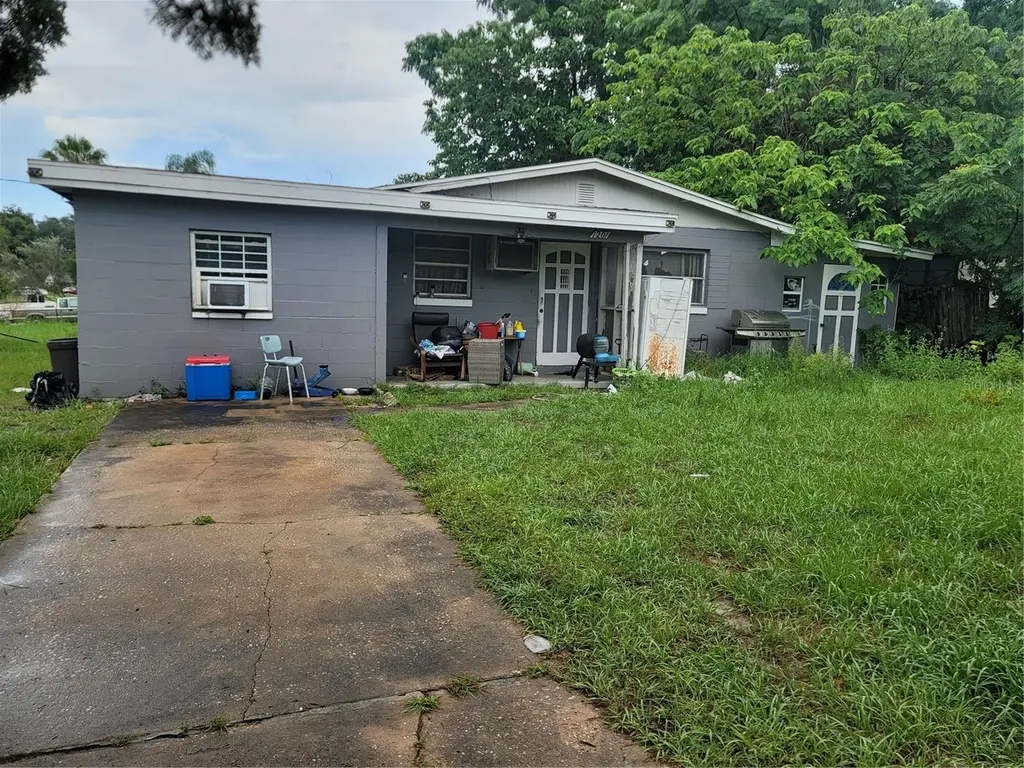
1201 Gay St · Forest City, FL
Flood risk 1/10 · Minimal
- FEMA flood zone
- X (unshaded)
- Chance of flooding over 30 yrs
- 0.0%
- Est. flood insurance / yr
- $507 – $1,088
Fire risk 1/10 · Minimal
- Est. fire insurance / yr
- $947 – $1,759
Heat risk 9/10 · Severe
- Hot days now (above 108°F)
- 7 days/yr
- Hot days in 30 yrs
- 22 days/yr
Wind risk 9/10 · Severe
- Chance of severe wind over 30 yrs
- 99.0%
Air-quality risk 2/10 · Minimal
- Unhealthy air days now
- 1 days/yr
- Unhealthy air days in 30 yrs
- 1 days/yr
Risk factors via First Street. Map © Google.
Why this score? — see what drove the B grade
The composite is a weighted blend of 9 inputs, each scored 0–100. Each bar is that input's sub-score; the figure is the points it added to the 100-point composite (weight × sub-score).
- Cash flow +28.3/30.0
- ARV discount +15.0/15.0
- DSCR +10.0/10.0
- 1% rule +6.5/10.0
- Schools +5.1/10.0
- Livability +3.9/5.0
- Condition / age +2.5/5.0
- Rent growth +1.8/5.0
- Appreciation +0.0/10.0
$175,000
🖨 Deal sheet (PDF) 📄 Offer letter ✓ Due diligence
Listing remarks
New Roof 2022, Solar System 2022, New Electric Panel 2022. Home is located in a nice quiet area with a corner lot. Redesign the interior and upgrade the home just the way you want and you will end up with a 3/2.5 that will amaze your friends. The home currently is set up with a 2/1.5 as the main home. Upon entering that section of the home you enter the living room with views of the kitchen and dining areas. Down the short hall is a full bath. At the rear of the home are two bedrooms. The room on the left has a half bath attached. Use one of the closets in the hall to add Central air with exposed ducts, add a mini split system, or upgrade the window units. There is an opening the living ro
Key facts
- Half bath
- New electric panel
- Full bath
Tags
Property features AI
Finance
- Other: Lot approximately 0.19 acres
- Financial info: No lease restrictions; Property zoned R-1
- HOA & community: No HOA
Exterior
- Parking: No parking details provided
- Utilities: Public water; Septic tank; Electricity connected; Water connected
- Home design: Single family residence; One-story; West-facing; Homestead exempt
- Construction: Block construction; Built-up and shingle roof; Slab foundation; Built in 1 story
- Exterior features: Chain link fencing; Asphalt road access
Interior
- Kitchen: Refrigerator; Electric water heater
- Bedrooms: 3 bedrooms
- Flooring: Ceramic tile; Concrete; Linoleum
- Bathrooms: 2 full bathrooms; 1 half bathroom
- Heating & cooling: No central heating; Wall/window air conditioning units
- Interior features: Living room and dining room combined
- Laundry & utility: Laundry located outside
Neighborhood map
What this means for you Summary
Snapshot
- This is a 3-bed/1.5-bath single-family listed at $175k.
Deal economics
- At list price, monthly cash flow is $562 ($7k/yr) — positive.
- The deal already cash-flows at list — no discount required.
- Meets the 1% rule at list price ($2k rent vs $175k).
- Cap rate 10.1% vs local median 3.5% in Forest City — top-decile yield for the area; either an underpriced asset or a hidden risk that comps aren't pricing in. Stress-test before assuming the spread holds.
Location & tenants
- Location reads 78/100 on livability (#175 in FL, #2,657 nationally) — a middle-class / working-renter tenant base. Strengths: schools A+, crime A+, housing A+; Watch: amenities F, commute F.
- Seminole (suburban): math 57% / reading 61% proficiency, ranked #13 of 73 in FL (top 18%) — acceptable for families but not a draw, mixed tenant base, ~2y average lease.
- Market conditions: Rents soft (-2.8%/yr); 573 active listings in the ZIP; 37 comparable units currently listed for rent nearby; rentals at typical pace (median 16d on market — plan ~3-4 weeks tenant-placement turnaround); 1,979 units permitted in Seminole County in 2024 (1,191 in 5+ unit buildings).
- This rent runs 33% of the median local income ($73k/yr) — at the standard rent-burdened threshold; future hikes will face affordability resistance.
Forward outlook
- Local home prices are declining (-3.0%/yr); year-one equity from $1k of loan paydown is wiped out by about $5k of value loss. Plan a longer hold.
- Seminole County population projected at +24% by 2050 — long-run rental-demand tailwind backs the buy-and-hold thesis.
Negotiation context
- Only 2 days on market — expect competitive offers; lowballing is unlikely to land.
- Current owner paid $49k; list at $175k implies a 257% gain — meaningful room to come down on a strong offer.
Risks & watch-outs
- Climate carrying-cost: severe wind risk, 99% chance of damaging wind over 30y; extreme-heat days projected 7→22/yr by 2055 (HVAC capex compounding) — expect insurance premiums to compound above CPI over the hold.
Questions for the listing agent
- Built in 1960 — when were the roof, HVAC, electrical panel, plumbing, and water heater last replaced?
- Is there a deadline driving the sale (1031 exchange, divorce, estate, relocation)? That informs how much negotiation room exists.
- Schools are A-rated — typically a magnet for longer-tenancy family renters. What's the average tenant stay here, and is there a school-zone premium baked into asking?
- What's the average days-on-market for RENTAL listings here right now (not sales)? A rising rental-DOM trend means longer vacancies and softer asking-rent achievability than the comps imply.
- What's the recent tenant-quality profile in this submarket — average credit score on applications, eviction rate, late-payment / NSF rate, and stable-employment percentage? A property-management company in the area should have these aggregated.
- How much new for-sale + rental construction is in the pipeline within 1–3 miles? Heavy new supply typically softens prices + rents 12–24 months out; constrained supply supports both.
Investment metrics
- 1% rule
- 1.15% ✓
- Cap rate
- 10.15%
- Cash-on-cash
- 13.76%
- DSCR
- 1.61
- GRM
- 7.3
CMA / ARV
- ARV (on-the-fly)
- $337,502
- Comps found
- 12
Show comp detail 12 sales within ~0.75 mi
| Address | Dist | Beds/Ba | Sqft | Sold | Price | $/sf | Match |
|---|---|---|---|---|---|---|---|
| 1204 Marie Ave | 0.08mi | 3/1.5 | 1,326 (-1%) | 9mo | $310,000 | $234 | 88 |
| 1203 Marie Ave | 0.05mi | 4/1.5 (+1) | 1,294 (-3%) | 0mo | $320,000 | $247 | 87 |
| 1201 Bear Lake Rd | 0.35mi | 3/2.0 | 1,300 (-2%) | 4mo | $367,000 | $282 | 74 |
| 4050 Mcneil Rd | 0.36mi | 3/2.0 | 1,249 (-6%) | 4mo | $435,000 | $348 | 67 |
| 3507 Curtis Dr | 0.50mi | 3/2.0 | 1,402 (+5%) | 2mo | $330,000 | $235 | 64 |
| 1003 Bear Lake Rd | 0.45mi | 3/2.0 | 1,302 (-2%) | 12mo | $335,000 | $257 | 63 |
| 3827 Anna Dr | 0.04mi | 3/1.5 | 1,136 (-15%) | 13mo | $311,000 | $274 | 63 |
| 3534 Shirley Dr | 0.42mi | 3/2.0 | 1,452 (+9%) | 4mo | $285,000 | $196 | 60 |
| 1016 Martex Dr | 0.70mi | 3/2.0 | 1,350 (+1%) | 12mo | $341,000 | $253 | 54 |
| 806 Bear Lake Rd | 0.57mi | 3/2.0 | 1,506 (+13%) | 9mo | $350,000 | $232 | 42 |
| 580 Quail Ave | 0.70mi | 3/2.0 | 1,155 (-13%) | 6mo | $319,000 | $276 | 38 |
| 531 1st Ave | 0.74mi | 3/2.0 | 1,160 (-13%) | 10mo | $285,000 | $246 | 34 |
Match score weights: distance 35% · size 25% · config 20% · recency 20%. Top-matched comps best support the ARV.
Projected returns pro-forma
-3.0% appreciation · 0.0% rent growth · sell at horizon
- IRR
- 0.8%
- Equity multiple
- 1.03×
- Total profit
- $1,479
- Equity at exit
- $26,093
- IRR
- 7.5%
- Equity multiple
- 1.50×
- Total profit
- $24,337
- Equity at exit
- $15,131
Cash invested: $49,000 (down + closing). Projections, not guarantees.
Landlord ↔ Tenant lean methodology
- Overall (STATE)
- 87 Strongly Landlord-Friendly
- State Florida
- 87 Strongly Landlord-Friendly · R+3
- County
- — inherits STATE
- City
- — inherits STATE
ZIP-level market 32703
- Rents YoY
- -2.8%
- Active inventory
- 573
- Price-to-rent
- 7.3×
Monthly cashflow live
- Estimated rent
- $2,004 high interval (Pro) →
- Mortgage (P&I)
- −$918
- Tax from tax record
- −$30 /mo · $364/yr
- Insurance
- −$73
- HOA
- −$0
- Vacancy / Maint / Mgmt
- −$421
- Net cashflow
- $562
Break-even live
Sensitivity live
| Price | -10% $661 | -5% $612 | +0% $562 | +5% $313 | +10% $253 |
|---|---|---|---|---|---|
| Rent | -10% $404 | -5% $483 | +0% $562 | +5% $641 | +10% $720 |
| Rate | -1.0pp $650 | -0.5pp $607 | base $562 | +0.5pp $517 | +1.0pp $471 |
UW: 25.0% down · 7.5% · 30yr · 1.5% tax · 5.0% vac · 8.0% maint · 8.0% mgmt
Financing live
Cash to close
- Down payment
- $43,750
- Closing costs
- $5,250
- Reserves months
- —
- Total cash needed
- —
Loan-product check · same deal, 3 products live
Conventional
25% down · 7.5% · 30yr
- Down + closing
- —
- Monthly P&I
- —
- Monthly cashflow
- —
- DSCR
- —
- Eligible?
- —
Personal DTI + credit; lowest rate.
DSCR
20% down · 8.5% · 30yr
- Down + closing
- —
- Monthly P&I
- —
- Monthly cashflow
- —
- DSCR
- —
- Eligible?
- —
No personal income docs; deal must DSCR.
Hard money
10% down · 12.0% · 12mo
- Down + closing
- —
- Monthly P&I
- —
- Monthly cashflow
- —
- DSCR
- —
- Eligible?
- —
Short-term bridge; refi at stabilization.
Rent comps 37 comps
| Address | Beds | Baths | Sqft | Rent | $/sqft | DOM | Units | Dist |
|---|---|---|---|---|---|---|---|---|
| 4018 Bonnie Dr Apopka, FL | 2.0 | 2.0 | 943 | $1,700 | $1.80 | 24d | 1 | 0.12mi |
| 1224 Helen St Apopka, FL | 3.0 | 2.0 | 1551 | $2,395 | $1.54 | 11d | 1 | 0.17mi |
| 700 Post Lake Pl Apopka, FL | 3.0 | 1.0–2.0 | 945 | $2,156 | $2.28 | 2d | 50 | 0.32mi |
| 1337 Lake Asher Cir Apopka, FL | 3.0 | 2.0 | 1483 | $2,500 | $1.69 | 22d | 1 | 0.47mi |
| 1193 Bunnell Rd Altamonte Springs, FL | 3.0 | 2.0 | 1292 | $2,195 | $1.70 | 24d | 1 | 0.69mi |
| 1147 Magnolia Dr Altamonte Springs, FL | 4.0 | 2.0 | 1646 | $2,245 | $1.36 | 24d | 1 | 0.69mi |
| 155 N Pearl Lake Cswy #200 Altamonte Springs, FL | 2.0 | 2.0 | 1053 | $1,545 | $1.47 | 15d | 1 | 0.74mi |
| 238 Afton Sq #207 Altamonte Springs, FL | 2.0 | 2.0 | 968 | $1,350 | $1.39 | 5d | 1 | 0.79mi |
| 208 Afton Sq #208 Altamonte Springs, FL | 2.0 | 2.0 | 962 | $1,500 | $1.56 | 18d | 1 | 0.84mi |
| 208 Afton Sq Altamonte Springs, FL | 1.0–2.0 | 1.0–2.0 | 757 | $1,500 | $1.98 | 4d | 2 | 0.84mi |
| 232 Afton Sq Altamonte Springs, FL | 1.0–2.0 | 1.0 | 794 | $1,567 | $1.97 | 20d | 2 | 0.85mi |
| 651 Northbridge Dr Unit 651 Altamonte Springs, FL | 3.0 | 2.5 | 1590 | $2,000 | $1.26 | 24d | 1 | 0.89mi |
| 563 Northbridge Dr Altamonte Springs, FL | 3.0 | 2.5 | 1365 | $1,950 | $1.43 | 18d | 1 | 0.90mi |
| 3067 E Windchime Cir Apopka, FL | 3.0 | 2.0 | 1415 | $1,590 | $1.12 | 18d | 1 | 0.94mi |
| 1227 Pendleton Dr Altamonte Springs, FL | 3.0 | 2.0 | 1540 | $2,400 | $1.56 | 24d | 1 | 1.00mi |
| 1064 Lotus Pkwy #934 Altamonte Springs, FL | 2.0 | 2.0 | 1001 | $1,795 | $1.79 | 3d | 1 | 1.03mi |
| 588 Brantley Terrace Way Altamonte Springs, FL | 3.0 | 2.0 | 1309 | $1,875 | $1.43 | 24d | 2 | 1.03mi |
| 1054 Lotus Cove Ct #612 Altamonte Springs, FL | 2.0 | 2.0 | 1001 | $1,795 | $1.79 | 3d | 1 | 1.05mi |
| 520 Terraceview Cv Altamonte Springs, FL | 1.0–3.0 | 1.0–2.0 | 1015 | $2,134 | $2.10 | 2d | 26 | 1.15mi |
| 9434 Bear Lake Rd Forest City, FL | 3.0 | 2.0 | 1074 | $3,500 | $3.26 | 5d | 1 | 1.19mi |
| 545 Nantucket Ct Altamonte Springs, FL | 2.0 | 2.0 | 1140 | $1,396 | $1.22 | 13d | 4 | 1.20mi |
| 958 Salt Pond Pl #103 Altamonte Springs, FL | 2.0 | 2.0 | 982 | $1,525 | $1.55 | 5d | 1 | 1.21mi |
| 958 Salt Pond Pl Altamonte Springs, FL | 2.0 | 2.0 | 1000 | $1,420 | $1.42 | 15d | 2 | 1.21mi |
| 956 Salt Pond Pl Altamonte Springs, FL | 2.0 | 2.0 | 1019 | $1,475 | $1.45 | 13d | 2 | 1.22mi |
| 951 Salt Pond Pl #201 Altamonte Springs, FL | 2.0 | 2.0 | 1019 | $1,400 | $1.37 | 3d | 1 | 1.26mi |
| 951 Salt Pond Pl Unit 1304 Altamonte Springs, FL | 2.0 | 2.0 | 1019 | $1,450 | $1.42 | 24d | 1 | 1.26mi |
| 37 Hollow Branch Rd Apopka, FL | 3.0 | 2.0 | 1835 | $2,395 | $1.31 | 18d | 1 | 1.27mi |
| 3000 Foxhill Cir Apopka, FL | 1.0–3.0 | 1.0–2.5 | 1208 | $2,236 | $1.85 | 2d | 23 | 1.28mi |
| 820 Camargo Way #207 Altamonte Springs, FL | 2.0 | 2.0 | 1209 | $1,500 | $1.24 | 13d | 1 | 1.29mi |
| 823 Camargo Way #104 Altamonte Springs, FL | 2.0 | 2.0 | 990 | $1,750 | $1.77 | 18d | 1 | 1.29mi |
| 826 Camargo Way Unit 5-104 Altamonte Springs, FL | 2.0 | 2.0 | 990 | $1,650 | $1.67 | 24d | 1 | 1.30mi |
| 637 Buoy Ln Altamonte Springs, FL | 2.0 | 2.0 | 1019 | $1,475 | $1.45 | 24d | 2 | 1.33mi |
| 642 Dory Ln #203 Altamonte Springs, FL | 2.0 | 2.0 | 1019 | $1,475 | $1.45 | 5d | 1 | 1.35mi |
| 832 Camargo Way #105 Altamonte Springs, FL | 3.0 | 2.0 | 1209 | $1,800 | $1.49 | 3d | 1 | 1.35mi |
| 831 Camargo Way Altamonte Springs, FL | 2.0 | 2.0 | 1155 | $1,700 | $1.47 | 4d | 2 | 1.38mi |
| 831 Camargo Way Altamonte Springs, FL | 2.0 | 2.0 | 1102 | $1,700 | $1.54 | 22d | 1 | 1.38mi |
| 801 Ravens Cir Altamonte Springs, FL | 1.0–3.0 | 1.0–2.0 | 884 | $1,686 | $1.91 | 5d | 8 | 1.45mi |
Listing history 3 events
-
2026-06-18days on market $175,000 Active 2 DOM
-
2026-06-17remarks 699-char remark
-
2026-06-17$175,000 Active 1 DOM
ⓘ Source: listings_history table (triggers on properties + properties_extension) + one-shot
backfill from property_details.listing_events for pre-trigger history.
Tax reassessment forecast FL · Resets to sale price
- Current annual tax
- $364 · $30/mo
- Projected year-2 tax
- $1,452 · $121/mo
- Expected delta
- +$1,088/yr (+$91/mo · 298.6%)
ⓘ Screening estimate from a state-policy table — verify with the county assessor before closing.
Climate risk First Street
- Flood 1/10 Low FEMA zone X (unshaded) · 0% chance over 30 yrs
- Wildfire 1/10 Low
- Heat 9/10 Extreme 7 d/yr ≥108°F today · 22 d/yr by 30 yrs out
- Wind 9/10 Extreme 99% chance of damaging wind over 30 yrs
- Air quality 2/10 Low 1 unhealthy d/yr today · 1 by 30 yrs out
Nearby sold comps map
Loading sold comps map…
Walkable amenities ~0.75 mi
Loading nearby amenities…
Taxation est. · year 1
- Rental income
- $24,046
- − Mortgage interest
- −$9,803
- − Property taxes
- −$364
- − Insurance
- −$875
- − Repairs & maintenance
- −$1,924
- − Management
- −$1,924
- − Depreciation
- −$5,091
- Taxable income
- $4,065
- Est. tax owed @ 24.0%
- −$976
- After-tax cash flow
- $5,768/yr
For passive investors: Depreciation is non-cash, so a rental often shows a tax loss while cash-flowing — sheltering income. Rental losses are passive: they offset passive income freely, and up to $25,000/yr can offset ordinary (W-2) income if you actively participate and your MAGI is under $100k (phasing out to $0 by $150k); unused losses carry forward. On sale, claimed depreciation is recaptured at up to 25%, and gains may owe capital-gains tax (a 1031 exchange can defer both). Figures are a year-1 estimate at your 24.0% rate — not tax advice; consult a CPA.
Schools (NCES district)
- District
- Seminole
- NCES district ID
- 1201710
- Math proficiency
- 57% ▼ -7.00%
- Reading proficiency
- 61% ▼ -1.00%
- Median HH income
- $58,478
- Composite
- 51.05/100
- National rank
- #1769
- State rank
- #13 of 73 in FL
Livability — Forest City
- Score
- 78/100
- State rank
- #175
- US rank
- #2657
Category grades
Schools grade is shown separately in the Schools card above.
Census & demographics
- Census place
- Forest City, FL
- County
- Orange County · 1,471,359 people
- Metro
- Orlando-Kissimmee-Sanford, FL
- Population (ZIP)
- 59,269
- Household income
- $72,880
- Rent vs Own
- Severe rent burden
- 2191.0
Population outlook (Seminole County) Hauer SSP2
- Today (2025)
- 515,494 people
- By 2030
- 545,713 · +5.9%
- By 2040
- 598,068 · +16.0%
- By 2050
- 640,663 · +24.3%
- By 2075
- 724,461 · +40.5%
- By 2100
- 755,530 · +46.6%
Race, ethnicity, and origin ACS 2023
- Neighborhood character
- Highly diverse neighborhood (Simpson 0.71)
- Race & ethnicity
- White 35% Hispanic / Latino 30% Black 28% Two or more races 16% Asian 3%
- Hispanic origin (detail)
- Mexican 6% Puerto Rican 12% Cuban 3% Dominican 2%
- Common ancestry
- Hispanic 4% Romanian 1% Italian 1%
- Foreign-born
- 18% · Canada, Jamaica, Vietnam
- Languages at home
- 71% English-only · Spanish 22% French/Haitian/Cajun 3% Other Indo-European 1%
Political lean MEDSL · Seminole
- 2024 margin
- Toss-up / Even · D 47.6% · R 51.1% · Other 1.3%
- 2008→2024 swing
- -0.8pp no change · 2008: -2.8pp · 2024: -3.5pp
- All cycles
- 2024: R+3.5 2020: D+2.8 2016: R+1.6 2012: R+6.5 2008: R+2.8
Not yet ingested
- Civics
- —
Market trends
- HPI YoY
- ▼ -206.30%
- Current HPI
- 319.2139
- Rent YoY
- ▼ -2.75%
- Metro
- Orlando-Kissimmee-Sanford, FL
- State GDP YoY
- ▲ 3.28%
- F500 in state
- 36
Industry mix (Fortune 500 HQ in FL)
| Industry | F500 HQs | Revenue |
|---|---|---|
| Industrial Technology | 2 | $29B |
|
||
| Insurance | 2 | $17B |
|
||
| Retail | 1 | $60B |
|
||
| Technology Distribution | 1 | $58B |
|
||
| Homebuilding | 1 | $35B |
|
||
| Technology Manufacturing | 1 | $35B |
|
||
Price history
+877.7% since first listed3 events — show timeline
- 2026-06-16 Listed $175,000 Stellar MLS as Distributed by MLS Grid
- 1997-05-13 Sold (Public Records) $49,000 Public Records
- 1973-01-01 Sold (Public Records) $17,900 Public Records
Property tax history
+2.5%/yrLatest (2025): $364 · -43.9% YoY. Source: county tax records.
Cash-flow waterfall
monthlySold comps — $/sqft
last 12 mo · ≤1 miLoading sold comps…