 Duplex
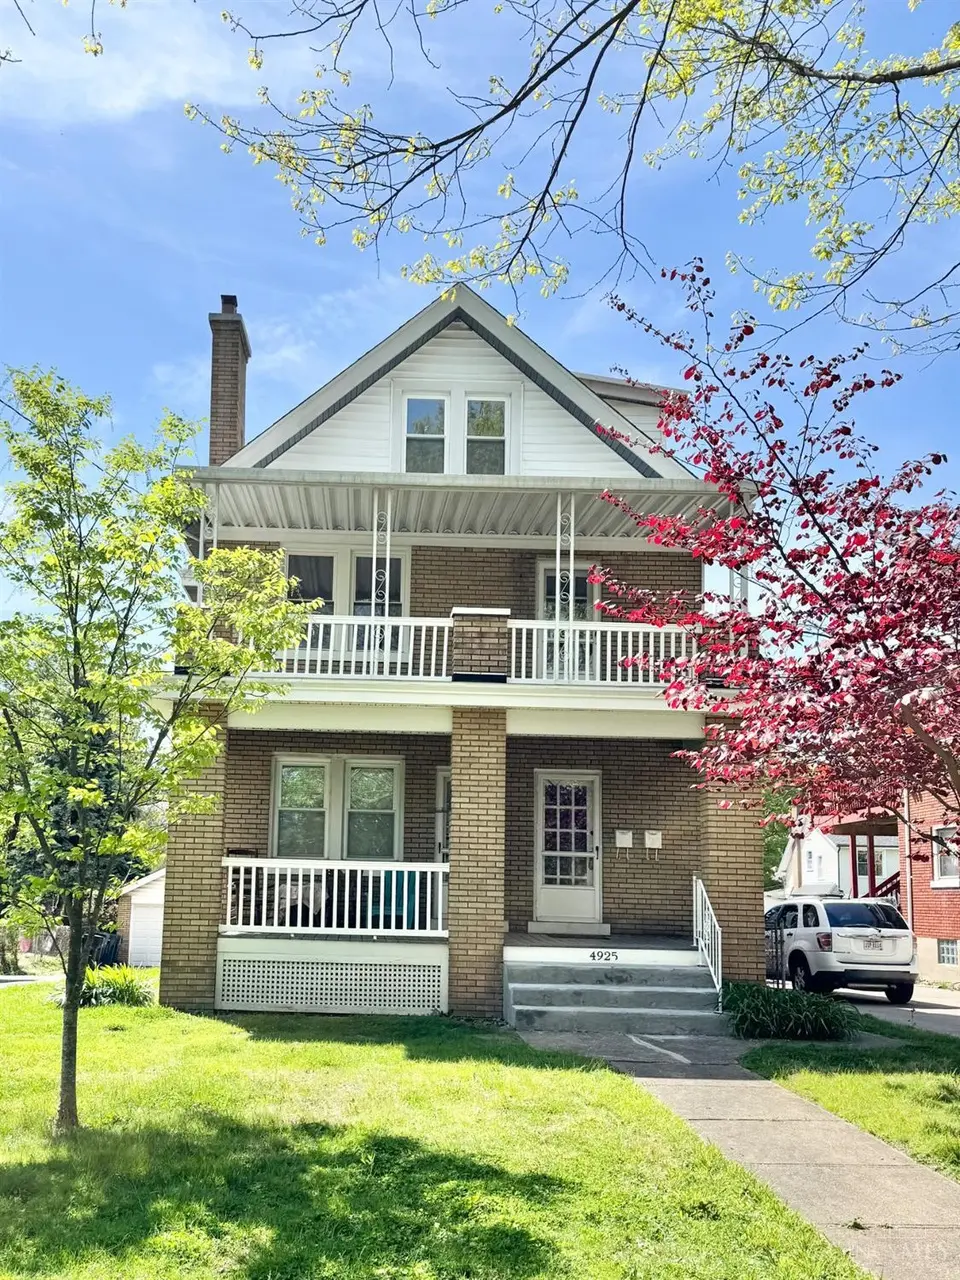
4925 Ralph Ave · Cincinnati, OH
Flood risk 1/10 · Minimal
- FEMA flood zone
- X (unshaded)
- Chance of flooding over 30 yrs
- 0.0%
- Est. flood insurance / yr
- $473 – $860
Fire risk 1/10 · Minimal
- Est. fire insurance / yr
- $713 – $1,323
Heat risk 4/10 · Minor
- Hot days now (above 103°F)
- 7 days/yr
- Hot days in 30 yrs
- 19 days/yr
Wind risk 2/10 · Minimal
- Chance of severe wind over 30 yrs
- 1.0%
Air-quality risk 3/10 · Minor
- Unhealthy air days now
- 3 days/yr
- Unhealthy air days in 30 yrs
- 5 days/yr
Risk factors via First Street. Map © Google.
Why this score? — see what drove the D- grade
The composite is a weighted blend of 9 inputs, each scored 0–100. Each bar is that input's sub-score; the figure is the points it added to the 100-point composite (weight × sub-score).
- Cash flow +14.8/30.0
- DSCR +4.5/10.0
- Livability +4.0/5.0
- 1% rule +3.9/10.0
- Rent growth +3.7/5.0
- Schools +2.5/10.0
- Condition / age +2.5/5.0
- ARV discount +0.0/15.0
- Appreciation +0.0/10.0
$299,900
🖨 Deal sheet (PDF) 📄 Offer letter ✓ Due diligence
Multi-family units
County records classify this as Multi-Family (2-4 Unit). Listing-text estimate: 2 units. confirmed
Listing remarks
Stately and Solid full brick 2 family on gorgeous tree lined street in the heart of the Covedale Garden District! Meticulously maintained and updated thruout! 2 car garage w/ elec & new floor! Newer windows / Composite decks / Newer Vinyl railings and dormers! Roof approx 5 years / all knob & tube & cast iron replaced! New box gutters! New Chimney liners & chimney crown/cap! 1 bedroom apartment on first floor and 3 bedrooms on 2nd/3rd floor plus extra study on 3rd floor! Refin hardwood floors & carpet! Newer water heaters & Separate furnaces! Glass Block! 2 garage door openers and Full front porches for both units!
Key facts
- New vinyl railings
- Full brick
- New box gutters
Tags
Property features AI
Finance
- Other: Total buildings on site: 1
- Financial info: Two rental units total: a 1-bedroom (approx. 900) renting for $825 and a 3+ bedroom (approx. 1,350) renting for $1,400; First-floor unit is occupied month-to-month; second unit vacant
Exterior
- Parking: Detached 2-car garage; Approximately 4 open parking spaces; Parking includes garage and lot spaces
- Utilities: Public water; Public sewer; Natural gas
- Home design: Duplex; Three or more levels; Zoned for multi-family
- Construction: Brick construction; Shingle roof; Poured foundation; Windows with vinyl frames; Built in multiple levels
- Exterior features: Deck; Porch; Two fireplaces; Lot dimensions approximately 50 x 135
Interior
- Kitchen: No kitchen appliance details provided
- Bedrooms: One 1-bedroom unit; One 3+ bedroom unit
- Bathrooms: Each unit has one full bathroom
- Heating & cooling: Forced air gas heating; Window unit cooling; Heat paid by tenant; Owner pays water
- Interior features: Full basement; Two fireplaces (gas; one inoperable); Second floor area listed separately
- Laundry & utility: Separate furnace for units; Gas service separate for units
Neighborhood map
What this means for you Summary
Snapshot
- This is a 1×2bd/1.0ba + 1×3bd/1.0ba units multifamily listed at $300k.
Deal economics
- At list price, monthly cash flow is $81 ($974/yr) — positive. Per door: $41/mo.
- The deal already cash-flows at list — no discount required.
- To meet the 1% rule (rent ≥ 1% of price), the offer needs to be $268k (10.7% below list).
- Recommended offer: $268k (10.7% below list) — sets the bar for 1% rule.
- Cap rate 6.6% vs local median 3.9% in Cincinnati — top-decile yield for the area; either an underpriced asset or a hidden risk that comps aren't pricing in. Stress-test before assuming the spread holds.
Location & tenants
- Location reads 80/100 on livability (#130 in OH, #1,856 nationally) — a professional / high-income tenant draw. Strengths: amenities A+, commute A+, cost of living A+; Watch: employment D, crime F.
- Cincinnati Public Schools (urban): math 25% / reading 36% proficiency, ranked #581 of 656 in OH (top 89%) — families likely to look elsewhere, expect single-tenant / working-renter base with shorter leases; 70% free/reduced lunch — lower-income household profile, screen leases tightly.
- Zoned schools: Roberts Academy (math 16% / reading 22%, grade F, #1,320 of 1,584 statewide, top 83%, 765 students, 0% FRL); Hartwell School (math 17% / reading 31%, grade F, #593 of 654 statewide, top 91%, 447 students, 0% FRL); Walnut Hills High School (math 79% / reading 89%, grade A, #17 of 781 statewide, top 2%, 2,582 students, 14% FRL) — zoned schools average 5% FRL vs 70% district-wide (66 pts lower); this property's tenant base skews higher-income than the district average.
- Market conditions: Rents rising fast (+4.9%/yr); 78 active listings in the ZIP; 6 comparable units currently listed for rent nearby; rentals at typical pace (median 19d on market — plan ~3-4 weeks tenant-placement turnaround); 801 units permitted in Hamilton County in 2024 (190 in 5+ unit buildings).
- At $2,678/mo this rent would consume 48% of the median local household income ($66k/yr) (locally 2012% of renters already pay >50% of income on rent) — very limited rent-growth headroom before tenants either downsize or default.
Forward outlook
- Local home prices are declining (-3.0%/yr); year-one equity from $2k of loan paydown is wiped out by about $9k of value loss. Plan a longer hold.
Negotiation context
- It's been on market 60 days — a 3% lower offer ($291k) is reasonable based on typical stale-listing flexibility.
- 2 sale attempts with the ask held roughly flat each time — persistent listings suggest the price (not the market) is what's stuck; bring a comps-based counter.
- Current owner paid $65k; list at $300k implies a 361% gain — meaningful room to come down on a strong offer.
Risks & watch-outs
- Watch-outs: built in 1928 — expect roof / HVAC / electrical / plumbing capex.
Questions for the listing agent
- It's been on market 60 days. Have you received any prior offers? Is the seller open to a 11% concession, seller financing, or rate buy-down credit?
- Can we see the unit-by-unit rent roll, current vacancy, and any below-market leases? What's the average tenancy length?
- What capital expenditures (roof, boiler, parking lot, exteriors) have been made in the last 5 years, and what's planned in the next 2?
- Built in 1928 — when were the roof, HVAC, electrical panel, plumbing, and water heater last replaced?
- Is there a deadline driving the sale (1031 exchange, divorce, estate, relocation)? That informs how much negotiation room exists.
- Schools are B-rated — typically a magnet for longer-tenancy family renters. What's the average tenant stay here, and is there a school-zone premium baked into asking?
- Crime grade is F in this area — have there been break-ins, vandalism, or insurance claims at this property in the last 3 years? What carrier currently insures it and at what premium?
- The area grade is low — what's the realistic commute time and amenity access for the typical tenant pool here? Any planned neighborhood developments (good or bad) we should know about?
- What's the average days-on-market for RENTAL listings here right now (not sales)? A rising rental-DOM trend means longer vacancies and softer asking-rent achievability than the comps imply.
- What's the recent tenant-quality profile in this submarket — average credit score on applications, eviction rate, late-payment / NSF rate, and stable-employment percentage? A property-management company in the area should have these aggregated.
- How much new apartment / multifamily construction is in the pipeline within 1–3 miles? Heavy new supply (>2% of stock underway) typically softens rents 12–24 months out; light construction supports rent growth.
Investment metrics
- 1% rule
- 0.89% ✗
- Cap rate
- 6.62%
- Cash-on-cash
- 1.16%
- DSCR
- 1.05
- GRM
- 9.3
CMA / ARV
- ARV (on-the-fly)
- $224,400
- Comps found
- 9
Show comp detail 9 sales within ~0.75 mi
| Address | Dist | Beds/Ba | Sqft | Sold | Price | $/sf | Match |
|---|---|---|---|---|---|---|---|
| 5020 Sidney Rd | 0.27mi | 6/2.5 (+1) | 2,106 (-4%) | 9mo | $278,000 | $132 | 67 |
| 1686 Kellywood Ave | 0.26mi | 4/2.0 (-1) | 2,048 (-7%) | 13mo | $262,500 | $128 | 58 |
| 1136 Betty Ln | 0.38mi | 4/2.0 (-1) | 2,402 (+9%) | 8mo | $260,000 | $108 | 53 |
| 5214 Sidney Rd | 0.59mi | 4/2.0 (-1) | 2,214 (+1%) | 16mo | $205,000 | $93 | 51 |
| 1131 Rulison Ave | 0.36mi | 4/2.0 (-1) | 2,321 (+6%) | 20mo | $360,000 | $155 | 51 |
| 1629 Pasadena Ave | 0.64mi | 6/2.0 (+1) | 2,184 (-1%) | 20mo | $58,000 | $27 | 45 |
| 1155 Rulison Ave | 0.31mi | 5/2.0 | 1,904 (-14%) | 22mo | $195,000 | $102 | 43 |
| 5028 Rapid Run Rd | 0.64mi | 4/2.0 (-1) | 2,090 (-5%) | 21mo | $142,000 | $68 | 37 |
| 1031 Lockman Ave | 0.63mi | 4/2.0 (-1) | 2,369 (+8%) | 23mo | $165,025 | $70 | 32 |
Match score weights: distance 35% · size 25% · config 20% · recency 20%. Top-matched comps best support the ARV.
Projected returns pro-forma
-3.0% appreciation · 4.87% rent growth · sell at horizon
- IRR
- -12.4%
- Equity multiple
- 0.54×
- Total profit
- $-38,279
- Equity at exit
- $44,716
- IRR
- -0.8%
- Equity multiple
- 0.94×
- Total profit
- $-4,726
- Equity at exit
- $25,930
Cash invested: $83,972 (down + closing). Projections, not guarantees.
Landlord ↔ Tenant lean methodology
- Overall (STATE)
- 73 Landlord-Friendly
- State Ohio
- 73 Landlord-Friendly · R+6
- County
- — inherits STATE
- City
- — inherits STATE
ZIP-level market 45238
- Rents YoY
- 4.9%
- Active inventory
- 78
- Price-to-rent
- 19.9×
Monthly cashflow live
- Estimated rent
- $2,678 high interval (Pro) →
- Mortgage (P&I)
- −$1,573
- Tax from tax record
- −$337 /mo · $4,042/yr
- Insurance
- −$125
- HOA
- −$0
- Vacancy / Maint / Mgmt
- −$562
- Net cashflow
- $81
Break-even live
Sensitivity live
| Price | -10% $251 | -5% $166 | +0% $81 | +5% $-4 | +10% $-89 |
|---|---|---|---|---|---|
| Rent | -10% $-130 | -5% $-25 | +0% $81 | +5% $187 | +10% $293 |
| Rate | -1.0pp $232 | -0.5pp $157 | base $81 | +0.5pp $3 | +1.0pp $-76 |
2-unit breakdown (identical units grouped — click to expand)
| Units | Beds | Baths | Est. rent |
|---|---|---|---|
| 1× unit | 2 | 1 | $1,253 |
| 1× unit | 3 | 1 | $1,426 |
| Total (2 units) | $2,678 | ||
UW: 25.0% down · 7.5% · 30yr · 1.5% tax · 5.0% vac · 8.0% maint · 8.0% mgmt
Financing live
Cash to close
- Down payment
- $74,975
- Closing costs
- $8,997
- Reserves months
- —
- Total cash needed
- —
Loan-product check · same deal, 3 products live
Conventional
25% down · 7.5% · 30yr
- Down + closing
- —
- Monthly P&I
- —
- Monthly cashflow
- —
- DSCR
- —
- Eligible?
- —
Personal DTI + credit; lowest rate.
DSCR
20% down · 8.5% · 30yr
- Down + closing
- —
- Monthly P&I
- —
- Monthly cashflow
- —
- DSCR
- —
- Eligible?
- —
No personal income docs; deal must DSCR.
Hard money
10% down · 12.0% · 12mo
- Down + closing
- —
- Monthly P&I
- —
- Monthly cashflow
- —
- DSCR
- —
- Eligible?
- —
Short-term bridge; refi at stabilization.
Rent comps 6 comps
| Address | Beds | Baths | Sqft | Rent | $/sqft | DOM | Units | Dist |
|---|---|---|---|---|---|---|---|---|
| 5408 Style Ln Cincinnati, OH | 4.0 | 1.5 | 1824 | $2,625 | $1.44 | 3d | 1 | 1.09mi |
| 943 Rosemont Ave Cincinnati, OH | 5.0 | 1.5 | 2132 | $1,700 | $0.80 | 18d | 1 | 1.21mi |
| 1311 Manss Ave Cincinnati, OH | 4.0 | 1.0 | 1409 | $1,295 | $0.92 | 6d | 1 | 1.29mi |
| 905 Suire Ave Unit 2 Cincinnati, OH | 4.0 | 1.0 | 1699 | $1,400 | $0.82 | 25d | 1 | 1.31mi |
| 1620 Minion Ave Cincinnati, OH | 4.0 | 2.0 | 1845 | $1,550 | $0.84 | 22d | 1 | 1.41mi |
| 862 Academy Ave Unit 2 Cincinnati, OH | 4.0 | 1.0 | 1627 | $1,450 | $0.89 | 18d | 1 | 1.46mi |
Listing history 19 events
-
2026-06-21days on market $299,900 Active 60 DOM
-
2026-06-18days on market $299,900 Active 57 DOM
-
2026-06-17days on market $299,900 Active 56 DOM
-
2026-06-16days on market $299,900 Active 55 DOM
-
2026-06-15days on market $299,900 Active 54 DOM
-
2026-06-13days on market $299,900 Active 52 DOM
-
2026-06-13statusdays on market $299,900 Active 51 DOM
-
2026-06-09days on market $299,900 Contingency Pending 48 DOM
-
2026-06-08days on market $299,900 Contingency Pending 47 DOM
-
2026-06-07days on market $299,900 Contingency Pending 46 DOM
-
2026-06-03days on market $299,900 Contingency Pending 42 DOM
-
2026-06-02statusdays on market $299,900 Contingency Pending 41 DOM
-
2026-06-01days on market $299,900 Active 40 DOM
-
2026-05-31days on market $299,900 Active 39 DOM
-
2026-05-01status Active
-
2026-04-30historical Contingency Pending
-
2026-04-21$299,900 Active
-
1988-08-31soldstatus $65,000
-
1980-07-01soldstatus $52,000
ⓘ Source: listings_history table (triggers on properties + properties_extension) + one-shot
backfill from property_details.listing_events for pre-trigger history.
Tax reassessment forecast OH · Partial reset (capped growth)
- Current annual tax
- $4,042 · $337/mo
- Projected year-2 tax
- $4,360 · $363/mo
- Expected delta
- +$318/yr (+$27/mo · 7.9%)
ⓘ Screening estimate from a state-policy table — verify with the county assessor before closing.
Climate risk First Street
- Flood 1/10 Low FEMA zone X (unshaded) · 0% chance over 30 yrs
- Wildfire 1/10 Low
- Heat 4/10 Moderate 7 d/yr ≥103°F today · 19 d/yr by 30 yrs out
- Wind 2/10 Low 100% chance of damaging wind over 30 yrs
- Air quality 3/10 Moderate 3 unhealthy d/yr today · 5 by 30 yrs out
Nearby sold comps map
Loading sold comps map…
Walkable amenities ~0.75 mi
Loading nearby amenities…
Taxation est. · year 1
- Rental income
- $32,136
- − Mortgage interest
- −$16,799
- − Property taxes
- −$4,042
- − Insurance
- −$1,500
- − Repairs & maintenance
- −$2,571
- − Management
- −$2,571
- − Depreciation
- −$8,724
- Taxable loss
- −$4,070
- Est. tax savings @ 24.0%
- +$977
- After-tax cash flow
- $1,951/yr
For passive investors: Depreciation is non-cash, so a rental often shows a tax loss while cash-flowing — sheltering income. Rental losses are passive: they offset passive income freely, and up to $25,000/yr can offset ordinary (W-2) income if you actively participate and your MAGI is under $100k (phasing out to $0 by $150k); unused losses carry forward. On sale, claimed depreciation is recaptured at up to 25%, and gains may owe capital-gains tax (a 1031 exchange can defer both). Figures are a year-1 estimate at your 24.0% rate — not tax advice; consult a CPA.
Schools (NCES district)
- District
- Cincinnati Public Schools
- NCES district ID
- 3904375
- Math proficiency
- 25% ▼ -19.00%
- Reading proficiency
- 36% ▼ -14.00%
- Median HH income
- $35,743
- Composite
- 25.21/100
- National rank
- #7508
- State rank
- #581 of 656 in OH
Livability — Cincinnati
- Score
- 80/100
- State rank
- #130
- US rank
- #1856
Category grades
Schools grade is shown separately in the Schools card above.
Census & demographics
- Census place
- Cincinnati, OH
- County
- Hamilton County · 701,295 people
- City population
- 505,555
- Metro
- Cincinnati, OH-KY-IN
- Population (ZIP)
- 48,351
- Household income
- $66,277
- Rent vs Own
- Severe rent burden
- 2012.0
Population outlook (Hamilton County) Hauer SSP2
- Today (2025)
- 826,054 people
- By 2030
- 830,947 · +0.6%
- By 2040
- 832,319 · +0.8%
- By 2050
- 822,428 · -0.4%
- By 2075
- 788,688 · -4.5%
- By 2100
- 710,674 · -14.0%
Race, ethnicity, and origin ACS 2023
- Neighborhood character
- Majority White (64%)
- Race & ethnicity
- White 64% Black 28% Two or more races 6% Hispanic / Latino 3%
- Common ancestry
- Italian 2% Lithuanian 2% Slovak 1%
- Foreign-born
- 10% · Canada
- Languages at home
- 88% English-only · French/Haitian/Cajun 4% Spanish 2% German/W. Germanic 1%
Political lean MEDSL · Hamilton
- 2024 margin
- D (+14.9) · D 57.0% · R 42.1%
- 2008→2024 swing
- +7.9pp toward D · 2008: 7.0pp · 2024: 14.9pp
- All cycles
- 2024: D+14.9 2020: D+15.9 2016: D+9.5 2012: D+4.9 2008: D+7.0
Not yet ingested
- Civics
- —
Market trends
- HPI YoY
- ▼ -197.57%
- Current HPI
- 213.5097
- Rent YoY
- ▲ 4.87%
- Metro
- Cincinnati, OH-KY-IN
- State GDP YoY
- ▲ 1.98%
- F500 in state
- 48
Industry mix (Fortune 500 HQ in OH)
| Industry | F500 HQs | Revenue |
|---|---|---|
| Insurance | 3 | $145B |
|
||
| Industrial Machinery | 3 | $49B |
|
||
| Financial Services | 3 | $24B |
|
||
| Consumer Goods | 2 | $93B |
|
||
| Aerospace / Defense | 2 | $47B |
|
||
| Utilities | 2 | $33B |
|
||
Price history
+476.7% since first listed5 events — show timeline
- 2026-05-01 Relisted — Cincy MLS
- 2026-04-30 Contingent — Cincy MLS
- 2026-04-21 Listed $299,900 Cincy MLS
- 1988-08-31 Sold (Public Records) $65,000 Public Records
- 1980-07-01 Sold (Public Records) $52,000 Public Records
Property tax history
+6.4%/yrLatest (2025): $4,042 · +0.1% YoY. Source: county tax records.
Cash-flow waterfall
monthlySold comps — $/sqft
last 12 mo · ≤1 miLoading sold comps…