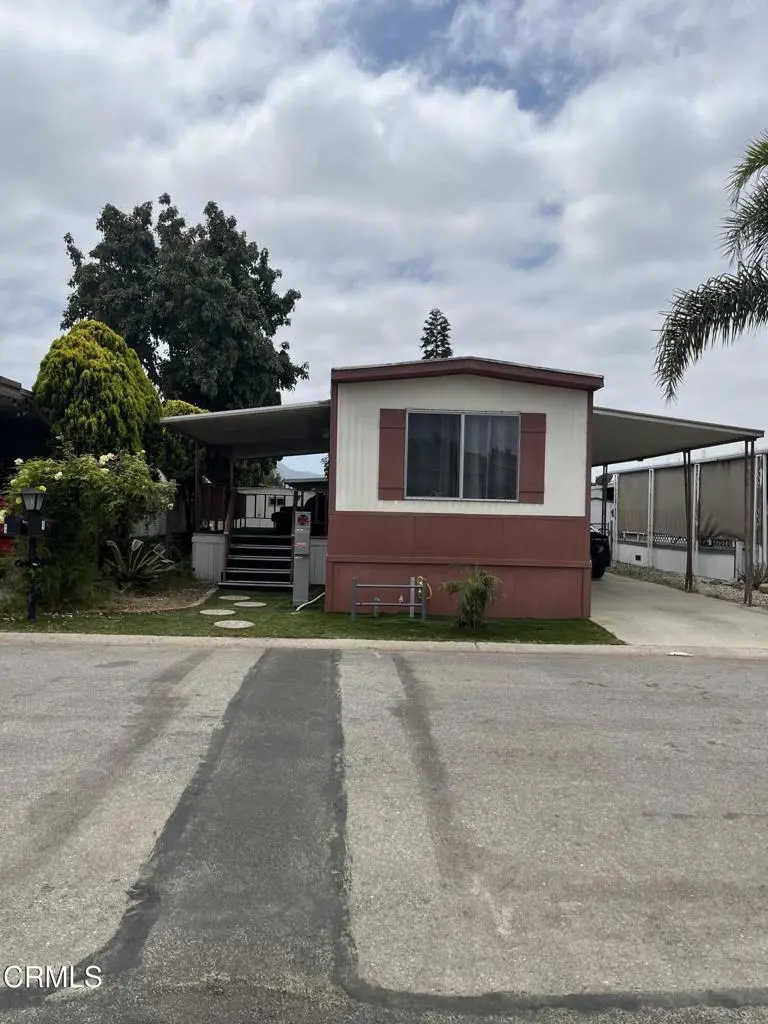
42 Calle Paradora St #42 · Camarillo, CA
Flood risk 1/10 · Minimal
- FEMA flood zone
- X (unshaded)
- Chance of flooding over 30 yrs
- 0.0%
- Est. flood insurance / yr
- $507 – $1,088
Fire risk 4/10 · Minor
- Est. fire insurance / yr
- $659 – $1,223
Heat risk 4/10 · Minor
- Hot days now (above 94°F)
- 7 days/yr
- Hot days in 30 yrs
- 18 days/yr
Wind risk 1/10 · Minimal
- Chance of severe wind over 30 yrs
- —
Air-quality risk 3/10 · Minor
- Unhealthy air days now
- 4 days/yr
- Unhealthy air days in 30 yrs
- 4 days/yr
Risk factors via First Street. Map © Google.
Why this score? — see what drove the B+ grade
The composite is a weighted blend of 9 inputs, each scored 0–100. Each bar is that input's sub-score; the figure is the points it added to the 100-point composite (weight × sub-score).
- Cash flow +30.0/30.0
- ARV discount +15.0/15.0
- 1% rule +10.0/10.0
- DSCR +10.0/10.0
- Schools +4.6/10.0
- Livability +3.9/5.0
- Rent growth +2.8/5.0
- Condition / age +2.5/5.0
- Appreciation +0.0/10.0
$90,000
🖨 Deal sheet 📄 Offer letter ✓ Due diligence
Listing remarks MLS
This charming single wide mobile home also includes an updated kitchen with newer vinyl flooring, freshly painted cabinets, new sink, newer furnace, spacious primary suite, 2 storage sheds, and low maintenance yard with turf and drought resistant landscaping. Located in the Lamplighter all ages community next to Village at the Park sports fields and parks with quick access to the 101 Fwy. The community features pool and spa for added fun. You won't want to miss this prime location. Land lease is $1800 a month.
Key facts
- Low maintenance yard
- Large closets
- Swimming pool
Tags
Property features AI
Finance
- Other: Community features include biking and a dog park; Pets allowed with breed restrictions; cats OK
- Financial info: Monthly land lease: $2,075 (park-provided)
- HOA & community: Located in Lamplighter Manufactured Home Park; Park requires manager approval; Monthly land lease paid to park
Exterior
- Parking: Two total parking spaces; Two carport spaces
- Security: Carbon monoxide detector(s); Smoke detector; Security lights
- Utilities: Standard electric; Public sewer; District/public water
- Home design: Single (mobile) home, model 'Madison'; Single-story; Mobile home remains on site; Mobile dimensions approx. 12 ft x 60 ft
- Construction: Year built per public records
- Exterior features: Patio; Private pool that is fenced, heated, and above ground; Two sheds on property; No fencing around lot; Sprinklers: none; Paved road access
Interior
- Kitchen: Gas cooktop; Gas oven; Microwave; Refrigerator; Dishwasher; Laminate counters
- Bedrooms: All bedrooms on main level
- Bathrooms: 1 full bathroom with bathtub and shower-in-tub and bathroom closet
- Heating & cooling: Natural gas heating
- Interior features: One-level home; Entry up five steps; Laminate counters; Above-ground spa; Carbon monoxide and smoke detectors; Security lights
- Laundry & utility: Has laundry
Neighborhood map
What this means for you Summary
Snapshot
- This is a 2-bed/1.0-bath manufactured listed at $90k.
Deal economics
- At list price, monthly cash flow is $2k ($22k/yr) — positive.
- The deal already cash-flows at list — no discount required.
- Meets the 1% rule at list price ($3k rent vs $90k).
- Cap rate 30.7% vs local median 2.5% in Camarillo — top-decile yield for the area; either an underpriced asset or a hidden risk that comps aren't pricing in. Stress-test before assuming the spread holds.
Location & tenants
- Location reads 78/100 on livability (#72 in CA, #2,776 nationally) — a middle-class / working-renter tenant base. Strengths: amenities A+, commute A+, employment A+; Watch: cost of living F.
- Pleasant Valley (urban): math 43% / reading 57% proficiency, ranked #119 of 517 in CA (top 23%) — acceptable for families but not a draw, mixed tenant base, ~2y average lease; only 20% free/reduced lunch — higher-income household profile.
- Zoned schools: Rancho Rosal Elementary (math 37% / reading 48%, grade F, #552 of 1,571 statewide, top 35%, 576 students, 33% FRL).
- Market conditions: Rents rising (+1.2%/yr); 160 active listings in the ZIP; 7 comparable units currently listed for rent nearby; rentals leasing fast (median 2d on market — plan ~1-2 weeks tenant-placement turnaround); high-income renter base; 1,759 units permitted in Ventura County in 2024 (1,196 in 5+ unit buildings).
Forward outlook
- Local home prices are declining (-3.0%/yr); year-one equity from $622 of loan paydown is wiped out by about $3k of value loss. Plan a longer hold.
- Ventura County population projected at +4% by 2050 — modest demand growth; plan on rents tracking national, not racing it.
- At projected returns (-3.0% appreciation + 1.2% rent growth), your $25k cash investment doubles in ~2 years — after that, you're playing with house money.
Negotiation context
- Only 10 days on market — expect competitive offers; lowballing is unlikely to land.
- 5 sale attempts since 15y ago; this cycle's ask has dropped $35k (28%) from the opening price — seller is motivated, your offer sets the floor, not the list.
Questions for the listing agent
- Built in 1976 — when were the roof, HVAC, electrical panel, plumbing, and water heater last replaced?
- Is there a deadline driving the sale (1031 exchange, divorce, estate, relocation)? That informs how much negotiation room exists.
- Schools are B-rated — typically a magnet for longer-tenancy family renters. What's the average tenant stay here, and is there a school-zone premium baked into asking?
- What's the average days-on-market for RENTAL listings here right now (not sales)? A rising rental-DOM trend means longer vacancies and softer asking-rent achievability than the comps imply.
- What's the recent tenant-quality profile in this submarket — average credit score on applications, eviction rate, late-payment / NSF rate, and stable-employment percentage? A property-management company in the area should have these aggregated.
- How much new for-sale + rental construction is in the pipeline within 1–3 miles? Heavy new supply typically softens prices + rents 12–24 months out; constrained supply supports both.
Investment metrics
- 1% rule
- 3.45% ✓
- Cap rate
- 30.72%
- Cash-on-cash
- 87.22%
- DSCR
- 4.88
- GRM
- 2.4
CMA / ARV
- ARV (on-the-fly)
- $159,120
- Comps found
- 1
Show comp detail 1 sale within ~0.75 mi
| Address | Dist | Beds/Ba | Sqft | Sold | Price | $/sf | Match |
|---|---|---|---|---|---|---|---|
| 21 Via Rosal Unit . | 0.06mi | 2/2.0 | 720 (0%) | 24mo | $159,000 | $221 | 73 |
Match score weights: distance 35% · size 25% · config 20% · recency 20%. Top-matched comps best support the ARV.
Projected returns pro-forma
-3.0% appreciation · 1.22% rent growth · sell at horizon
- IRR
- 85.7%
- Equity multiple
- 4.84×
- Total profit
- $96,657
- Equity at exit
- $13,419
- IRR
- 88.5%
- Equity multiple
- 9.45×
- Total profit
- $212,934
- Equity at exit
- $7,782
Cash invested: $25,200 (down + closing). Projections, not guarantees.
Landlord ↔ Tenant lean methodology
- Overall (STATE)
- 18 Strongly Tenant-Friendly
- State California
- 18 Strongly Tenant-Friendly · D+13
- County
- — inherits STATE
- City
- — inherits STATE
ZIP-level market 93012
- Rents YoY
- 1.2%
- Active inventory
- 160
- Price-to-rent
- 2.4×
Monthly cashflow live
- Estimated rent
- $3,106 high interval (Pro) →
- Mortgage (P&I)
- −$472
- Tax est. 1.5%
- −$112 /mo · $1,350/yr
- Insurance
- −$38
- HOA
- −$0
- Vacancy / Maint / Mgmt
- −$652
- Net cashflow
- $1,832
Break-even live
UW: 25.0% down · 7.5% · 30yr · 1.5% tax · 5.0% vac · 8.0% maint · 8.0% mgmt
Financing live
Cash to close
- Down payment
- $22,500
- Closing costs
- $2,700
- Reserves months
- —
- Total cash needed
- —
Loan-product check · same deal, 3 products live
Conventional
25% down · 7.5% · 30yr
- Down + closing
- —
- Monthly P&I
- —
- Monthly cashflow
- —
- DSCR
- —
- Eligible?
- —
Personal DTI + credit; lowest rate.
DSCR
20% down · 8.5% · 30yr
- Down + closing
- —
- Monthly P&I
- —
- Monthly cashflow
- —
- DSCR
- —
- Eligible?
- —
No personal income docs; deal must DSCR.
Hard money
10% down · 12.0% · 12mo
- Down + closing
- —
- Monthly P&I
- —
- Monthly cashflow
- —
- DSCR
- —
- Eligible?
- —
Short-term bridge; refi at stabilization.
Rent comps 7 comps
| Address | Beds | Baths | Sqft | Rent | $/sqft | DOM | Units | Dist |
|---|---|---|---|---|---|---|---|---|
| 313 Westpark Ct Camarillo, CA | 2.0 | 1.0–1.5 | 838 | $3,225 | $3.85 | 1d | 2 | 0.73mi |
| 3065 Village At the Park Dr Camarillo, CA | 1.0–2.0 | 1.0–2.0 | 753 | $3,095 | $4.11 | 1d | 4 | 0.76mi |
| 5176 Verdugo Way Camarillo, CA | 2.0 | 1.0–2.0 | 844 | $4,077 | $4.83 | 1d | 221 | 0.98mi |
| 1571 Flynn Rd Camarillo, CA | 3.0 | 1.0–2.0 | 1081 | $3,475 | $3.21 | 1d | 1 | 1.26mi |
| 2400 Pickwick Dr Camarillo, CA | 1.0–2.0 | 1.0 | 826 | $2,850 | $3.45 | 1d | 2 | 1.27mi |
| 96 Oak St Camarillo, CA | 1.0 | 1.0 | 720 | $2,200 | $3.06 | 1d | 1 | 1.50mi |
| 78 Oak St Unit 78 Camarillo, CA | 1.0 | 1.0 | 650 | $2,650 | $4.08 | 1d | 1 | 1.50mi |
Listing history 7 events
-
2026-06-18days on market $90,000 Active 10 DOM
-
2026-06-17pricedays on market $90,000 Active 9 DOM
-
2026-06-16days on market $100,000 Active 8 DOM
-
2026-06-15days on market $100,000 Active 7 DOM
-
2026-06-13days on market $100,000 Active 5 DOM
-
2026-06-10remarks 699-char remark
-
2026-06-10$100,000 Active 2 DOM
ⓘ Source: listings_history table (triggers on properties + properties_extension) + one-shot
backfill from property_details.listing_events for pre-trigger history.
Climate risk First Street
- Flood 1/10 Low FEMA zone X (unshaded) · 0% chance over 30 yrs
- Wildfire 4/10 Moderate
- Heat 4/10 Moderate 7 d/yr ≥94°F today · 18 d/yr by 30 yrs out
- Wind 1/10 Low
- Air quality 3/10 Moderate 4 unhealthy d/yr today · 4 by 30 yrs out
Nearby sold comps map
Loading sold comps map…
Walkable amenities ~0.75 mi
Loading nearby amenities…
Taxation est. · year 1
- Rental income
- $37,270
- − Mortgage interest
- −$5,041
- − Property taxes
- −$1,350
- − Insurance
- −$450
- − Repairs & maintenance
- −$2,982
- − Management
- −$2,982
- − Depreciation
- −$2,618
- Taxable income
- $21,847
- Est. tax owed @ 24.0%
- −$5,243
- After-tax cash flow
- $16,737/yr
For passive investors: Depreciation is non-cash, so a rental often shows a tax loss while cash-flowing — sheltering income. Rental losses are passive: they offset passive income freely, and up to $25,000/yr can offset ordinary (W-2) income if you actively participate and your MAGI is under $100k (phasing out to $0 by $150k); unused losses carry forward. On sale, claimed depreciation is recaptured at up to 25%, and gains may owe capital-gains tax (a 1031 exchange can defer both). Figures are a year-1 estimate at your 24.0% rate — not tax advice; consult a CPA.
Schools (NCES district)
- District
- Pleasant Valley
- NCES district ID
- 0630990
- Math proficiency
- 43% ▼ -10.00%
- Reading proficiency
- 57% ▼ -8.00%
- Median HH income
- $87,342
- Composite
- 46.3/100
- National rank
- #2476
- State rank
- #119 of 517 in CA
Livability — Camarillo
- Score
- 78/100
- State rank
- #72
- US rank
- #2776
Category grades
Schools grade is shown separately in the Schools card above.
Census & demographics
- Census place
- Camarillo, CA
- County
- Ventura County · 829,955 people
- City population
- 82,539
- Metro
- Oxnard-Thousand Oaks-Ventura, CA
- Population (ZIP)
- 35,791
- Household income
- $135,217
- Rent vs Own
- Severe rent burden
- 1204.0
Population outlook (Ventura County) Hauer SSP2
- Today (2025)
- 895,754 people
- By 2030
- 912,134 · +1.8%
- By 2040
- 931,454 · +4.0%
- By 2050
- 934,609 · +4.3%
- By 2075
- 924,899 · +3.3%
- By 2100
- 864,712 · -3.5%
Race, ethnicity, and origin ACS 2023
- Neighborhood character
- Diverse neighborhood (Simpson 0.63)
- Race & ethnicity
- White 54% Hispanic / Latino 25% Two or more races 16% Asian 13% Black 3%
- Hispanic origin (detail)
- Mexican 19% Puerto Rican 2%
- Common ancestry
- Italian 2% Romanian 2% Lithuanian 2%
- Foreign-born
- 17% · Canada, China, South Korea
- Languages at home
- 73% English-only · Spanish 13% Other Indo-European 3% Tagalog/Filipino 2%
Political lean MEDSL · Ventura
- 2024 margin
- D (+15.1) · D 56.1% · R 41.0% · Other 2.9%
- 2008→2024 swing
- +2.8pp toward D · 2008: 12.3pp · 2024: 15.1pp
- All cycles
- 2024: D+15.1 2020: D+21.1 2016: D+16.8 2012: D+5.3 2008: D+12.3
Not yet ingested
- Civics
- —
Market trends
- HPI YoY
- ▼ -517.29%
- Current HPI
- 276.7695
- Rent YoY
- ▲ 1.22%
- Metro
- Oxnard-Thousand Oaks-Ventura, CA
- State GDP YoY
- ▲ 3.21%
- F500 in state
- 116
Industry mix (Fortune 500 HQ in CA)
| Industry | F500 HQs | Revenue |
|---|---|---|
| Technology | 27 | $1,492B |
|
||
| Financial Services | 3 | $174B |
|
||
| Retail | 3 | $44B |
|
||
| Insurance | 3 | $26B |
|
||
| Media / Entertainment | 2 | $115B |
|
||
| Pharmaceuticals / Biotech | 2 | $62B |
|
||
Price history
+566.7% since first listed16 events — show timeline
- 2026-06-09 Price Changed $100,000 CRMLS
- 2026-06-08 Listed $125,000 CRMLS
- 2023-06-26 Pending — CRMLS
- 2023-06-26 Sold (MLS) $89,500 CRMLS
- 2023-06-06 Contingent — CRMLS
- 2023-03-16 Price Changed $89,500 CRMLS
- 2023-02-02 Relisted — CRMLS
- 2022-12-09 Contingent — CRMLS
- 2022-11-05 Listed $95,000 CRMLS
- 2011-09-15 Sold (MLS) $10,000 CRMLS
- 2011-08-16 Listing Removed — CRMLS
- 2011-07-26 Price Changed $12,500 CRMLS
- 2011-06-10 Relisted — CRMLS
- 2011-05-05 Listing Removed — CRMLS
- 2011-05-02 Contingent — CRMLS
- 2011-03-23 Listed $15,000 CRMLS
Cash-flow waterfall
monthlySold comps — $/sqft
last 12 mo · ≤1 miLoading sold comps…