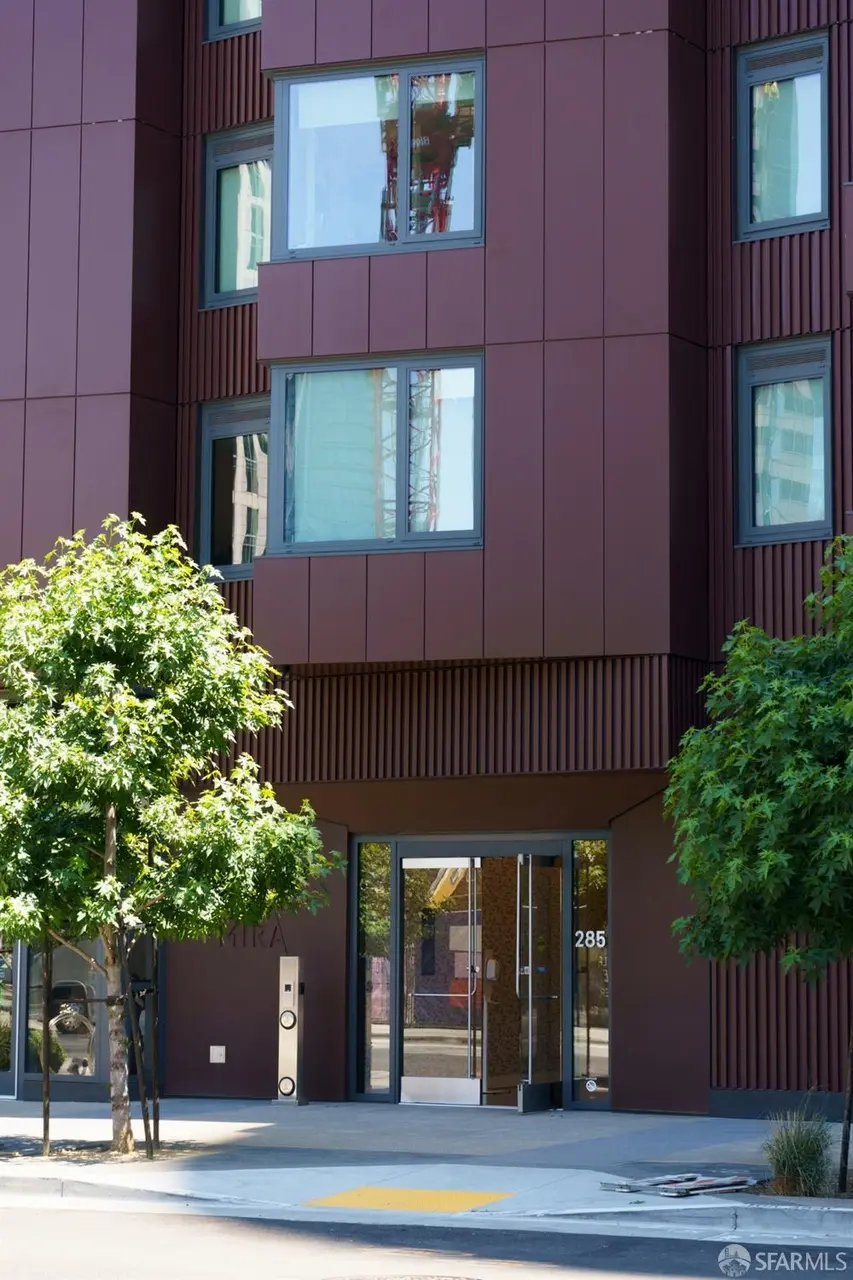
285 Main St #409 · San Francisco, CA
Flood risk 1/10 · Minimal
- FEMA flood zone
- X (unshaded)
- Chance of flooding over 30 yrs
- 0.0%
- Est. flood insurance / yr
- $507 – $1,088
Fire risk 1/10 · Minimal
- Est. fire insurance / yr
- $659 – $1,223
Heat risk 2/10 · Minimal
- Hot days now (above 79°F)
- 7 days/yr
- Hot days in 30 yrs
- 15 days/yr
Wind risk 1/10 · Minimal
- Chance of severe wind over 30 yrs
- —
Air-quality risk 8/10 · Major
- Unhealthy air days now
- 15 days/yr
- Unhealthy air days in 30 yrs
- 15 days/yr
Risk factors via First Street. Map © Google.
Why this score? — see what drove the C+ grade
The composite is a weighted blend of 9 inputs, each scored 0–100. Each bar is that input's sub-score; the figure is the points it added to the 100-point composite (weight × sub-score).
- ARV discount +15.0/15.0
- Cash flow +14.5/30.0
- Appreciation +7.1/10.0
- 1% rule +6.1/10.0
- Rent growth +5.0/5.0
- Schools +5.0/10.0
- DSCR +4.4/10.0
- Condition / age +4.0/5.0
- Livability +3.8/5.0
$420,091
🖨 Deal sheet (PDF) 📄 Offer letter ✓ Due diligence
Listing remarks MLS
1-bedroom Below Market Rate (BMR) housing opportunity at the MIRA (This unit is eligible for Temporary Waivers to Applicant's Eligibility Requirements (see below); at 100% Area Median Income (AMI). Maximum income for 1 person = $109,100; 2 = $124,700; 3 = $140,250; 4 = $155,850; 5 = $168,300 etc. One of the waivers is qualifying AMI of 120% as shown on SFMOHCD listing reflects the one-time 20% increase. Contact Listing Agent for more info about the Temporary waivers that apply. Must be 1st-time homebuyer & income eligible. Unit available thru the Mayor's Office of Housing and Community Development (MOHCD) & subject to resale controls, monitoring & other restrictions. The unit will be available on a first come first served basis starting on 4/2/2026 at 8:00 AM PST. Please visit https://housing. sfgov.org/listings/a0W7y00000GM5npEAD to view the listing and for application & program info. Fair Housing Opportunity.
Key facts
- $773 HOA
- Built 2020
- Listed 143 days
Neighborhood map
What this means for you Summary
Snapshot
- This is a 1-bed/1.0-bath condo listed at $420k. Condition is rated good.
Deal economics
- At list price, monthly cash flow is $91 ($1k/yr) — positive.
- The deal already cash-flows at list — no discount required.
- Meets the 1% rule at list price ($5k rent vs $420k).
- Recommended offer: $370k (12.0% below list) — sets the bar for market timing.
- Cap rate 6.6% vs local median 2.1% in San Francisco — top-decile yield for the area; either an underpriced asset or a hidden risk that comps aren't pricing in. Stress-test before assuming the spread holds.
Location & tenants
- Location reads 76/100 on livability (#90 in CA, #3,143 nationally) — a middle-class / working-renter tenant base. Strengths: amenities A+, commute A+, employment A+; Watch: crime F, cost of living F.
- San Francisco Unified (urban): math 50% / reading 56% proficiency, ranked #322 of 1,400 in CA (top 23%) — acceptable for families but not a draw, mixed tenant base, ~2y average lease.
- Market conditions: Rents rising fast (+19.7%/yr); 120 active listings in the ZIP; 40 comparable units currently listed for rent nearby; rentals leasing fast (median 3d on market — plan ~1-2 weeks tenant-placement turnaround); high-income renter base; 750 units permitted in San Francisco County in 2024 (688 in 5+ unit buildings).
Forward outlook
- In year one you build about $21k of equity ($3k loan paydown + $18k appreciation (4.3% local appreciation)).
- San Francisco County population projected at +39% by 2050 — long-run rental-demand tailwind backs the buy-and-hold thesis.
- At projected returns (4.3% appreciation + 8.0% rent growth), your $118k cash investment doubles in ~5 years — after that, you're playing with house money.
- By year 2, paydown + projected appreciation supports a ~$34k cash-out refi (75% LTV) — recoverable capital for the next deal without selling this one.
Negotiation context
- It's been on market 144 days — a 12% lower offer ($370k) is reasonable based on typical stale-listing flexibility.
Questions for the listing agent
- It's been on market 144 days. Have you received any prior offers? Is the seller open to a 12% concession, seller financing, or rate buy-down credit?
- What does the HOA fee cover, when was the last increase, and are there any pending special assessments or reserve-fund shortfalls?
- Any open or pending special assessments — roof, HVAC, plumbing, elevator, façade? What's the per-unit balance and payoff schedule, and is the seller paying it off at close or rolling it to the buyer?
- Why hasn't it sold? Are there any deal-killer items the seller is aware of (foundation, flood, title, zoning, code violations)?
- Is there a deadline driving the sale (1031 exchange, divorce, estate, relocation)? That informs how much negotiation room exists.
- Schools are B-rated — typically a magnet for longer-tenancy family renters. What's the average tenant stay here, and is there a school-zone premium baked into asking?
- Crime grade is F in this area — have there been break-ins, vandalism, or insurance claims at this property in the last 3 years? What carrier currently insures it and at what premium?
- What's the average days-on-market for RENTAL listings here right now (not sales)? A rising rental-DOM trend means longer vacancies and softer asking-rent achievability than the comps imply.
- What's the recent tenant-quality profile in this submarket — average credit score on applications, eviction rate, late-payment / NSF rate, and stable-employment percentage? A property-management company in the area should have these aggregated.
- How much new apartment / multifamily construction is in the pipeline within 1–3 miles? Heavy new supply (>2% of stock underway) typically softens rents 12–24 months out; light construction supports rent growth.
Investment metrics
- 1% rule
- 1.11% ✓
- Cap rate
- 6.55%
- Cash-on-cash
- 0.92%
- DSCR
- 1.04
- GRM
- 7.5
CMA / ARV
- ARV (median comp)
- $569,402
- List price
- $420,091
- Delta
- -26.22%
- Verdict
- UNDERPRICED
- Comps
- 20 within 1.0 mi
Projected returns pro-forma
4.27% appreciation · 8.0% rent growth · sell at horizon
- IRR
- 14.8%
- Equity multiple
- 1.94×
- Total profit
- $110,305
- Equity at exit
- $219,617
- IRR
- 18.5%
- Equity multiple
- 4.38×
- Total profit
- $397,322
- Equity at exit
- $364,591
Cash invested: $117,625 (down + closing). Projections, not guarantees.
Landlord ↔ Tenant lean methodology
- Overall (CITY)
- 0 Strongly Tenant-Friendly
- State California
- 18 Strongly Tenant-Friendly · D+13
- County
- — inherits STATE
- City San Francisco
- 0 Strongly Tenant-Friendly · D+57
ZIP-level market 94105
- Home prices YoY
- 2.4%
- Rents YoY
- 19.7%
- Active inventory
- 120
- Price-to-rent
- 7.5×
Monthly cashflow live
- Estimated rent
- $4,647 high interval (Pro) →
- Mortgage (P&I)
- −$2,203
- Tax from tax record
- −$430 /mo · $5,158/yr
- Insurance
- −$175
- HOA
- −$773
- Vacancy / Maint / Mgmt
- −$976
- Net cashflow
- $91
Break-even live
Sensitivity live
| Price | -10% $328 | -5% $209 | +0% $91 | +5% $-28 | +10% $-147 |
|---|---|---|---|---|---|
| Rent | -10% $-277 | -5% $-93 | +0% $91 | +5% $274 | +10% $458 |
| Rate | -1.0pp $302 | -0.5pp $197 | base $91 | +0.5pp $-18 | +1.0pp $-129 |
UW: 25.0% down · 7.5% · 30yr · 1.5% tax · 5.0% vac · 8.0% maint · 8.0% mgmt
Financing live
Cash to close
- Down payment
- $105,023
- Closing costs
- $12,603
- Reserves months
- —
- Total cash needed
- —
Loan-product check · same deal, 3 products live
Conventional
25% down · 7.5% · 30yr
- Down + closing
- —
- Monthly P&I
- —
- Monthly cashflow
- —
- DSCR
- —
- Eligible?
- —
Personal DTI + credit; lowest rate.
DSCR
20% down · 8.5% · 30yr
- Down + closing
- —
- Monthly P&I
- —
- Monthly cashflow
- —
- DSCR
- —
- Eligible?
- —
No personal income docs; deal must DSCR.
Hard money
10% down · 12.0% · 12mo
- Down + closing
- —
- Monthly P&I
- —
- Monthly cashflow
- —
- DSCR
- —
- Eligible?
- —
Short-term bridge; refi at stabilization.
Rent comps 40 comps
| Address | Beds | Baths | Sqft | Rent | $/sqft | DOM | Units | Dist |
|---|---|---|---|---|---|---|---|---|
| 88 Howard St San Francisco, CA | 1.0 | 1.0 | 588 | $4,950 | $8.41 | 6d | 10 | 0.12mi |
| 333 Fremont St San Francisco, CA | 1.0–2.0 | 1.0–2.0 | 937 | $4,588 | $4.90 | 3d | 6 | 0.17mi |
| 399 Fremont St San Francisco, CA | 2.0 | 1.0–2.5 | 1077 | $7,300 | $6.77 | 2d | 43 | 0.19mi |
| 201 Harrison St Unit 3A San Francisco, CA | 1.0 | 1.0 | 572 | $1,900 | $3.32 | 22d | 1 | 0.19mi |
| 340 Fremont St San Francisco, CA | 3.0 | 1.0–3.0 | 1146 | $5,697 | $4.97 | 2d | 5 | 0.21mi |
| 500 Folsom St San Francisco, CA | 1.0 | 1.0 | 676 | $6,947 | $10.28 | 3d | 18 | 0.24mi |
| 38 Bryant St #806 San Francisco, CA | 1.0 | 1.0 | 582 | $3,995 | $6.86 | 44d | 1 | 0.25mi |
| 390 1st St San Francisco, CA | 2.0 | 1.0–2.0 | 676 | $5,814 | $8.60 | 3d | 11 | 0.29mi |
| 39 Tehama St San Francisco, CA | 1.0–2.0 | 1.0–2.0 | 1291 | $4,760 | $3.69 | 2d | 14 | 0.30mi |
| 45 Lansing St San Francisco, CA | 1.0 | 1.0 | 640 | $5,260 | $8.21 | 2d | 4 | 0.30mi |
| 3 Bayside Village Pl San Francisco, CA | 1.0 | 1.0 | 599 | $4,964 | $8.28 | 2d | 22 | 0.33mi |
| 501 Delancey St #182 San Francisco, CA | 1.0 | 1.0 | 640 | $3,200 | $5.00 | 15d | 1 | 0.34mi |
| 1 St Francis Pl San Francisco, CA | 3.0 | 1.0–2.0 | 923 | $4,345 | $4.71 | 3d | 2 | 0.54mi |
| 2 Townsend St San Francisco, CA | 1.0–2.0 | 1.0–2.0 | 786 | $4,800 | $6.11 | 3d | 7 | 0.56mi |
| 460 Davis Ct San Francisco, CA | 3.0 | 1.0–2.5 | 907 | $6,040 | $6.66 | 2d | 17 | 0.58mi |
| 88 Townsend St #311 San Francisco, CA | 1.0 | 1.0 | 632 | $4,450 | $7.04 | 25d | 1 | 0.63mi |
| 555 Bryant St San Francisco, CA | 2.0 | 1.0–2.0 | 687 | $5,220 | $7.60 | 2d | 10 | 0.74mi |
| 821 Folsom St #401 San Francisco, CA | 1.0 | 1.0 | 652 | $3,650 | $5.60 | 25d | 1 | 0.78mi |
| 829 Folsom St #408 San Francisco, CA | — | 1.0 | 495 | $2,860 | $5.78 | 15d | 1 | 0.81mi |
| 540 Stockton St Apt 8 San Francisco, CA | 2.0 | 1.0 | 725 | $5,370 | $7.41 | 3d | 1 | 0.83mi |
| 535 Stockton St San Francisco, CA | — | 1.0 | 394 | $2,295 | $5.82 | 44d | 1 | 0.85mi |
| 655 Stockton St San Francisco, CA | — | 1.0 | 354 | $3,720 | $10.51 | 2d | 2 | 0.87mi |
| 707 Stockton St San Francisco, CA | — | 1.0 | 400 | $2,775 | $6.94 | 4d | 1 | 0.88mi |
| 845 California St San Francisco, CA | 1.0 | 1.0 | 476 | $4,995 | $10.49 | 8d | 3 | 0.90mi |
| 400 Clementina St #1449 San Francisco, CA | 1.0–2.0 | 1.0–2.0 | 775 | $3,970 | $5.12 | 2d | 2 | 0.94mi |
| 255 King St San Francisco, CA | 3.0 | 1.0–2.5 | 1228 | $5,620 | $4.58 | 3d | 1 | 0.94mi |
| 1142-1146 Montgomery St Unit 1142-A San Francisco, CA | 1.0 | 1.0 | 709 | $4,995 | $7.05 | 25d | 1 | 0.94mi |
| 900 Folsom St San Francisco, CA | 2.0 | 1.0–2.0 | 863 | $5,020 | $5.82 | 2d | 24 | 0.95mi |
| 737 Bush St San Francisco, CA | 1.0 | 1.0 | 750 | $2,595 | $3.46 | 15d | 1 | 0.95mi |
| 776 Bush St San Francisco, CA | — | 1.0 | 400 | $1,900 | $4.75 | 44d | 1 | 0.99mi |
| 1023 3rd St San Francisco, CA | 2.0 | 1.0–2.0 | 743 | $7,675 | $10.33 | 2d | 13 | 0.99mi |
| 434 Minna St San Francisco, CA | 2.0 | 1.0–2.0 | 719 | $5,246 | $7.29 | 2d | 15 | 1.00mi |
| 929 Pine St San Francisco, CA | — | 1.0 | 400 | $2,150 | $5.38 | 8d | 1 | 1.05mi |
| 960 Market St San Francisco, CA | 1.0 | 1.0 | 613 | $4,295 | $7.01 | 22d | 1 | 1.07mi |
| 950 Pine St San Francisco, CA | — | 1.0 | 750 | $2,650 | $3.53 | 17d | 1 | 1.08mi |
| 555 Taylor St San Francisco, CA | — | 1.0 | 477 | $2,200 | $4.61 | 44d | 1 | 1.10mi |
| 701 Taylor St San Francisco, CA | — | 1.0 | 423 | $2,875 | $6.80 | 3d | 1 | 1.11mi |
| 1426 Stockton St San Francisco, CA | — | 1.0 | 700 | $3,100 | $4.43 | 44d | 1 | 1.11mi |
| 673 Brannan St San Francisco, CA | 1.0–5.0 | 1.0–2.0 | 1302 | $3,912 | $3.00 | 2d | 2 | 1.12mi |
| 300 Berry St #907 San Francisco, CA | 1.0 | 1.0 | 732 | $5,000 | $6.83 | 8d | 1 | 1.13mi |
HOA detail condo
- Monthly dues
- $773 · $9,276/yr
- Assessments
- None detected in remarks — confirm with the listing agent.
Listing history 15 events
-
2026-06-18days on market $420,091 Active 144 DOM
-
2026-06-17days on market $420,091 Active 143 DOM
-
2026-06-16days on market $420,091 Active 142 DOM
-
2026-06-15days on market $420,091 Active 141 DOM
-
2026-06-13days on market $420,091 Active 139 DOM
-
2026-06-13days on market $420,091 Active 138 DOM
-
2026-06-09days on market $420,091 Active 135 DOM
-
2026-06-08days on market $420,091 Active 134 DOM
-
2026-06-07days on market $420,091 Active 133 DOM
-
2026-06-04days on market $420,091 Active 130 DOM
-
2026-06-03days on market $420,091 Active 129 DOM
-
2026-06-02days on market $420,091 Active 128 DOM
-
2026-06-01days on market $420,091 Active 127 DOM
-
2026-05-31days on market $420,091 Active 126 DOM
-
2026-01-25$420,091 Active 949-char remark
Show marketing remark (949 chars)
1-bedroom Below Market Rate (BMR) housing opportunity at the MIRA (This unit is eligible for Temporary Waivers to Applicant's Eligibility Requirements (see below); at 100% Area Median Income (AMI). Maximum income for 1 person = $109,100; 2 = $124,700; 3 = $140,250; 4 = $155,850; 5 = $168,300 etc. One of the waivers is qualifying AMI of 120% as shown on SFMOHCD listing reflects the one-time 20% increase. Contact Listing Agent for more info about the Temporary waivers that apply. Must be 1st-time homebuyer & income eligible. Unit available thru the Mayor's Office of Housing and Community Development (MOHCD) & subject to resale controls, monitoring & other restrictions. The unit will be available on a first come first served basis starting on 4/2/2026 at 8:00 AM PST. Please visit https://housing. sfgov.org/listings/a0W7y00000GM5npEAD to view the listing and for application & program info. Fair Housing Opportunity.
ⓘ Source: listings_history table (triggers on properties + properties_extension) + one-shot
backfill from property_details.listing_events for pre-trigger history.
Tax reassessment forecast CA · Resets to sale price
- Current annual tax
- $5,158 · $430/mo
- Projected year-2 tax
- $5,158 · $430/mo
- Expected delta
- $0/yr ($0/mo · 0.0%)
ⓘ Screening estimate from a state-policy table — verify with the county assessor before closing.
Climate risk First Street
- Flood 1/10 Low FEMA zone X (unshaded) · 0% chance over 30 yrs
- Wildfire 1/10 Low
- Heat 2/10 Low 7 d/yr ≥79°F today · 15 d/yr by 30 yrs out
- Wind 1/10 Low
- Air quality 8/10 Severe 15 unhealthy d/yr today · 15 by 30 yrs out
Nearby sold comps map
Loading sold comps map…
Walkable amenities ~0.75 mi
Loading nearby amenities…
Taxation est. · year 1
- Rental income
- $55,769
- − Mortgage interest
- −$23,532
- − Property taxes
- −$5,158
- − Insurance
- −$2,100
- − Repairs & maintenance
- −$4,462
- − Management
- −$4,462
- − HOA
- −$9,276
- − Depreciation
- −$12,221
- Taxable loss
- −$5,441
- Est. tax savings @ 24.0%
- +$1,306
- After-tax cash flow
- $2,393/yr
For passive investors: Depreciation is non-cash, so a rental often shows a tax loss while cash-flowing — sheltering income. Rental losses are passive: they offset passive income freely, and up to $25,000/yr can offset ordinary (W-2) income if you actively participate and your MAGI is under $100k (phasing out to $0 by $150k); unused losses carry forward. On sale, claimed depreciation is recaptured at up to 25%, and gains may owe capital-gains tax (a 1031 exchange can defer both). Figures are a year-1 estimate at your 24.0% rate — not tax advice; consult a CPA.
Condition & rehab AI · 12 photos
This modern, well-maintained condo is in excellent condition with minimal repairs needed. It's an ideal below-market-rate housing opportunity.
Value-add opportunities
- Both Paint exterior — Enhances curb appeal and resale value
- Both Clean windows — Improves natural light and resale value
Renovation cost estimate screening
Value-add ROI direction
- Both Paint exterior — Enhances curb appeal and resale value ↑
- Both Clean windows — Improves natural light and resale value ↑
ⓘ Cost ranges are severity-bucket heuristics (US national rule-of-thumb). Get contractor quotes + a written scope before underwriting a rehab budget.
Schools (NCES district)
- District
- San Francisco Unified
- NCES district ID
- 0634410
- Math proficiency
- 50% ▬ 0.00%
- Reading proficiency
- 56% ▲ 1.00%
- Median HH income
- $81,249
- Composite
- 50.14/100
- National rank
- #4088
- State rank
- #322 of 1400 in CA
Livability — San Francisco
- Score
- 76/100
- State rank
- #90
- US rank
- #3143
Category grades
Schools grade is shown separately in the Schools card above.
Census & demographics
- Census place
- San Francisco, CA
- County
- San Francisco County · 827,552 people
- City population
- 827,552
- Metro
- San Francisco-Oakland-Berkeley, CA
- Population (ZIP)
- 13,861
- Household income
- $225,000
- Rent vs Own
- Severe rent burden
- 798.0
Population outlook (San Francisco County) Hauer SSP2
- Today (2025)
- 1,030,936 people
- By 2030
- 1,110,409 · +7.7%
- By 2040
- 1,270,010 · +23.2%
- By 2050
- 1,435,001 · +39.2%
- By 2075
- 1,779,074 · +72.6%
- By 2100
- 1,966,767 · +90.8%
Race, ethnicity, and origin ACS 2023
- Neighborhood character
- Diverse neighborhood (Simpson 0.61)
- Race & ethnicity
- Asian 53% White 31% Hispanic / Latino 9% Two or more races 5% Black 2%
- Hispanic origin (detail)
- Mexican 4%
- Common ancestry
- Italian 4% Scotch-Irish 2% Romanian 2%
- Foreign-born
- 45% · China, Canada, South Korea
- Languages at home
- 52% English-only · Chinese 22% Other Indo-European 6% Spanish 6%
Political lean MEDSL · San Francisco
- 2024 margin
- Solid D (+64.8) · D 80.3% · R 15.5% · Other 4.1%
- 2008→2024 swing
- -5.7pp toward R · 2008: 70.5pp · 2024: 64.8pp
- All cycles
- 2024: D+64.8 2020: D+72.5 2016: D+76.1 2012: D+70.2 2008: D+70.5
Not yet ingested
- Civics
- —
Market trends
- HPI YoY
- ▲ 4.27%
- Current HPI
- 179.3791
- Rent YoY
- ▲ 19.74%
- Metro
- San Francisco-Oakland-Berkeley, CA
- State GDP YoY
- ▲ 3.21%
- F500 in state
- 116
Industry mix (Fortune 500 HQ in CA)
| Industry | F500 HQs | Revenue |
|---|---|---|
| Technology | 27 | $1,492B |
|
||
| Financial Services | 3 | $174B |
|
||
| Retail | 3 | $44B |
|
||
| Insurance | 3 | $26B |
|
||
| Media / Entertainment | 2 | $115B |
|
||
| Pharmaceuticals / Biotech | 2 | $62B |
|
||
Price history
1 event — show timeline
- 2026-01-25 Listed $420,091 San Francisco MLS
Property tax history
+12.8%/yrLatest (2025): $5,158 · +3.2% YoY. Source: county tax records.
Cash-flow waterfall
monthlySold comps — $/sqft
last 12 mo · ≤1 miLoading sold comps…