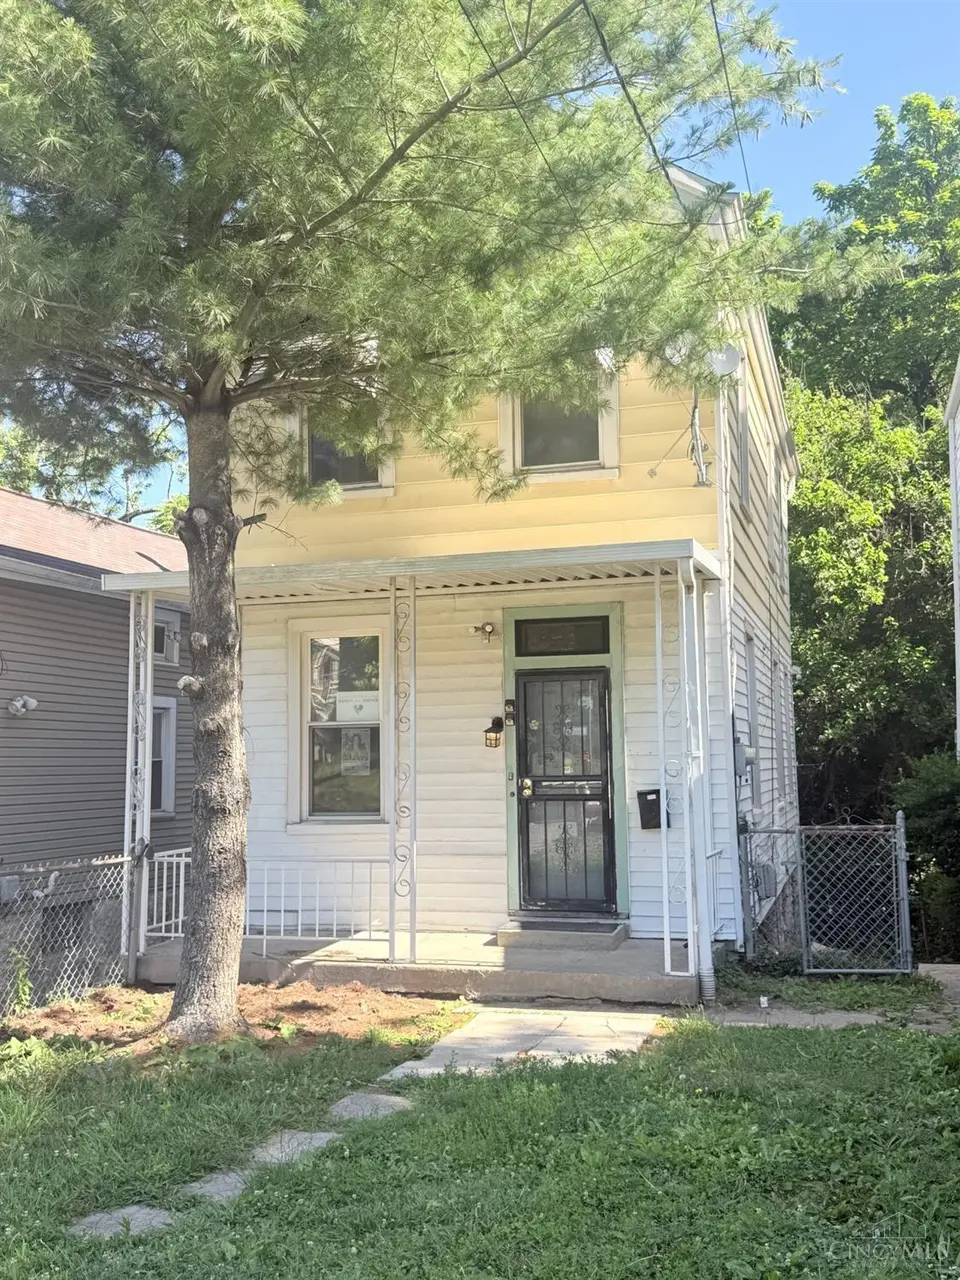
718 Greenwood Ave · Cincinnati, OH
Flood risk 5/10 · Moderate
- FEMA flood zone
- X (unshaded)
- Chance of flooding over 30 yrs
- 0.24%
- Est. flood insurance / yr
- $473 – $860
Fire risk 1/10 · Minimal
- Est. fire insurance / yr
- $713 – $1,323
Heat risk 4/10 · Minor
- Hot days now (above 103°F)
- 7 days/yr
- Hot days in 30 yrs
- 19 days/yr
Wind risk 2/10 · Minimal
- Chance of severe wind over 30 yrs
- 1.0%
Air-quality risk 3/10 · Minor
- Unhealthy air days now
- 2 days/yr
- Unhealthy air days in 30 yrs
- 3 days/yr
Risk factors via First Street. Map © Google.
Why this score? — see what drove the B- grade
The composite is a weighted blend of 9 inputs, each scored 0–100. Each bar is that input's sub-score; the figure is the points it added to the 100-point composite (weight × sub-score).
- Cash flow +25.4/30.0
- ARV discount +15.0/15.0
- DSCR +8.4/10.0
- 1% rule +6.0/10.0
- Livability +4.0/5.0
- Rent growth +3.9/5.0
- Schools +2.5/10.0
- Condition / age +2.5/5.0
- Appreciation +0.0/10.0
$110,000
🖨 Deal sheet 📄 Offer letter ✓ Due diligence
Listing remarks MLS
Wow! Fabulous 2 Br Home For The Budget Minded Person Who Wants C/A, Updated Windows, Off Street Parking, Vinyl Siding, Deck Porch Which Overlooks A Large Back Yard (25x195)!!
Key facts
- Original hardwood
- Deep wooded lot
- Shotgun-style home
Tags
Property features AI
Finance
- Other: Residential zoning; Public transportation access (Metro); City street access
- HOA & community: No homeowners association
Exterior
- Parking: On-street parking
- Utilities: Public water; Public sewer; Natural gas; Gas water heater
- Home design: Traditional single-family home; Two levels; Stone foundation
- Construction: Vinyl and wood siding
- Exterior features: Deck; Porch; Wooded lot; Metal fencing; Double-hung insulated vinyl windows; Shingle roof
Interior
- Kitchen: Tile flooring; Wood cabinets
- Bedrooms: Primary bedroom on 2nd floor (15 x 14); Second bedroom on 2nd floor (10 x 9)
- Flooring: Tile flooring in kitchen
- Bathrooms: One full bathroom (on 2nd floor); One half/partial bathroom (in lower level)
- Heating & cooling: Forced-air gas heating; Central air conditioning; Ceiling fans
- Interior features: 9-foot (or taller) ceilings; Bonus/flex room; Full basement with part-finished area, concrete floor and walkout
- Laundry & utility: 220-volt service available
Neighborhood map
What this means for you Summary
Snapshot
- This is a 2-bed/1.5-bath single-family listed at $110k.
Deal economics
- At list price, monthly cash flow is $252 ($3k/yr) — positive.
- The deal already cash-flows at list — no discount required.
- Meets the 1% rule at list price ($1k rent vs $110k).
- Recommended offer: $108k (1.5% below list) — sets the bar for market timing.
- Cap rate 9.0% vs local median 3.9% in Cincinnati — top-decile yield for the area; either an underpriced asset or a hidden risk that comps aren't pricing in. Stress-test before assuming the spread holds.
Location & tenants
- Location reads 80/100 on livability (#130 in OH, #1,856 nationally) — a professional / high-income tenant draw. Strengths: amenities A+, commute A+, cost of living A+; Watch: employment D, crime F.
- Cincinnati Public Schools (urban): math 25% / reading 36% proficiency, ranked #581 of 656 in OH (top 89%) — families likely to look elsewhere, expect single-tenant / working-renter base with shorter leases; 70% free/reduced lunch — lower-income household profile, screen leases tightly.
- Market conditions: Rents rising fast (+5.5%/yr); 49 active listings in the ZIP; 40 comparable units currently listed for rent nearby; rentals at typical pace (median 24d on market — plan ~3-4 weeks tenant-placement turnaround); lower-income renter base — watch delinquency; 801 units permitted in Hamilton County in 2024 (190 in 5+ unit buildings).
- This rent runs 45% of the median local income ($32k/yr) — at the standard rent-burdened threshold; future hikes will face affordability resistance.
Forward outlook
- Local home prices are declining (-3.0%/yr); year-one equity from $761 of loan paydown is wiped out by about $3k of value loss. Plan a longer hold.
- At projected returns (-3.0% appreciation + 5.5% rent growth), your $31k cash investment doubles in ~9 years — after that, you're playing with house money.
Negotiation context
- It's been on market 16 days — a 2% lower offer ($108k) is reasonable based on typical stale-listing flexibility.
- 3 sale attempts since 26y ago with the ask held roughly flat each time — persistent listings suggest the price (not the market) is what's stuck; bring a comps-based counter.
- Current owner paid $47k; list at $110k implies a 135% gain — meaningful room to come down on a strong offer.
Risks & watch-outs
- Watch-outs: built in 1865 — expect roof / HVAC / electrical / plumbing capex.
- Climate carrying-cost: moderate flood risk — expect insurance premiums to compound above CPI over the hold.
Questions for the listing agent
- Built in 1865 — when were the roof, HVAC, electrical panel, plumbing, and water heater last replaced?
- Is there a deadline driving the sale (1031 exchange, divorce, estate, relocation)? That informs how much negotiation room exists.
- Schools are B-rated — typically a magnet for longer-tenancy family renters. What's the average tenant stay here, and is there a school-zone premium baked into asking?
- Crime grade is F in this area — have there been break-ins, vandalism, or insurance claims at this property in the last 3 years? What carrier currently insures it and at what premium?
- What's the average days-on-market for RENTAL listings here right now (not sales)? A rising rental-DOM trend means longer vacancies and softer asking-rent achievability than the comps imply.
- What's the recent tenant-quality profile in this submarket — average credit score on applications, eviction rate, late-payment / NSF rate, and stable-employment percentage? A property-management company in the area should have these aggregated.
- How much new for-sale + rental construction is in the pipeline within 1–3 miles? Heavy new supply typically softens prices + rents 12–24 months out; constrained supply supports both.
Investment metrics
- 1% rule
- 1.10% ✓
- Cap rate
- 9.04%
- Cash-on-cash
- 9.82%
- DSCR
- 1.44
- GRM
- 7.6
CMA / ARV
- ARV (on-the-fly)
- $202,895
- Comps found
- 6
Show comp detail 6 sales within ~0.75 mi
| Address | Dist | Beds/Ba | Sqft | Sold | Price | $/sf | Match |
|---|---|---|---|---|---|---|---|
| 4224 Minmor Dr | 0.54mi | 2/1.5 | 1,095 (+1%) | 20mo | $204,000 | $186 | 56 |
| 3819 Edge Hill Pl | 0.21mi | 3/3.5 (+1) | 1,184 (+9%) | 10mo | $251,000 | $212 | 53 |
| 3820 Edge Hill Pl | 0.19mi | 3/1.0 (+1) | 1,236 (+14%) | 14mo | $285,000 | $231 | 49 |
| 932 Lexington Ave | 0.57mi | 3/1.0 (+1) | 979 (-10%) | 4mo | $150,000 | $153 | 46 |
| 517 Glenwood Ave | 0.53mi | 2/1.5 | 956 (-12%) | 11mo | $130,000 | $136 | 46 |
| 206 Glenwood Ave | 0.68mi | 2/2.5 | 1,220 (+12%) | 7mo | $228,000 | $187 | 38 |
Match score weights: distance 35% · size 25% · config 20% · recency 20%. Top-matched comps best support the ARV.
Projected returns pro-forma
-3.0% appreciation · 5.55% rent growth · sell at horizon
- IRR
- 1.1%
- Equity multiple
- 1.04×
- Total profit
- $1,372
- Equity at exit
- $16,401
- IRR
- 13.0%
- Equity multiple
- 2.15×
- Total profit
- $35,482
- Equity at exit
- $9,511
Cash invested: $30,800 (down + closing). Projections, not guarantees.
Landlord ↔ Tenant lean methodology
- Overall (STATE)
- 73 Landlord-Friendly
- State Ohio
- 73 Landlord-Friendly · R+6
- County
- — inherits STATE
- City
- — inherits STATE
ZIP-level market 45229
- Home prices YoY
- -24.0%
- Rents YoY
- 5.5%
- Active inventory
- 49
- Price-to-rent
- 7.6×
Monthly cashflow live
- Estimated rent
- $1,205 high interval (Pro) →
- Mortgage (P&I)
- −$577
- Tax from tax record
- −$77 /mo · $923/yr
- Insurance
- −$46
- HOA
- −$0
- Vacancy / Maint / Mgmt
- −$253
- Net cashflow
- $252
Break-even live
UW: 25.0% down · 7.5% · 30yr · 1.5% tax · 5.0% vac · 8.0% maint · 8.0% mgmt
Financing live
Cash to close
- Down payment
- $27,500
- Closing costs
- $3,300
- Reserves months
- —
- Total cash needed
- —
Loan-product check · same deal, 3 products live
Conventional
25% down · 7.5% · 30yr
- Down + closing
- —
- Monthly P&I
- —
- Monthly cashflow
- —
- DSCR
- —
- Eligible?
- —
Personal DTI + credit; lowest rate.
DSCR
20% down · 8.5% · 30yr
- Down + closing
- —
- Monthly P&I
- —
- Monthly cashflow
- —
- DSCR
- —
- Eligible?
- —
No personal income docs; deal must DSCR.
Hard money
10% down · 12.0% · 12mo
- Down + closing
- —
- Monthly P&I
- —
- Monthly cashflow
- —
- DSCR
- —
- Eligible?
- —
Short-term bridge; refi at stabilization.
Rent comps 40 comps
| Address | Beds | Baths | Sqft | Rent | $/sqft | DOM | Units | Dist |
|---|---|---|---|---|---|---|---|---|
| 800 N Fred Shuttlesworth Cir Apt 3 Cincinnati, OH | 2.0 | 1.0 | 1200 | $1,300 | $1.08 | 23d | 1 | 0.12mi |
| 710 Chalfonte Pl Apt 101 Cincinnati, OH | 2.0 | 1.0 | 1000 | $1,250 | $1.25 | 23d | 1 | 0.19mi |
| 638 Greenwood Ave Cincinnati, OH | 1.0 | 1.0 | 700 | $795 | $1.14 | 23d | 1 | 0.23mi |
| 3640 Reading Rd Unit 3640-1 Cincinnati, OH | 3.0 | 1.0 | 1113 | $1,295 | $1.16 | 23d | 1 | 0.24mi |
| 3636 Reading Rd Unit 3636-2 Cincinnati, OH | 3.0 | 1.0 | 950 | $1,275 | $1.34 | 14d | 1 | 0.26mi |
| 3566 Estes Pl Unit 3 Cincinnati, OH | 1.0 | 1.0 | 743 | $980 | $1.32 | 14d | 1 | 0.49mi |
| 3566 Estes Pl Unit 3 Cincinnati, OH | 1.0 | 1.0 | 743 | $980 | $1.32 | 23d | 1 | 0.49mi |
| 564 Glenwood Ave Unit 24 Cincinnati, OH | 1.0 | 1.0 | 811 | $895 | $1.10 | 14d | 1 | 0.49mi |
| 566 Glenwood Ave Unit 5 Cincinnati, OH | 2.0 | 1.0 | 1100 | $1,095 | $1.00 | 3d | 1 | 0.50mi |
| 562 Glenwood Ave Unit 1 Cincinnati, OH | 2.0 | 1.0 | 1075 | $1,160 | $1.08 | 14d | 1 | 0.50mi |
| 611 E Mitchell Ave Unit 2 Cincinnati, OH | 2.0 | 1.0 | 1200 | $1,395 | $1.16 | 23d | 1 | 0.55mi |
| 611 E Mitchell Ave Unit 2 Cincinnati, OH | 2.0 | 1.0 | 1400 | $1,395 | $1.00 | 10d | 1 | 0.55mi |
| 835 Hutchins Ave #3 Cincinnati, OH | 2.0 | 1.0 | 1200 | $950 | $0.79 | 23d | 1 | 0.57mi |
| 3595 Harvey Ave Cincinnati, OH | 3.0 | 3.0 | 1200 | $2,250 | $1.88 | 2d | 1 | 0.58mi |
| 3549 Harvey Ave Apt 2085 Cincinnati, OH | 3.0 | 1.0 | 900 | $1,325 | $1.47 | 23d | 1 | 0.66mi |
| 3549 Harvey Ave Unit 2089 Cincinnati, OH | 2.0 | 1.0 | 800 | $995 | $1.24 | 14d | 1 | 0.66mi |
| 3583 Alaska Ave Cincinnati, OH | 1.0–2.0 | 1.0 | 839 | $1,120 | $1.33 | 3d | 32 | 0.71mi |
| 1607 Asmann Ave Cincinnati, OH | 1.0–4.0 | 1.0–1.5 | 1069 | $1,162 | $1.09 | 12d | 6 | 0.71mi |
| 1613 Asmann Ave Unit 7 Cincinnati, OH | 1.0 | 1.0 | 750 | $900 | $1.20 | 23d | 1 | 0.75mi |
| 145 Glenridge Pl Unit D Cincinnati, OH | 1.0 | 1.0 | 700 | $825 | $1.18 | 4d | 1 | 0.76mi |
| 116 Clinton Springs Ave Unit 3 Cincinnati, OH | 1.0 | 1.0 | 900 | $850 | $0.94 | 21d | 1 | 0.76mi |
| 1621 Asmann Ave Apt 10 Cincinnati, OH | 2.0 | 1.0 | 850 | $1,195 | $1.41 | 20d | 1 | 0.78mi |
| 1621 Asmann Ave Apt 3 Cincinnati, OH | 2.0 | 1.0 | 850 | $1,195 | $1.41 | 23d | 1 | 0.78mi |
| 39 Glen Este Pl Fl 1 Cincinnati, OH | 2.0 | 1.0 | 900 | $1,150 | $1.28 | 23d | 1 | 0.84mi |
| 4423 Greenlee Ave Unit 2 Cincinnati, OH | 2.0 | 1.0 | 950 | $1,095 | $1.15 | 23d | 1 | 0.85mi |
| 4423 Greenlee Ave Unit 2 Cincinnati, OH | 2.0 | 1.0 | 950 | $1,095 | $1.15 | 4d | 1 | 0.85mi |
| 575 Blair Ave Unit 575-3 Cincinnati, OH | 3.0 | 1.0 | 1200 | $1,375 | $1.15 | 14d | 1 | 0.91mi |
| 3550 Woodburn Ave Cincinnati, OH | 3.0 | 1.0 | 1308 | $2,000 | $1.53 | 14d | 1 | 0.94mi |
| 262 Irwin Pl Cincinnati, OH | 2.0 | 1.0 | 850 | $1,420 | $1.67 | 23d | 1 | 0.94mi |
| 568 Hale Ave Unit 2 Cincinnati, OH | 2.0 | 1.0 | 900 | $1,400 | $1.56 | 17d | 1 | 0.94mi |
| 3872 Vine St Unit 3 Cincinnati, OH | 1.0 | 1.0 | 700 | $1,100 | $1.57 | 4d | 1 | 0.95mi |
| 3970 Vine St Cincinnati, OH | 1.0 | 1.0 | 800 | $750 | $0.94 | 23d | 1 | 1.00mi |
| 5 E Mitchell Ave Unit 4 Cincinnati, OH | 1.0 | 1.0 | 1000 | $825 | $0.82 | 23d | 1 | 1.00mi |
| 216 Rockdale Ave Unit 2 Cincinnati, OH | 1.0 | 1.0 | 750 | $925 | $1.23 | 20d | 1 | 1.01mi |
| 1512 Blair Ave Apt B Cincinnati, OH | 3.0 | 1.5 | 1100 | $1,795 | $1.63 | 23d | 1 | 1.02mi |
| 21 Clinton Springs Ln Cincinnati, OH | 3.0 | 1.0 | 1304 | $1,650 | $1.27 | 23d | 1 | 1.04mi |
| 4237 Vine St Unit 3 Cincinnati, OH | 1.0 | 1.0 | 710 | $825 | $1.16 | 23d | 1 | 1.06mi |
| 4237 Vine St Unit 2 Cincinnati, OH | 1.0 | 1.0 | 724 | $925 | $1.28 | 23d | 1 | 1.06mi |
| 1102 Egan Ct Unit 2 Cincinnati, OH | 1.0 | 1.0 | 700 | $775 | $1.11 | 23d | 1 | 1.06mi |
| 4342 Vine St #2 Cincinnati, OH | 3.0 | 1.0 | 1100 | $1,400 | $1.27 | 23d | 1 | 1.08mi |
Listing history 11 events
-
2026-06-18days on market $110,000 Active 16 DOM
-
2026-06-17days on market $110,000 Active 15 DOM
-
2026-06-16days on market $110,000 Active 14 DOM
-
2026-06-15days on market $110,000 Active 13 DOM
-
2026-06-13days on market $110,000 Active 11 DOM
-
2026-06-13days on market $110,000 Active 10 DOM
-
2026-06-09days on market $110,000 Active 7 DOM
-
2026-06-08days on market $110,000 Active 6 DOM
-
2026-06-07days on market $110,000 Active 5 DOM
-
2026-06-02remarks 656-char remark
-
2026-06-02$110,000 Active 1 DOM
ⓘ Source: listings_history table (triggers on properties + properties_extension) + one-shot
backfill from property_details.listing_events for pre-trigger history.
Tax reassessment forecast OH · Partial reset (capped growth)
- Current annual tax
- $923 · $77/mo
- Projected year-2 tax
- $1,320 · $110/mo
- Expected delta
- +$396/yr (+$33/mo · 42.9%)
ⓘ Screening estimate from a state-policy table — verify with the county assessor before closing.
Climate risk First Street
- Flood 5/10 Major FEMA zone X (unshaded) · 24% chance over 30 yrs
- Wildfire 1/10 Low
- Heat 4/10 Moderate 7 d/yr ≥103°F today · 19 d/yr by 30 yrs out
- Wind 2/10 Low 100% chance of damaging wind over 30 yrs
- Air quality 3/10 Moderate 2 unhealthy d/yr today · 3 by 30 yrs out
Nearby sold comps map
Loading sold comps map…
Walkable amenities ~0.75 mi
Loading nearby amenities…
Taxation est. · year 1
- Rental income
- $14,454
- − Mortgage interest
- −$6,162
- − Property taxes
- −$923
- − Insurance
- −$550
- − Repairs & maintenance
- −$1,156
- − Management
- −$1,156
- − Depreciation
- −$3,200
- Taxable income
- $1,307
- Est. tax owed @ 24.0%
- −$314
- After-tax cash flow
- $2,710/yr
For passive investors: Depreciation is non-cash, so a rental often shows a tax loss while cash-flowing — sheltering income. Rental losses are passive: they offset passive income freely, and up to $25,000/yr can offset ordinary (W-2) income if you actively participate and your MAGI is under $100k (phasing out to $0 by $150k); unused losses carry forward. On sale, claimed depreciation is recaptured at up to 25%, and gains may owe capital-gains tax (a 1031 exchange can defer both). Figures are a year-1 estimate at your 24.0% rate — not tax advice; consult a CPA.
Schools (NCES district)
- District
- Cincinnati Public Schools
- NCES district ID
- 3904375
- Math proficiency
- 25% ▼ -19.00%
- Reading proficiency
- 36% ▼ -14.00%
- Median HH income
- $35,743
- Composite
- 25.21/100
- National rank
- #7508
- State rank
- #581 of 656 in OH
Livability — Cincinnati
- Score
- 80/100
- State rank
- #130
- US rank
- #1856
Category grades
Schools grade is shown separately in the Schools card above.
Census & demographics
- Census place
- Cincinnati, OH
- County
- Hamilton County · 701,295 people
- City population
- 505,555
- Metro
- Cincinnati, OH-KY-IN
- Population (ZIP)
- 13,529
- Household income
- $32,263
- Rent vs Own
- Severe rent burden
- 1730.0
Population outlook (Hamilton County) Hauer SSP2
- Today (2025)
- 826,054 people
- By 2030
- 830,947 · +0.6%
- By 2040
- 832,319 · +0.8%
- By 2050
- 822,428 · -0.4%
- By 2075
- 788,688 · -4.5%
- By 2100
- 710,674 · -14.0%
Race, ethnicity, and origin ACS 2023
- Neighborhood character
- Predominantly Black (65%)
- Race & ethnicity
- Black 65% White 24% Two or more races 5% Hispanic / Latino 4% Asian 1%
- Common ancestry
- Italian 2% Iranian 1% Lithuanian 1%
- Foreign-born
- 5% · Canada
- Languages at home
- 93% English-only · Spanish 4% Russian/Polish/Slavic 1% Other Indo-European 1%
Political lean MEDSL · Hamilton
- 2024 margin
- D (+14.9) · D 57.0% · R 42.1%
- 2008→2024 swing
- +7.9pp toward D · 2008: 7.0pp · 2024: 14.9pp
- All cycles
- 2024: D+14.9 2020: D+15.9 2016: D+9.5 2012: D+4.9 2008: D+7.0
Not yet ingested
- Civics
- —
Market trends
- HPI YoY
- ▼ -80.34%
- Current HPI
- 254.492
- Rent YoY
- ▲ 5.55%
- Metro
- Cincinnati, OH-KY-IN
- State GDP YoY
- ▲ 1.98%
- F500 in state
- 48
Industry mix (Fortune 500 HQ in OH)
| Industry | F500 HQs | Revenue |
|---|---|---|
| Insurance | 3 | $145B |
|
||
| Industrial Machinery | 3 | $49B |
|
||
| Financial Services | 3 | $24B |
|
||
| Consumer Goods | 2 | $93B |
|
||
| Aerospace / Defense | 2 | $47B |
|
||
| Utilities | 2 | $33B |
|
||
Price history
+547.1% since first listed7 events — show timeline
- 2026-06-02 Listed $110,000 Cincy MLS
- 2001-11-16 Sold (Public Records) $46,900 Public Records
- 2001-09-26 Sold (MLS) $46,900 Cincy MLS
- 2000-10-26 Listed $45,900 Cincy MLS
- 2000-10-15 Listing Removed — Cincy MLS
- 2000-04-19 Listed $49,500 Cincy MLS
- 1990-12-21 Sold (Public Records) $17,000 Public Records
Property tax history
+3.4%/yrLatest (2025): $923 · +3.1% YoY. Source: county tax records.
Cash-flow waterfall
monthlySold comps — $/sqft
last 12 mo · ≤1 miLoading sold comps…