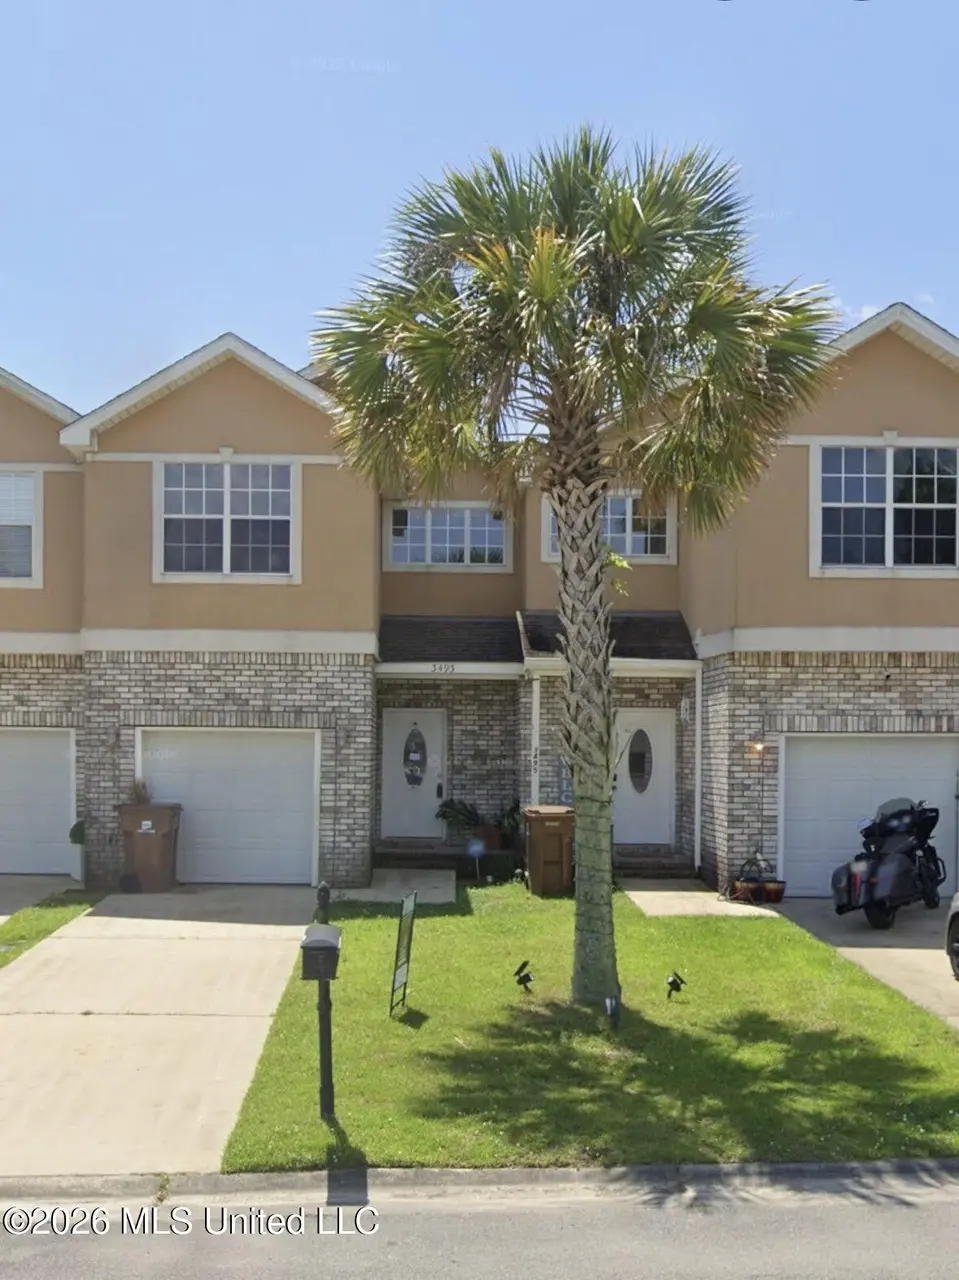
3493 Riverbend Cv · D'Iberville, MS
Flood risk 5/10 · Moderate
- FEMA flood zone
- X (shaded)
- Chance of flooding over 30 yrs
- 0.24%
- Est. flood insurance / yr
- $507 – $1,088
Fire risk 3/10 · Minor
- Est. fire insurance / yr
- $1,241 – $2,305
Heat risk 10/10 · Severe
- Hot days now (above 106°F)
- 7 days/yr
- Hot days in 30 yrs
- 22 days/yr
Wind risk 9/10 · Severe
- Chance of severe wind over 30 yrs
- 99.0%
Air-quality risk 2/10 · Minimal
- Unhealthy air days now
- 1 days/yr
- Unhealthy air days in 30 yrs
- 2 days/yr
Risk factors via First Street. Map © Google.
Why this score? — see what drove the F grade
The composite is a weighted blend of 9 inputs, each scored 0–100. Each bar is that input's sub-score; the figure is the points it added to the 100-point composite (weight × sub-score).
- Cash flow +7.7/30.0
- ARV discount +7.5/15.0
- Schools +4.2/10.0
- Rent growth +2.5/5.0
- Livability +2.5/5.0
- Condition / age +2.5/5.0
- 1% rule +2.0/10.0
- DSCR +1.8/10.0
- Appreciation +0.0/10.0
$179,000
🖨 Deal sheet 📄 Offer letter ✓ Due diligence
Listing remarks
Enjoy the beautiful view of the Tchoutacabouffa River from many rooms and the back deck of this beautifully appointed townhome. The original owner and builder put thoughtful design and finishes into this community and home. It's the most peaceful and scenic place to call home with such close proximity to countless amenities, shopping and restaurants nearby.
Key facts
- Back deck
- 2,178 sq ft lot
- Garage
Tags
Property features AI
Finance
- Other: Located on a cul-de-sac with front yard and views
- Financial info:
- HOA & community:
Exterior
- Parking: Detached 1-car garage with garage door opener and garage facing front; Carport with 2 spaces; 23 total parking spaces
- Security:
- Utilities: Public water; Public sewer; Electricity available; Cable available; Phone available
- Home design: Single-family residence; Two levels; Move-in ready
- Construction: Brick and stucco construction; Asphalt shingle roof; Slab foundation; Built (year source: owner)
- Exterior features: Deck; Rain gutters
Interior
- Kitchen: Oven; Refrigerator
- Bedrooms: Includes at least one bedroom
- Flooring:
- Bathrooms: Two full bathrooms and one half bathroom (2.5 total)
- Heating & cooling: Central heating; Forced air; Fireplace insert contributes to heating; Central air conditioning
- Interior features: Breakfast bar; Granite counters; Fireplace with insert; Five total rooms (including living areas and bedrooms)
- Laundry & utility:
Neighborhood map
What this means for you Summary
Snapshot
- This is a 2-bed/1.5-bath single-family listed at $179k.
Deal economics
- At list price, monthly cash flow is $-204 ($-2k/yr) — negative.
- To cash-flow at today's rent, offer at most $143k (20.1% below list).
- To meet the 1% rule (rent ≥ 1% of price), the offer needs to be $126k (29.7% below list).
- Recommended offer: $126k (29.7% below list) — sets the bar for 1% rule.
Location & tenants
- Location reads: area grade F — affects rentability + tenant quality, not the cash-flow math above.
- Harrison County School District (rural): math 52% / reading 46% proficiency, ranked #14 of 130 in MS (top 11%) — families likely to look elsewhere, expect single-tenant / working-renter base with shorter leases; 62% free/reduced lunch — lower-income household profile, screen leases tightly.
- Zoned schools: Creekbend Elementary And Middle (979 students, 100% FRL) — zoned schools average 100% FRL vs 62% district-wide (37 pts higher); higher-poverty schools than district average — tighter screening recommended.
- Market conditions: 89 active listings in the ZIP; 4 comparable units currently listed for rent nearby; rentals leasing fast (median 14d on market — plan ~1-2 weeks tenant-placement turnaround); 2,194 units permitted in Harrison County in 2024 (0 in 5+ unit buildings).
Forward outlook
- Local home prices are declining (-3.0%/yr); year-one equity from $1k of loan paydown is wiped out by about $5k of value loss. Plan a longer hold.
- Harrison County population projected at +27% by 2050 — long-run rental-demand tailwind backs the buy-and-hold thesis.
Negotiation context
- It's been on market 29 days — a 2% lower offer ($176k) is reasonable based on typical stale-listing flexibility.
- 7 sale attempts since 4y ago with the ask held roughly flat each time — persistent listings suggest the price (not the market) is what's stuck; bring a comps-based counter.
Risks & watch-outs
- Climate carrying-cost: moderate flood risk; severe wind risk, 99% chance of damaging wind over 30y; extreme-heat days projected 7→22/yr by 2055 (HVAC capex compounding) — expect insurance premiums to compound above CPI over the hold.
Questions for the listing agent
- What do current leases actually rent for vs. the listed asking? Can we see a recent rent roll and the last 12 months of T-12 income?
- Is there a deadline driving the sale (1031 exchange, divorce, estate, relocation)? That informs how much negotiation room exists.
- The area grade is low — what's the realistic commute time and amenity access for the typical tenant pool here? Any planned neighborhood developments (good or bad) we should know about?
- What's the average days-on-market for RENTAL listings here right now (not sales)? A rising rental-DOM trend means longer vacancies and softer asking-rent achievability than the comps imply.
- What's the recent tenant-quality profile in this submarket — average credit score on applications, eviction rate, late-payment / NSF rate, and stable-employment percentage? A property-management company in the area should have these aggregated.
- How much new for-sale + rental construction is in the pipeline within 1–3 miles? Heavy new supply typically softens prices + rents 12–24 months out; constrained supply supports both.
Investment metrics
- 1% rule
- 0.70% ✗
- Cap rate
- 4.93%
- Cash-on-cash
- -4.88%
- DSCR
- 0.78
- GRM
- 11.9
CMA / ARV
No comps found within radius.
Projected returns pro-forma
-3.0% appreciation · 3.0% rent growth · sell at horizon
- IRR
- -24.6%
- Equity multiple
- 0.16×
- Total profit
- $-41,991
- Equity at exit
- $26,689
- IRR
- -20.2%
- Equity multiple
- -0.06×
- Total profit
- $-53,300
- Equity at exit
- $15,477
Cash invested: $50,120 (down + closing). Projections, not guarantees.
Landlord ↔ Tenant lean methodology
- Overall (STATE)
- 90 Strongly Landlord-Friendly
- State Mississippi
- 90 Strongly Landlord-Friendly · R+11
- County
- — inherits STATE
- City
- — inherits STATE
ZIP-level market 39540
- Home prices YoY
- -30.9%
- Active inventory
- 89
- Price-to-rent
- 11.9×
Monthly cashflow live
- Estimated rent
- $1,259 medium interval (Pro) →
- Mortgage (P&I)
- −$939
- Tax from tax record
- −$185 /mo · $2,218/yr
- Insurance
- −$75
- HOA
- −$0
- Vacancy / Maint / Mgmt
- −$264
- Net cashflow
- $-204
Break-even live
UW: 25.0% down · 7.5% · 30yr · 1.5% tax · 5.0% vac · 8.0% maint · 8.0% mgmt
Financing live
Cash to close
- Down payment
- $44,750
- Closing costs
- $5,370
- Reserves months
- —
- Total cash needed
- —
Loan-product check · same deal, 3 products live
Conventional
25% down · 7.5% · 30yr
- Down + closing
- —
- Monthly P&I
- —
- Monthly cashflow
- —
- DSCR
- —
- Eligible?
- —
Personal DTI + credit; lowest rate.
DSCR
20% down · 8.5% · 30yr
- Down + closing
- —
- Monthly P&I
- —
- Monthly cashflow
- —
- DSCR
- —
- Eligible?
- —
No personal income docs; deal must DSCR.
Hard money
10% down · 12.0% · 12mo
- Down + closing
- —
- Monthly P&I
- —
- Monthly cashflow
- —
- DSCR
- —
- Eligible?
- —
Short-term bridge; refi at stabilization.
Rent comps 4 comps
| Address | Beds | Baths | Sqft | Rent | $/sqft | DOM | Units | Dist |
|---|---|---|---|---|---|---|---|---|
| 12420 LAMEY BRIDGE RD DIBERVILLE, MS | 2.0 | 1.0–2.0 | 651 | $1,450 | $2.23 | 13d | 5 | 0.51mi |
| 15815 Adam Rd Unit 518 Biloxi, MS | 2.0 | 2.0 | 1039 | $1,099 | $1.06 | 13d | 1 | 1.17mi |
| 12088 Lamey Bridge Rd Diberville, MS | 1.0–3.0 | 1.0–2.0 | 1150 | $1,400 | $1.22 | 13d | 1 | 1.18mi |
| 15812 Adam Rd Biloxi, MS | 2.0 | 1.5 | 1100 | $1,000 | $0.91 | 43d | 1 | 1.18mi |
Listing history 34 events
-
2026-06-18days on market $179,000 Active 29 DOM
-
2026-06-17days on market $179,000 Active 28 DOM
-
2026-06-16days on market $179,000 Active 27 DOM
-
2026-06-15days on market $179,000 Active 26 DOM
-
2026-06-14days on market $179,000 Active 24 DOM
-
2026-06-13days on market $179,000 Active 23 DOM
-
2026-06-10days on market $179,000 Active 21 DOM
-
2026-06-09days on market $179,000 Active 20 DOM
-
2026-06-08days on market $179,000 Active 19 DOM
-
2026-06-07days on market $179,000 Active 18 DOM
-
2026-06-02days on market $179,000 Active 13 DOM
-
2026-06-01days on market $179,000 Active 12 DOM
-
2026-05-31days on market $179,000 Active 11 DOM
-
2026-05-30days on market $179,000 Active 10 DOM
-
2026-05-20$179,000 Active
-
2026-03-30historical
-
2025-11-05price $177,000
-
2025-09-29$179,000 Active
-
2025-08-12status Active
-
2025-07-28status Pending
-
2025-07-28historical
-
2025-07-02price $185,000
-
2025-06-16price $189,000
-
2025-05-24price $195,000
-
2025-04-16$199,000 Active
-
2022-08-05soldstatus Closed
-
2022-06-27status Pending
-
2022-06-22price $199,000
-
2022-05-18price $215,000
-
2022-05-09status Active
-
2022-04-28status Pending
-
2022-04-11status Active
-
2022-04-08status Pending
-
2022-04-06$225,000 Active
ⓘ Source: listings_history table (triggers on properties + properties_extension) + one-shot
backfill from property_details.listing_events for pre-trigger history.
Tax reassessment forecast MS · Resets to sale price
- Current annual tax
- $2,218 · $185/mo
- Projected year-2 tax
- $2,218 · $185/mo
- Expected delta
- $0/yr ($0/mo · 0.0%)
ⓘ Screening estimate from a state-policy table — verify with the county assessor before closing.
Climate risk First Street
- Flood 5/10 Major FEMA zone X (shaded) · 24% chance over 30 yrs
- Wildfire 3/10 Moderate
- Heat 10/10 Extreme 7 d/yr ≥106°F today · 22 d/yr by 30 yrs out
- Wind 9/10 Extreme 99% chance of damaging wind over 30 yrs
- Air quality 2/10 Low 1 unhealthy d/yr today · 2 by 30 yrs out
Nearby sold comps map
Loading sold comps map…
Walkable amenities ~0.75 mi
Loading nearby amenities…
Taxation est. · year 1
- Rental income
- $15,103
- − Mortgage interest
- −$10,027
- − Property taxes
- −$2,218
- − Insurance
- −$895
- − Repairs & maintenance
- −$1,208
- − Management
- −$1,208
- − Depreciation
- −$5,207
- Taxable loss
- −$5,660
- Est. tax savings @ 24.0%
- +$1,358
- After-tax cash flow
- $-1,087/yr
For passive investors: Depreciation is non-cash, so a rental often shows a tax loss while cash-flowing — sheltering income. Rental losses are passive: they offset passive income freely, and up to $25,000/yr can offset ordinary (W-2) income if you actively participate and your MAGI is under $100k (phasing out to $0 by $150k); unused losses carry forward. On sale, claimed depreciation is recaptured at up to 25%, and gains may owe capital-gains tax (a 1031 exchange can defer both). Figures are a year-1 estimate at your 24.0% rate — not tax advice; consult a CPA.
Schools (NCES district)
- District
- Harrison County School District
- NCES district ID
- 2801770
- Math proficiency
- 52% ▼ -4.00%
- Reading proficiency
- 46% ▼ -4.00%
- Median HH income
- $46,504
- Composite
- 41.66/100
- National rank
- #3419
- State rank
- #14 of 130 in MS
Livability — D'Iberville
No livability data for this city. (Only ~50 U.S. cities are tracked.)
Census & demographics
- Census place
- D'Iberville, MS
- Population (ZIP)
- 13,033
Population outlook (Harrison County) Hauer SSP2
- Today (2025)
- 228,444 people
- By 2030
- 241,942 · +5.9%
- By 2040
- 267,531 · +17.1%
- By 2050
- 291,062 · +27.4%
- By 2075
- 346,711 · +51.8%
- By 2100
- 378,165 · +65.5%
Race, ethnicity, and origin ACS 2023
- Neighborhood character
- Diverse neighborhood (Simpson 0.60)
- Race & ethnicity
- White 60% Black 18% Asian 10% Two or more races 9% Hispanic / Latino 9%
- Hispanic origin (detail)
- Common ancestry
- Romanian 5% Slovak 4% Lithuanian 3%
- Foreign-born
- 12% · Canada, Vietnam, South Korea
- Languages at home
- 85% English-only · Spanish 6% Vietnamese 6% Other Asian/Pacific 1%
Political lean MEDSL · Harrison
- 2024 margin
- Strong R (+28.9) · D 35.0% · R 63.9% · Other 1.1%
- 2008→2024 swing
- -2.9pp toward R · 2008: -26.0pp · 2024: -28.9pp
- All cycles
- 2024: R+28.9 2020: R+25.2 2016: R+30.7 2012: R+26.6 2008: R+26.0
Not yet ingested
- Civics
- —
Market trends
- HPI YoY
- ▼ -83.70%
- Current HPI
- 187.2895
- Rent YoY
- —
- Metro
- —
- State GDP YoY
- —
- F500 in state
- 0
Price history
-20.4% since first listed20 events — show timeline
- 2026-05-20 Listed $179,000 MLSU
- 2026-03-30 Listing Removed — MLSU
- 2025-11-05 Price Changed $177,000 MLSU
- 2025-09-29 Listed $179,000 MLSU
- 2025-08-12 Relisted — MLSU
- 2025-07-28 Pending — MLSU
- 2025-07-28 Listing Removed — MLSU
- 2025-07-02 Price Changed $185,000 MLSU
- 2025-06-16 Price Changed $189,000 MLSU
- 2025-05-24 Price Changed $195,000 MLSU
- 2025-04-16 Listed $199,000 MLSU
- 2022-08-05 Sold (MLS) — MLSU
- 2022-06-27 Pending — MLSU
- 2022-06-22 Price Changed $199,000 MLSU
- 2022-05-18 Price Changed $215,000 MLSU
- 2022-05-09 Relisted — MLSU
- 2022-04-28 Pending — MLSU
- 2022-04-11 Relisted — MLSU
- 2022-04-08 Pending — MLSU
- 2022-04-06 Listed $225,000 MLSU
Property tax history
+0.6%/yrLatest (2025): $2,218 · +4.4% YoY. Source: county tax records.
Cash-flow waterfall
monthlySold comps — $/sqft
last 12 mo · ≤1 miLoading sold comps…