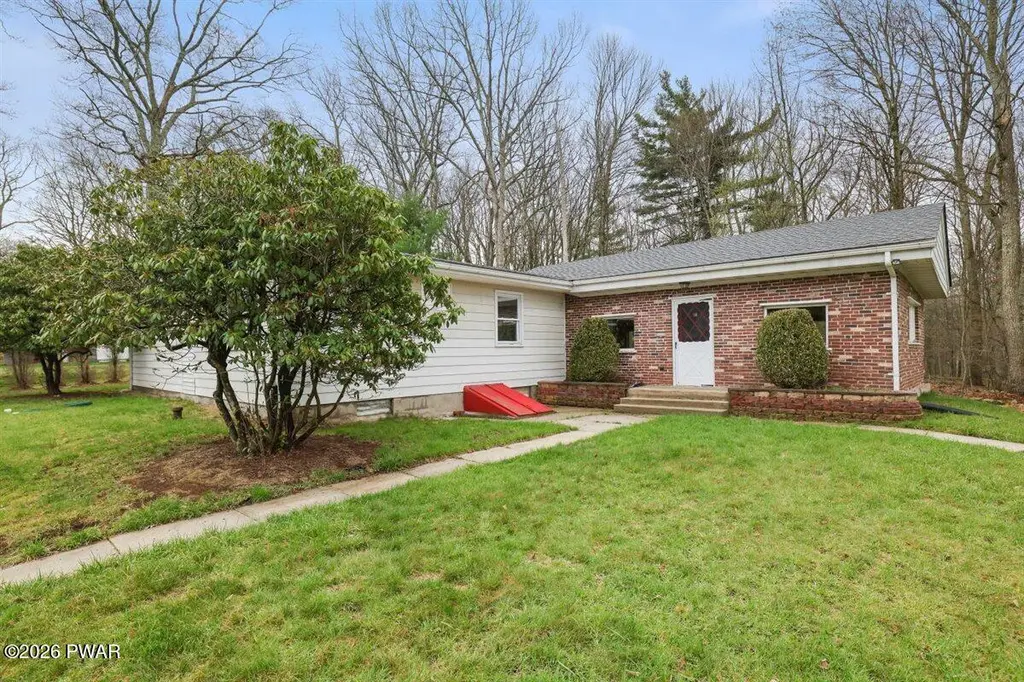
207 Sunset Hill Rd · Hawley, PA
Flood risk 1/10 · Minimal
- FEMA flood zone
- X (unshaded)
- Chance of flooding over 30 yrs
- 0.0%
- Est. flood insurance / yr
- $473 – $860
Fire risk 5/10 · Moderate
- Est. fire insurance / yr
- $511 – $949
Heat risk 3/10 · Minor
- Hot days now (above 90°F)
- 7 days/yr
- Hot days in 30 yrs
- 16 days/yr
Wind risk 3/10 · Minor
- Chance of severe wind over 30 yrs
- 4.0%
Air-quality risk 2/10 · Minimal
- Unhealthy air days now
- 1 days/yr
- Unhealthy air days in 30 yrs
- 1 days/yr
Risk factors via First Street. Map © Google.
Why this score? — see what drove the D+ grade
The composite is a weighted blend of 9 inputs, each scored 0–100. Each bar is that input's sub-score; the figure is the points it added to the 100-point composite (weight × sub-score).
- ARV discount +11.0/15.0
- Appreciation +10.0/10.0
- Cash flow +8.4/30.0
- Schools +4.2/10.0
- Livability +3.4/5.0
- Rent growth +2.5/5.0
- Condition / age +2.5/5.0
- 1% rule +2.3/10.0
- DSCR +2.3/10.0
$299,000
🖨 Deal sheet 📄 Offer letter ✓ Due diligence
Listing remarks MLS
This charming ranch style home is the perfect retreat just minutes from Lake Wallenpaupack! Nestled on a quiet street, it offers 3 bedrooms, 1 bath, wood floors throughout, a beautifully updated kitchen with tile backsplash, and a spacious family room plus large office space. Enjoy natural light from the picture window in the cozy living room, and take advantage of the full unfinished basement for storage or future living space. With a large yard, ample parking, and close proximity to Hawley and endless lake activities, this home has it all!
Key facts
- Large office space
- Large yard
- Ranch style home
Tags
Neighborhood map
What this means for you Summary
Snapshot
- This is a 2-bed/1.0-bath single-family listed at $299k.
Deal economics
- At list price, monthly cash flow is $-266 ($-3k/yr) — negative.
- To cash-flow at today's rent, offer at most $252k (15.7% below list).
- To meet the 1% rule (rent ≥ 1% of price), the offer needs to be $217k (27.4% below list).
- Recommended offer: $217k (27.4% below list) — sets the bar for 1% rule.
- Cap rate 5.2% vs local median 4.0% in Hawley — top-decile yield for the area; either an underpriced asset or a hidden risk that comps aren't pricing in. Stress-test before assuming the spread holds.
Location & tenants
- Location reads 68/100 on livability (#898 in PA) — a middle-class / working-renter tenant base. Strengths: crime A+, cost of living A+, housing A; Watch: schools C-, amenities F, commute F.
- Wallenpaupack Area SD (rural): math 39% / reading 59% proficiency, ranked #192 of 539 in PA (top 36%) — families likely to look elsewhere, expect single-tenant / working-renter base with shorter leases.
- Market conditions: 371 active listings in the ZIP; 213 units permitted in Pike County in 2024 (0 in 5+ unit buildings).
Forward outlook
- In year one you build about $32k of equity ($2k loan paydown + $30k appreciation (10.0% local appreciation)).
- Pike County population projected at -25% by 2050 — secular population decline; favor cash flow + early exit over multi-decade hold.
- By year 2, paydown + projected appreciation supports a ~$51k cash-out refi (75% LTV) — recoverable capital for the next deal without selling this one.
Negotiation context
- It's been on market 62 days — a 6% lower offer ($281k) is reasonable based on typical stale-listing flexibility.
- 3 sale attempts since 12y ago with the ask held roughly flat each time — persistent listings suggest the price (not the market) is what's stuck; bring a comps-based counter.
- Current owner paid $120k; list at $299k implies a 149% gain — meaningful room to come down on a strong offer.
Risks & watch-outs
- Climate carrying-cost: moderate wildfire risk — expect insurance premiums to compound above CPI over the hold.
Questions for the listing agent
- What do current leases actually rent for vs. the listed asking? Can we see a recent rent roll and the last 12 months of T-12 income?
- It's been on market 62 days. Have you received any prior offers? Is the seller open to a 27% concession, seller financing, or rate buy-down credit?
- Built in 1963 — when were the roof, HVAC, electrical panel, plumbing, and water heater last replaced?
- Why hasn't it sold? Are there any deal-killer items the seller is aware of (foundation, flood, title, zoning, code violations)?
- Is there a deadline driving the sale (1031 exchange, divorce, estate, relocation)? That informs how much negotiation room exists.
- The area grade is low — what's the realistic commute time and amenity access for the typical tenant pool here? Any planned neighborhood developments (good or bad) we should know about?
- What's the average days-on-market for RENTAL listings here right now (not sales)? A rising rental-DOM trend means longer vacancies and softer asking-rent achievability than the comps imply.
- What's the recent tenant-quality profile in this submarket — average credit score on applications, eviction rate, late-payment / NSF rate, and stable-employment percentage? A property-management company in the area should have these aggregated.
- How much new for-sale + rental construction is in the pipeline within 1–3 miles? Heavy new supply typically softens prices + rents 12–24 months out; constrained supply supports both.
Investment metrics
- 1% rule
- 0.73% ✗
- Cap rate
- 5.22%
- Cash-on-cash
- -3.81%
- DSCR
- 0.83
- GRM
- 11.5
CMA / ARV
- ARV (median comp)
- $323,936
- List price
- $299,000
- Delta
- -7.70%
- Verdict
- FAIR
- Comps
- 10 within 1.0 mi
Show comp detail 4 sales within ~0.75 mi
| Address | Dist | Beds/Ba | Sqft | Sold | Price | $/sf | Match |
|---|---|---|---|---|---|---|---|
| 410 Sunset Forest Dr | 0.16mi | 3/2.5 (+1) | 1,656 (-3%) | 1mo | $342,000 | $207 | 76 |
| 101 Aberle Ct | 0.12mi | 3/3.0 (+1) | 1,755 (+3%) | 15mo | $652,000 | $372 | 64 |
| 417 Sunset Forest Dr | 0.19mi | 3/1.5 (+1) | 1,517 (-11%) | 11mo | $382,500 | $252 | 57 |
| 121 First Tafton Rd | 0.71mi | 3/1.5 (+1) | 1,575 (-8%) | 14mo | $300,000 | $190 | 35 |
Match score weights: distance 35% · size 25% · config 20% · recency 20%. Top-matched comps best support the ARV.
Projected returns pro-forma
10.0% appreciation · 3.0% rent growth · sell at horizon
- IRR
- 21.6%
- Equity multiple
- 2.74×
- Total profit
- $145,871
- Equity at exit
- $269,363
- IRR
- 19.5%
- Equity multiple
- 6.29×
- Total profit
- $442,858
- Equity at exit
- $580,891
Cash invested: $83,720 (down + closing). Projections, not guarantees.
Landlord ↔ Tenant lean methodology
- Overall (STATE)
- 62 Landlord-Friendly
- State Pennsylvania
- 62 Landlord-Friendly · EVEN
- County
- — inherits STATE
- City
- — inherits STATE
ZIP-level market 18428
- Home prices YoY
- 9.2%
- Active inventory
- 371
- Price-to-rent
- 11.5×
Monthly cashflow live
- Estimated rent
- $2,170 medium interval (Pro) →
- Mortgage (P&I)
- −$1,568
- Tax from tax record
- −$288 /mo · $3,452/yr
- Insurance
- −$125
- HOA
- −$0
- Vacancy / Maint / Mgmt
- −$456
- Net cashflow
- $-266
Break-even live
UW: 25.0% down · 7.5% · 30yr · 1.5% tax · 5.0% vac · 8.0% maint · 8.0% mgmt
Financing live
Cash to close
- Down payment
- $74,750
- Closing costs
- $8,970
- Reserves months
- —
- Total cash needed
- —
Loan-product check · same deal, 3 products live
Conventional
25% down · 7.5% · 30yr
- Down + closing
- —
- Monthly P&I
- —
- Monthly cashflow
- —
- DSCR
- —
- Eligible?
- —
Personal DTI + credit; lowest rate.
DSCR
20% down · 8.5% · 30yr
- Down + closing
- —
- Monthly P&I
- —
- Monthly cashflow
- —
- DSCR
- —
- Eligible?
- —
No personal income docs; deal must DSCR.
Hard money
10% down · 12.0% · 12mo
- Down + closing
- —
- Monthly P&I
- —
- Monthly cashflow
- —
- DSCR
- —
- Eligible?
- —
Short-term bridge; refi at stabilization.
Listing history 22 events
-
2026-06-18days on market $299,000 Active 62 DOM
-
2026-06-17days on market $299,000 Active 61 DOM
-
2026-06-16days on market $299,000 Active 60 DOM
-
2026-06-15days on market $299,000 Active 59 DOM
-
2026-06-13days on market $299,000 Active 57 DOM
-
2026-06-13days on market $299,000 Active 56 DOM
-
2026-06-09days on market $299,000 Active 53 DOM
-
2026-06-08days on market $299,000 Active 52 DOM
-
2026-06-07days on market $299,000 Active 51 DOM
-
2026-06-04days on market $299,000 Active 48 DOM
-
2026-06-03days on market $299,000 Active 47 DOM
-
2026-06-02days on market $299,000 Active 46 DOM
-
2026-06-01days on market $299,000 Active 45 DOM
-
2026-05-31days on market $299,000 Active 44 DOM
-
2026-04-15$299,000 Active 547-char remark
Show marketing remark (547 chars)
This charming ranch style home is the perfect retreat just minutes from Lake Wallenpaupack! Nestled on a quiet street, it offers 3 bedrooms, 1 bath, wood floors throughout, a beautifully updated kitchen with tile backsplash, and a spacious family room plus large office space. Enjoy natural light from the picture window in the cozy living room, and take advantage of the full unfinished basement for storage or future living space. With a large yard, ample parking, and close proximity to Hawley and endless lake activities, this home has it all!
-
2025-06-17price $299,000
-
2025-05-16price $339,000
-
2025-05-02$349,000 Active
-
2015-04-27soldstatus $120,000
-
2015-04-27soldstatus $120,000
-
2014-04-30$120,000
-
2004-02-02soldstatus $67,500
ⓘ Source: listings_history table (triggers on properties + properties_extension) + one-shot
backfill from property_details.listing_events for pre-trigger history.
Tax reassessment forecast PA · Partial reset (capped growth)
- Current annual tax
- $3,452 · $288/mo
- Projected year-2 tax
- $4,088 · $341/mo
- Expected delta
- +$636/yr (+$53/mo · 18.4%)
ⓘ Screening estimate from a state-policy table — verify with the county assessor before closing.
Climate risk First Street
- Flood 1/10 Low FEMA zone X (unshaded) · 0% chance over 30 yrs
- Wildfire 5/10 Major
- Heat 3/10 Moderate 7 d/yr ≥90°F today · 16 d/yr by 30 yrs out
- Wind 3/10 Moderate 4% chance of damaging wind over 30 yrs
- Air quality 2/10 Low 1 unhealthy d/yr today · 1 by 30 yrs out
Nearby sold comps map
Loading sold comps map…
Walkable amenities ~0.75 mi
Loading nearby amenities…
Taxation est. · year 1
- Rental income
- $26,036
- − Mortgage interest
- −$16,749
- − Property taxes
- −$3,452
- − Insurance
- −$1,495
- − Repairs & maintenance
- −$2,083
- − Management
- −$2,083
- − Depreciation
- −$8,698
- Taxable loss
- −$8,523
- Est. tax savings @ 24.0%
- +$2,046
- After-tax cash flow
- $-1,148/yr
For passive investors: Depreciation is non-cash, so a rental often shows a tax loss while cash-flowing — sheltering income. Rental losses are passive: they offset passive income freely, and up to $25,000/yr can offset ordinary (W-2) income if you actively participate and your MAGI is under $100k (phasing out to $0 by $150k); unused losses carry forward. On sale, claimed depreciation is recaptured at up to 25%, and gains may owe capital-gains tax (a 1031 exchange can defer both). Figures are a year-1 estimate at your 24.0% rate — not tax advice; consult a CPA.
Schools (NCES district)
- District
- Wallenpaupack Area SD
- NCES district ID
- 4224750
- Math proficiency
- 39% ▼ -10.00%
- Reading proficiency
- 59% ▼ -5.00%
- Median HH income
- $51,027
- Composite
- 41.97/100
- National rank
- #3345
- State rank
- #192 of 539 in PA
Livability — Hawley
- Score
- 68/100
- State rank
- #898
- US rank
- #9570
Category grades
Schools grade is shown separately in the Schools card above.
Census & demographics
- Population (ZIP)
- 12,446
Population outlook (Pike County) Hauer SSP2
- Today (2025)
- 53,548 people
- By 2030
- 51,622 · -3.6%
- By 2040
- 46,490 · -13.2%
- By 2050
- 40,372 · -24.6%
- By 2075
- 31,951 · -40.3%
- By 2100
- 26,821 · -49.9%
Race, ethnicity, and origin ACS 2023
- Neighborhood character
- Predominantly White (85%)
- Race & ethnicity
- White 85% Hispanic / Latino 8% Two or more races 6% Black 1% Asian 1%
- Hispanic origin (detail)
- Puerto Rican 5%
- Common ancestry
- Romanian 5% Portuguese 3% Italian 2%
- Foreign-born
- 5% · Canada
- Languages at home
- 91% English-only · Spanish 5% Russian/Polish/Slavic 1% Other Asian/Pacific 1%
Political lean MEDSL · Pike
- 2024 margin
- Strong R (+24.1) · D 37.6% · R 61.6%
- 2008→2024 swing
- -19.8pp toward R · 2008: -4.2pp · 2024: -24.1pp
- All cycles
- 2024: R+24.1 2020: R+19.0 2016: R+26.0 2012: R+11.0 2008: R+4.2
Not yet ingested
- Civics
- —
Market trends
- HPI YoY
- ▲ 28.60%
- Current HPI
- 340.8254
- Rent YoY
- —
- Metro
- —
- State GDP YoY
- ▲ 1.68%
- F500 in state
- 34
Industry mix (Fortune 500 HQ in PA)
| Industry | F500 HQs | Revenue |
|---|---|---|
| Healthcare | 2 | $309B |
|
||
| Insurance | 2 | $27B |
|
||
| Telecommunications / Media | 1 | $124B |
|
||
| Industrial Distribution | 1 | $22B |
|
||
| Financial Services | 1 | $20B |
|
||
| Chemicals / Materials | 1 | $18B |
|
||
Price history
+343.0% since first listed8 events — show timeline
- 2026-04-15 Listed $299,000 PWMLS
- 2025-06-17 Price Changed $299,000 PWMLS
- 2025-05-16 Price Changed $339,000 PWMLS
- 2025-05-02 Listed $349,000 PWMLS
- 2015-04-27 Sold (Public Records) $120,000 Public Records
- 2015-04-27 Sold (MLS) $120,000 PWMLS
- 2014-04-30 Listed $120,000 PWMLS
- 2004-02-02 Sold (Public Records) $67,500 Public Records
Property tax history
+3.0%/yrLatest (2026): $3,452 · +3.5% YoY. Source: county tax records.
Cash-flow waterfall
monthlySold comps — $/sqft
last 12 mo · ≤1 miLoading sold comps…