212 6th Ave W · Buckeye, AZ
Flood risk 6/10 · Moderate
- FEMA flood zone
- X (shaded)
- Chance of flooding over 30 yrs
- 0.98%
- Est. flood insurance / yr
- $507 – $1,088
Fire risk 2/10 · Minimal
- Est. fire insurance / yr
- $610 – $1,132
Heat risk 9/10 · Severe
- Hot days now (above 115°F)
- 7 days/yr
- Hot days in 30 yrs
- 19 days/yr
Wind risk 1/10 · Minimal
- Chance of severe wind over 30 yrs
- —
Air-quality risk 1/10 · Minimal
- Unhealthy air days now
- 0 days/yr
- Unhealthy air days in 30 yrs
- 0 days/yr
Risk factors via First Street. Map © Google.
Why this score? — see what drove the C+ grade
The composite is a weighted blend of 9 inputs, each scored 0–100. Each bar is that input's sub-score; the figure is the points it added to the 100-point composite (weight × sub-score).
- Cash flow +25.5/30.0
- ARV discount +15.0/15.0
- DSCR +8.5/10.0
- 1% rule +5.4/10.0
- Livability +3.4/5.0
- Condition / age +2.5/5.0
- Rent growth +2.3/5.0
- Schools +2.3/10.0
- Appreciation +0.0/10.0
$184,000
🖨 Deal sheet 📄 Offer letter ✓ Due diligence
Listing remarks MLS
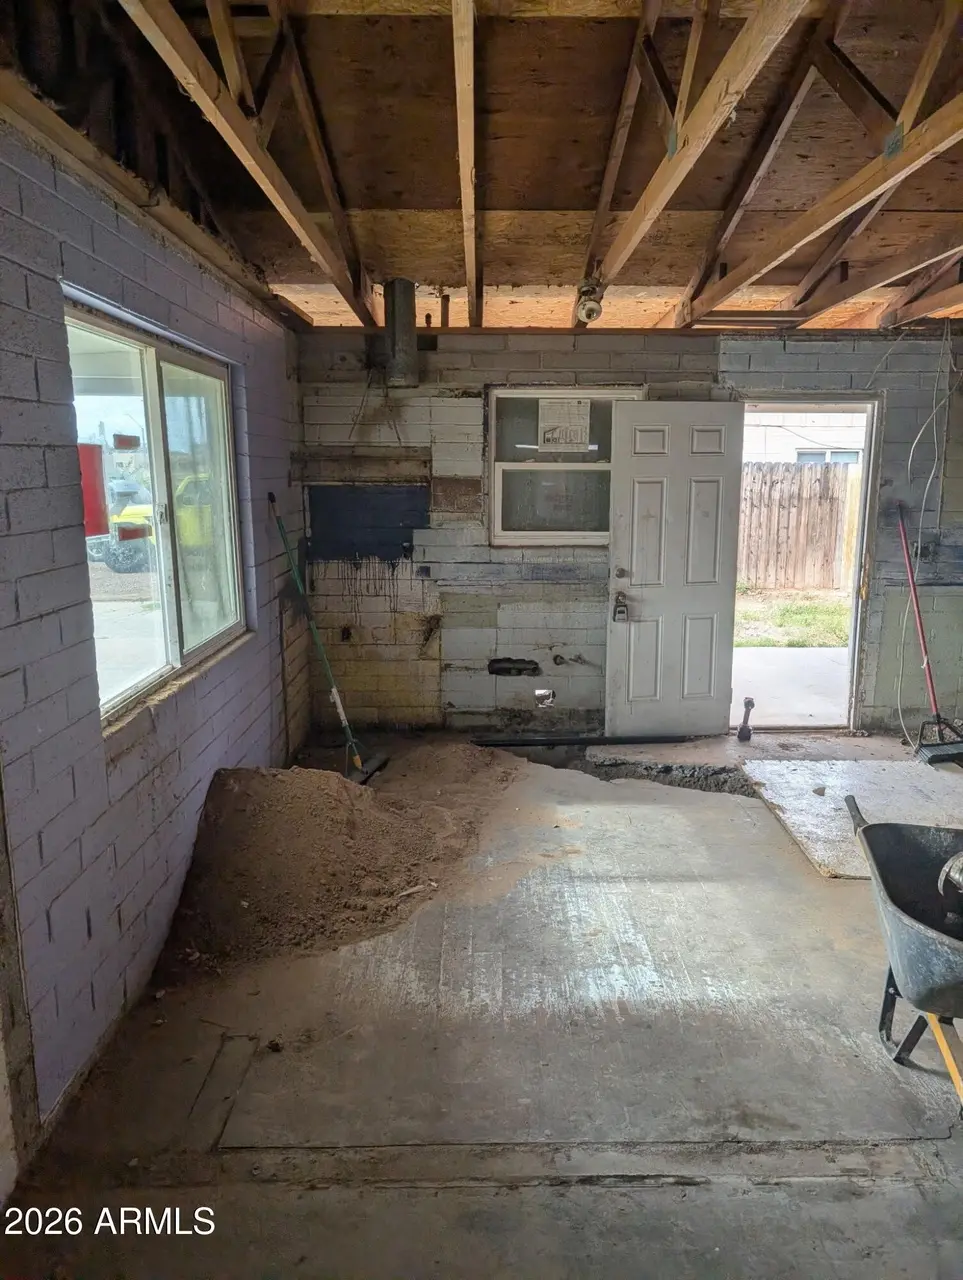
CASH INVESTORS ONLY. Have you ever walked into a house and thought, ''I love the layout, but I really wish I could see the literal skeleton of the building''? Well, friend, today is your lucky day. The demo is done (seller invested approx $40,000 in demo), the debris is gone, and the potential is screaming at you from between the 2x4s. This isn't just a house; it's an adorable little home currently in its ''awkward teenage phase'' waiting for you to give it a glow-up. Bring your tool belt, your imagination, and maybe a flashlight. Your HGTV debut starts here.
Key facts
- 8,636 sq ft lot
- 3 parking spots
- Built 1975
Neighborhood map
What this means for you Summary
Snapshot
- This is a 3-bed/2.0-bath single-family listed at $184k.
Deal economics
- At list price, monthly cash flow is $431 ($5k/yr) — positive.
- The deal already cash-flows at list — no discount required.
- Meets the 1% rule at list price ($2k rent vs $184k).
- Recommended offer: $178k (3.0% below list) — sets the bar for market timing.
- Cap rate 9.1% vs local median 3.1% in Buckeye — top-decile yield for the area; either an underpriced asset or a hidden risk that comps aren't pricing in. Stress-test before assuming the spread holds.
Location & tenants
- Location reads 68/100 on livability (#53 in AZ) — a middle-class / working-renter tenant base. Strengths: employment A+, housing A+, crime A; Watch: schools D+, amenities F, commute F.
- Buckeye Union High School District (4284) (town): math 21% / reading 29% proficiency, ranked #129 of 249 in AZ (top 52%) — low school quality limits family demand, transient renter base, plan for 1-2y turnover.
- Market conditions: Rents soft (-0.9%/yr); 1196 active listings in the ZIP; 14 comparable units currently listed for rent nearby; rentals leasing fast (median 2d on market — plan ~1-2 weeks tenant-placement turnaround); solid renter incomes; 36,011 units permitted in Maricopa County in 2024 (12,801 in 5+ unit buildings).
Forward outlook
- Local home prices are declining (-3.0%/yr); year-one equity from $1k of loan paydown is wiped out by about $6k of value loss. Plan a longer hold.
- Maricopa County population projected at +38% by 2050 — long-run rental-demand tailwind backs the buy-and-hold thesis.
Negotiation context
- It's been on market 55 days — a 3% lower offer ($178k) is reasonable based on typical stale-listing flexibility.
- 2 sale attempts with the ask held roughly flat each time — persistent listings suggest the price (not the market) is what's stuck; bring a comps-based counter.
Risks & watch-outs
- Climate carrying-cost: major flood risk; extreme-heat days projected 7→19/yr by 2055 (HVAC capex compounding) — expect insurance premiums to compound above CPI over the hold.
Questions for the listing agent
- It's been on market 55 days. Have you received any prior offers? Is the seller open to a 3% concession, seller financing, or rate buy-down credit?
- Built in 1975 — when were the roof, HVAC, electrical panel, plumbing, and water heater last replaced?
- Is there a deadline driving the sale (1031 exchange, divorce, estate, relocation)? That informs how much negotiation room exists.
- Schools are D-rated, which usually means shorter tenancies and higher turnover. Who's the typical renter profile here, and what's been the actual vacancy rate?
- What's the average days-on-market for RENTAL listings here right now (not sales)? A rising rental-DOM trend means longer vacancies and softer asking-rent achievability than the comps imply.
- What's the recent tenant-quality profile in this submarket — average credit score on applications, eviction rate, late-payment / NSF rate, and stable-employment percentage? A property-management company in the area should have these aggregated.
- How much new for-sale + rental construction is in the pipeline within 1–3 miles? Heavy new supply typically softens prices + rents 12–24 months out; constrained supply supports both.
Investment metrics
- 1% rule
- 1.04% ✓
- Cap rate
- 9.11%
- Cash-on-cash
- 10.04%
- DSCR
- 1.45
- GRM
- 8.0
CMA / ARV
- ARV (median comp)
- $315,153
- List price
- $184,000
- Delta
- -41.62%
- Verdict
- UNDERPRICED
- Comps
- 20 within 1.0 mi
Show comp detail 12 sales within ~0.75 mi
| Address | Dist | Beds/Ba | Sqft | Sold | Price | $/sf | Match |
|---|---|---|---|---|---|---|---|
| 211 W Maricopa Rd | 0.18mi | 3/2.0 | 1,209 (+8%) | 1mo | $260,000 | $215 | 78 |
| 401 5th Ave | 0.28mi | 3/2.0 | 1,064 (-5%) | 2mo | $183,000 | $172 | 77 |
| 109 5th Ave E | 0.41mi | 3/1.0 | 1,131 (+1%) | 6mo | $280,000 | $248 | 70 |
| 1102 N 5th St | 0.21mi | 3/2.0 | 1,238 (+10%) | 6mo | $288,660 | $233 | 68 |
| 24612 W ST Catherine Ave | 0.65mi | 3/2.0 | 1,115 (-0%) | 2mo | $328,900 | $295 | 67 |
| 24636 W ST Catherine Ave | 0.63mi | 3/2.0 | 1,115 (-0%) | 4mo | $327,900 | $294 | 66 |
| 24610 W ST Anne Ave | 0.61mi | 3/2.0 | 1,244 (+11%) | 2mo | $343,900 | $276 | 52 |
| 24593 W ST Catherine Ave | 0.65mi | 3/2.0 | 1,244 (+11%) | 1mo | $349,900 | $281 | 50 |
| 24592 W ST Anne Ave | 0.63mi | 3/2.0 | 1,244 (+11%) | 5mo | $343,900 | $276 | 48 |
| 24624 W ST Catherine Ave | 0.64mi | 3/2.0 | 1,244 (+11%) | 6mo | $343,900 | $276 | 47 |
| 24606 W ST Catherine Ave | 0.66mi | 3/2.0 | 1,244 (+11%) | 6mo | $343,900 | $276 | 46 |
| 409 E Narramore Ave | 0.65mi | 2/1.0 (-1) | 955 (-15%) | 5mo | $220,000 | $230 | 32 |
Match score weights: distance 35% · size 25% · config 20% · recency 20%. Top-matched comps best support the ARV.
Projected returns pro-forma
-3.0% appreciation · 0.0% rent growth · sell at horizon
- IRR
- -4.3%
- Equity multiple
- 0.84×
- Total profit
- $-8,061
- Equity at exit
- $27,435
- IRR
- 1.9%
- Equity multiple
- 1.12×
- Total profit
- $6,261
- Equity at exit
- $15,909
Cash invested: $51,520 (down + closing). Projections, not guarantees.
Landlord ↔ Tenant lean methodology
- Overall (STATE)
- 87 Strongly Landlord-Friendly
- State Arizona
- 87 Strongly Landlord-Friendly · R+3
- County
- — inherits STATE
- City
- — inherits STATE
ZIP-level market 85326
- Home prices YoY
- -32.5%
- Rents YoY
- -0.9%
- Active inventory
- 1196
- Price-to-rent
- 8.0×
Monthly cashflow live
- Estimated rent
- $1,919 high interval (Pro) →
- Mortgage (P&I)
- −$965
- Tax from tax record
- −$43 /mo · $521/yr
- Insurance
- −$77
- HOA
- −$0
- Vacancy / Maint / Mgmt
- −$403
- Net cashflow
- $431
Break-even live
UW: 25.0% down · 7.5% · 30yr · 1.5% tax · 5.0% vac · 8.0% maint · 8.0% mgmt
Financing live
Cash to close
- Down payment
- $46,000
- Closing costs
- $5,520
- Reserves months
- —
- Total cash needed
- —
Loan-product check · same deal, 3 products live
Conventional
25% down · 7.5% · 30yr
- Down + closing
- —
- Monthly P&I
- —
- Monthly cashflow
- —
- DSCR
- —
- Eligible?
- —
Personal DTI + credit; lowest rate.
DSCR
20% down · 8.5% · 30yr
- Down + closing
- —
- Monthly P&I
- —
- Monthly cashflow
- —
- DSCR
- —
- Eligible?
- —
No personal income docs; deal must DSCR.
Hard money
10% down · 12.0% · 12mo
- Down + closing
- —
- Monthly P&I
- —
- Monthly cashflow
- —
- DSCR
- —
- Eligible?
- —
Short-term bridge; refi at stabilization.
Rent comps 14 comps
| Address | Beds | Baths | Sqft | Rent | $/sqft | DOM | Units | Dist |
|---|---|---|---|---|---|---|---|---|
| 220 4th Ave W Unit 2 Buckeye, AZ | 3.0 | 2.0 | 1000 | $2,000 | $2.00 | 1d | 1 | 0.10mi |
| 95 5th Ave W Buckeye, AZ | 3.0 | 2.0 | 1410 | $1,700 | $1.21 | 1d | 1 | 0.27mi |
| 83 5th Ave W Buckeye, AZ | 3.0 | 2.0 | 1238 | $1,669 | $1.35 | 44d | 1 | 0.31mi |
| 220 4th Ave E Unit 1 Buckeye, AZ | 3.0 | 2.0 | 1000 | $2,000 | $2.00 | 1d | 1 | 0.59mi |
| 25201 W MC 85 Buckeye, AZ | 2.0–3.0 | 2.0 | 1117 | $1,753 | $1.57 | 2d | 14 | 0.86mi |
| 202 S 2nd St Unit 2ndSt202-2 Buckeye, AZ | 2.0 | 1.0 | 700 | $1,200 | $1.71 | 44d | 1 | 0.91mi |
| 25067 W Dove Trail Buckeye, AZ | 3.0 | 2.0 | 1460 | $1,800 | $1.23 | 10d | 1 | 0.98mi |
| 24934 W Dove Trail Buckeye, AZ | 4.0 | 2.0 | 1460 | $1,695 | $1.16 | 24d | 1 | 1.01mi |
| 180 N Apache Rd Buckeye, AZ | 2.0 | 1.0–2.0 | 900 | $1,496 | $1.66 | 1d | 3 | 1.02mi |
| 212 E Centre Ave Buckeye, AZ | 3.0 | 1.0 | 784 | $1,150 | $1.47 | 44d | 1 | 1.03mi |
| 1022 E Narramore Ave Buckeye, AZ | 1.0–2.0 | 1.0–2.0 | 735 | $1,350 | $1.84 | 1d | 3 | 1.08mi |
| 450 N Apache Rd Buckeye, AZ | 1.0–2.0 | 1.0–2.0 | 763 | $1,599 | $2.10 | 1d | 34 | 1.16mi |
| 25157 W Beloat Rd Buckeye, AZ | 2.0–3.0 | 2.0 | 977 | $1,799 | $1.84 | 1d | 9 | 1.34mi |
| 25841 W Valley View Dr Buckeye, AZ | 3.0 | 2.0 | 1341 | $1,609 | $1.20 | 44d | 1 | 1.49mi |
Listing history 15 events
-
2026-06-15days on market $184,000 Active 55 DOM
-
2026-06-13days on market $184,000 Active 53 DOM
-
2026-06-13days on market $184,000 Active 52 DOM
-
2026-06-09days on market $184,000 Active 49 DOM
-
2026-06-08days on market $184,000 Active 48 DOM
-
2026-06-07days on market $184,000 Active 47 DOM
-
2026-06-04days on market $184,000 Active 44 DOM
-
2026-06-03days on market $184,000 Active 43 DOM
-
2026-06-02days on market $184,000 Active 42 DOM
-
2026-06-01days on market $184,000 Active 41 DOM
-
2026-05-31days on market $184,000 Active 40 DOM
-
2026-04-21$184,000 Active 568-char remark
Show marketing remark (568 chars)
CASH INVESTORS ONLY. Have you ever walked into a house and thought, ''I love the layout, but I really wish I could see the literal skeleton of the building''? Well, friend, today is your lucky day. The demo is done (seller invested approx $40,000 in demo), the debris is gone, and the potential is screaming at you from between the 2x4s. This isn't just a house; it's an adorable little home currently in its ''awkward teenage phase'' waiting for you to give it a glow-up. Bring your tool belt, your imagination, and maybe a flashlight. Your HGTV debut starts here.
-
2025-03-25soldstatus $170,500
-
2025-02-24historical
-
2025-02-23$189,990 Active
ⓘ Source: listings_history table (triggers on properties + properties_extension) + one-shot
backfill from property_details.listing_events for pre-trigger history.
Tax reassessment forecast AZ · Resets to sale price
- Current annual tax
- $521 · $43/mo
- Projected year-2 tax
- $1,214 · $101/mo
- Expected delta
- +$694/yr (+$58/mo · 133.3%)
ⓘ Screening estimate from a state-policy table — verify with the county assessor before closing.
Climate risk First Street
- Flood 6/10 Major FEMA zone X (shaded) · 98% chance over 30 yrs
- Wildfire 2/10 Low
- Heat 9/10 Extreme 7 d/yr ≥115°F today · 19 d/yr by 30 yrs out
- Wind 1/10 Low
- Air quality 1/10 Low 0 unhealthy d/yr today · 0 by 30 yrs out
Nearby sold comps map
Loading sold comps map…
Walkable amenities ~0.75 mi
Loading nearby amenities…
Taxation est. · year 1
- Rental income
- $23,031
- − Mortgage interest
- −$10,307
- − Property taxes
- −$521
- − Insurance
- −$920
- − Repairs & maintenance
- −$1,842
- − Management
- −$1,842
- − Depreciation
- −$5,353
- Taxable income
- $2,246
- Est. tax owed @ 24.0%
- −$539
- After-tax cash flow
- $4,636/yr
For passive investors: Depreciation is non-cash, so a rental often shows a tax loss while cash-flowing — sheltering income. Rental losses are passive: they offset passive income freely, and up to $25,000/yr can offset ordinary (W-2) income if you actively participate and your MAGI is under $100k (phasing out to $0 by $150k); unused losses carry forward. On sale, claimed depreciation is recaptured at up to 25%, and gains may owe capital-gains tax (a 1031 exchange can defer both). Figures are a year-1 estimate at your 24.0% rate — not tax advice; consult a CPA.
Schools (NCES district)
- District
- Buckeye Union High School District (4284)
- NCES district ID
- 0401410
- Math proficiency
- 21% ▼ -30.00%
- Reading proficiency
- 29% ▼ -8.00%
- Median HH income
- $59,182
- Composite
- 22.91/100
- National rank
- #7995
- State rank
- #129 of 249 in AZ
Livability — Buckeye
- Score
- 68/100
- State rank
- #53
- US rank
- #9428
Category grades
Schools grade is shown separately in the Schools card above.
Census & demographics
- Census place
- Buckeye, AZ
- County
- Maricopa County · 4,537,380 people
- City population
- 117,540
- Metro
- Phoenix-Mesa-Chandler, AZ
- Population (ZIP)
- 75,359
- Household income
- $89,876
- Rent vs Own
- Severe rent burden
- 661.0
Population outlook (Maricopa County) Hauer SSP2
- Today (2025)
- 4,979,203 people
- By 2030
- 5,378,229 · +8.0%
- By 2040
- 6,156,598 · +23.6%
- By 2050
- 6,872,376 · +38.0%
- By 2075
- 8,401,270 · +68.7%
- By 2100
- 9,247,439 · +85.7%
Race, ethnicity, and origin ACS 2023
- Neighborhood character
- Diverse neighborhood (Simpson 0.60)
- Race & ethnicity
- Hispanic / Latino 50% White 38% Two or more races 13% Black 7% Native American 2% Asian 1%
- Hispanic origin (detail)
- Mexican 44%
- Common ancestry
- Lithuanian 2% Slovak 1% Italian 1%
- Foreign-born
- 12% · Canada
- Languages at home
- 66% English-only · Spanish 32%
Political lean MEDSL · Maricopa
- 2024 margin
- Toss-up / Even · D 47.7% · R 51.2% · Other 1.1%
- 2008→2024 swing
- +7.1pp toward D · 2008: -10.6pp · 2024: -3.5pp
- All cycles
- 2024: R+3.5 2020: D+2.2 2016: R+3.5 2012: R+12.0 2008: R+10.6
Not yet ingested
- Civics
- —
Market trends
- HPI YoY
- ▼ -138.00%
- Current HPI
- 286.9242
- Rent YoY
- ▼ -0.92%
- Metro
- Phoenix-Mesa-Chandler, AZ
- State GDP YoY
- ▲ 4.54%
- F500 in state
- 20
Industry mix (Fortune 500 HQ in AZ)
| Industry | F500 HQs | Revenue |
|---|---|---|
| Technology | 2 | $13B |
|
||
| Mining / Metals | 1 | $23B |
|
||
| Environmental Services | 1 | $16B |
|
||
| Metals / Steel | 1 | $14B |
|
||
| Technology Distribution | 1 | $9B |
|
||
| Homebuilding | 1 | $8B |
|
||
Price history
-3.2% since first listed4 events — show timeline
- 2026-04-21 Listed $184,000 ARMLS
- 2025-03-25 Sold (Public Records) $170,500 Public Records
- 2025-02-24 Listing Removed — ARMLS
- 2025-02-23 Listed $189,990 ARMLS
Property tax history
+7.5%/yrLatest (2025): $521 · +6859.9% YoY. Source: county tax records.
Cash-flow waterfall
monthlySold comps — $/sqft
last 12 mo · ≤1 miLoading sold comps…