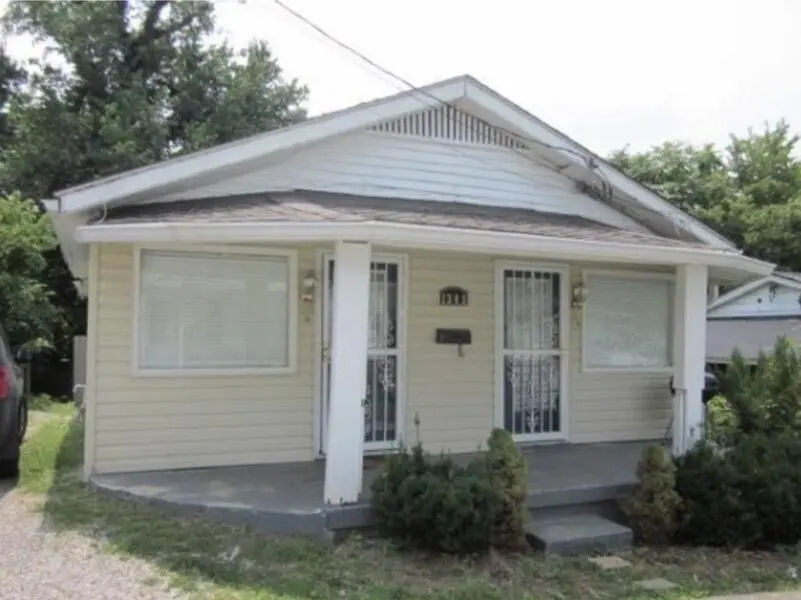
1346 Ohio Ter · Lexington-Fayette, KY
Flood risk 1/10 · Minimal
- FEMA flood zone
- X (unshaded)
- Chance of flooding over 30 yrs
- 0.0%
- Est. flood insurance / yr
- $507 – $1,088
Fire risk 1/10 · Minimal
- Est. fire insurance / yr
- $839 – $1,559
Heat risk 4/10 · Minor
- Hot days now (above 101°F)
- 7 days/yr
- Hot days in 30 yrs
- 19 days/yr
Wind risk 2/10 · Minimal
- Chance of severe wind over 30 yrs
- 1.0%
Air-quality risk 2/10 · Minimal
- Unhealthy air days now
- 0 days/yr
- Unhealthy air days in 30 yrs
- 2 days/yr
Risk factors via First Street. Map © Google.
Why this score? — see what drove the C- grade
The composite is a weighted blend of 9 inputs, each scored 0–100. Each bar is that input's sub-score; the figure is the points it added to the 100-point composite (weight × sub-score).
- Cash flow +18.5/30.0
- ARV discount +12.7/15.0
- DSCR +5.8/10.0
- Rent growth +5.0/5.0
- 1% rule +3.7/10.0
- Schools +3.4/10.0
- Livability +2.5/5.0
- Condition / age +2.5/5.0
- Appreciation +0.0/10.0
$179,900
🖨 Deal sheet 📄 Offer letter ✓ Due diligence
Listing remarks MLS
~~~This is a great income producing investment!~~~ New Price! Bring an offer! Home has been redone in the inside!! These are some of the updates in 2010: Heating/Air, appliances, Water Heater, Flooring (vinyl in kitchen & bath, hardwood throughout the rest of the house), Master bedroom has a bath and a walk in closet, light fixtures, cabinets, doors and it is all ELECTRIC!! Selling as is, inspections welcome per seller.
Key facts
- 2,090 sq ft lot
- Built 1930
- Listed 54 days
Property features AI
Exterior
- Utilities: Electricity connected
- Home design: Approximately 2,100 total building area
- Exterior features: Shingle roof
Interior
- Bathrooms: 2 full bathrooms
- Heating & cooling: Electric heating with heat pump; Electric cooling
- Interior features: Residential zoning
Neighborhood map
What this means for you Summary
Snapshot
- This is a 3-bed/2.0-bath single-family listed at $180k.
Deal economics
- At list price, monthly cash flow is $172 ($2k/yr) — positive.
- The deal already cash-flows at list — no discount required.
- To meet the 1% rule (rent ≥ 1% of price), the offer needs to be $156k (13.4% below list).
- Recommended offer: $156k (13.4% below list) — sets the bar for 1% rule.
- Cap rate 7.4% vs local median 3.8% in Lexington-Fayette — top-decile yield for the area; either an underpriced asset or a hidden risk that comps aren't pricing in. Stress-test before assuming the spread holds.
Location & tenants
- Location reads: area grade C — affects rentability + tenant quality, not the cash-flow math above.
- Fayette County (urban): math 35% / reading 45% proficiency, ranked #27 of 165 in KY (top 16%) — families likely to look elsewhere, expect single-tenant / working-renter base with shorter leases.
- Zoned schools: William Wells Brown Elementary (math 8% / reading 12%, grade F, #648 of 676 statewide, top 98%, 308 students, 86% FRL); Lexington Trad Magnet School (math 11% / reading 29%, grade F, #206 of 217 statewide, top 95%, 296 students, 81% FRL); Lafayette High School (math 47% / reading 54%, grade D+, #10 of 254 statewide, top 4%, 2,432 students, 38% FRL) — zoned schools average 68% FRL vs 44% district-wide (24 pts higher); higher-poverty schools than district average — tighter screening recommended.
- Zoned-school proficiency averages 27% at this address vs 40% district-wide (-13 pts) — the specific schools serving this property underperform the Fayette County average; the district grade overstates school quality for this exact location.
- Market conditions: Rents rising fast (+11.8%/yr); 82 active listings in the ZIP; 40 comparable units currently listed for rent nearby; rentals at typical pace (median 24d on market — plan ~3-4 weeks tenant-placement turnaround); lower-income renter base — watch delinquency; 1,036 units permitted in Fayette County in 2024 (542 in 5+ unit buildings).
Forward outlook
- Local home prices are declining (-3.0%/yr); year-one equity from $1k of loan paydown is wiped out by about $5k of value loss. Plan a longer hold.
- Fayette County population projected at +35% by 2050 — long-run rental-demand tailwind backs the buy-and-hold thesis.
- At projected returns (-3.0% appreciation + 8.0% rent growth), your $50k cash investment doubles in ~10 years — after that, you're playing with house money.
Negotiation context
- It's been on market 55 days — a 3% lower offer ($175k) is reasonable based on typical stale-listing flexibility.
- 4 sale attempts since 18y ago; this cycle's ask has dropped $10k (5%) from the opening price — seller is motivated, your offer sets the floor, not the list.
- Current owner paid $16k; list at $180k implies a 1024% gain — meaningful room to come down on a strong offer.
Risks & watch-outs
- Watch-outs: built in 1930 — expect roof / HVAC / electrical / plumbing capex.
Questions for the listing agent
- It's been on market 55 days. Have you received any prior offers? Is the seller open to a 13% concession, seller financing, or rate buy-down credit?
- Built in 1930 — when were the roof, HVAC, electrical panel, plumbing, and water heater last replaced?
- Is there a deadline driving the sale (1031 exchange, divorce, estate, relocation)? That informs how much negotiation room exists.
- What's the average days-on-market for RENTAL listings here right now (not sales)? A rising rental-DOM trend means longer vacancies and softer asking-rent achievability than the comps imply.
- What's the recent tenant-quality profile in this submarket — average credit score on applications, eviction rate, late-payment / NSF rate, and stable-employment percentage? A property-management company in the area should have these aggregated.
- How much new for-sale + rental construction is in the pipeline within 1–3 miles? Heavy new supply typically softens prices + rents 12–24 months out; constrained supply supports both.
Investment metrics
- 1% rule
- 0.87% ✗
- Cap rate
- 7.44%
- Cash-on-cash
- 4.11%
- DSCR
- 1.18
- GRM
- 9.6
CMA / ARV
- ARV (on-the-fly)
- $203,304
- Comps found
- 12
Show comp detail 12 sales within ~0.75 mi
| Address | Dist | Beds/Ba | Sqft | Sold | Price | $/sf | Match |
|---|---|---|---|---|---|---|---|
| 570 Ohio St | 0.09mi | 3/2.0 | 1,014 (-2%) | 1mo | $145,000 | $143 | 92 |
| 635 N Martin Luther King Blvd | 0.22mi | 3/1.0 | 1,035 (+0%) | 2mo | $185,000 | $179 | 83 |
| 650 N Martin Luther King Blvd | 0.20mi | 3/2.0 | 1,090 (+6%) | 3mo | $215,000 | $197 | 78 |
| 1011 Highland Park Dr | 0.59mi | 3/2.0 | 1,044 (+1%) | 1mo | $213,000 | $204 | 70 |
| 443 Ohio St | 0.30mi | 2/1.0 (-1) | 1,063 (+3%) | 3mo | $151,000 | $142 | 69 |
| 443 Chestnut St | 0.30mi | 3/1.0 | 1,144 (+11%) | 1mo | $109,900 | $96 | 63 |
| 1211 Bryan Ave | 0.70mi | 3/1.0 | 1,056 (+2%) | 0mo | $120,000 | $114 | 59 |
| 220 W 6th St | 0.49mi | 2/2.0 (-1) | 960 (-7%) | 4mo | $221,000 | $230 | 57 |
| 336 Ohio St | 0.46mi | 2/1.0 (-1) | 1,100 (+7%) | 4mo | $159,990 | $145 | 56 |
| 751 Dakota St | 0.57mi | 2/1.5 (-1) | 930 (-10%) | 1mo | $205,000 | $220 | 49 |
| 126 Devonia Ave | 0.67mi | 3/1.5 | 924 (-10%) | 1mo | $225,000 | $244 | 48 |
| 636 Locust Ave | 0.74mi | 3/1.5 | 918 (-11%) | 1mo | $220,000 | $240 | 44 |
Match score weights: distance 35% · size 25% · config 20% · recency 20%. Top-matched comps best support the ARV.
Projected returns pro-forma
-3.0% appreciation · 8.0% rent growth · sell at horizon
- IRR
- -5.1%
- Equity multiple
- 0.80×
- Total profit
- $-10,024
- Equity at exit
- $26,824
- IRR
- 9.2%
- Equity multiple
- 1.84×
- Total profit
- $42,530
- Equity at exit
- $15,554
Cash invested: $50,372 (down + closing). Projections, not guarantees.
Landlord ↔ Tenant lean methodology
- Overall (STATE)
- 83 Strongly Landlord-Friendly
- State Kentucky
- 83 Strongly Landlord-Friendly · R+16
- County
- — inherits STATE
- City
- — inherits STATE
ZIP-level market 40508
- Rents YoY
- 11.8%
- Active inventory
- 82
- Price-to-rent
- 9.6×
Monthly cashflow live
- Estimated rent
- $1,558 high interval (Pro) →
- Mortgage (P&I)
- −$943
- Tax from tax record
- −$40 /mo · $483/yr
- Insurance
- −$75
- HOA
- −$0
- Vacancy / Maint / Mgmt
- −$327
- Net cashflow
- $172
Break-even live
UW: 25.0% down · 7.5% · 30yr · 1.5% tax · 5.0% vac · 8.0% maint · 8.0% mgmt
Financing live
Cash to close
- Down payment
- $44,975
- Closing costs
- $5,397
- Reserves months
- —
- Total cash needed
- —
Loan-product check · same deal, 3 products live
Conventional
25% down · 7.5% · 30yr
- Down + closing
- —
- Monthly P&I
- —
- Monthly cashflow
- —
- DSCR
- —
- Eligible?
- —
Personal DTI + credit; lowest rate.
DSCR
20% down · 8.5% · 30yr
- Down + closing
- —
- Monthly P&I
- —
- Monthly cashflow
- —
- DSCR
- —
- Eligible?
- —
No personal income docs; deal must DSCR.
Hard money
10% down · 12.0% · 12mo
- Down + closing
- —
- Monthly P&I
- —
- Monthly cashflow
- —
- DSCR
- —
- Eligible?
- —
Short-term bridge; refi at stabilization.
Rent comps 40 comps
| Address | Beds | Baths | Sqft | Rent | $/sqft | DOM | Units | Dist |
|---|---|---|---|---|---|---|---|---|
| 658 Elm Tree Ln Lexington, KY | 3.0 | 2.0 | 1350 | $1,800 | $1.33 | 23d | 1 | 0.05mi |
| 706 Lancaster Ave Lexington, KY | 3.0 | 3.0 | 1050 | $1,495 | $1.42 | 14d | 1 | 0.11mi |
| 214 E Seventh St Lexington, KY | 2.0 | 1.0 | 832 | $1,000 | $1.20 | 23d | 1 | 0.15mi |
| 211 E Sixth St Lexington, KY | 3.0 | 1.0 | 1400 | $1,500 | $1.07 | 23d | 1 | 0.17mi |
| 627 N Martin Luther King Blvd Lexington, KY | 4.0 | 2.0 | 1440 | $1,400 | $0.97 | 23d | 1 | 0.21mi |
| 426 E Fifth St Unit Z1 Lexington, KY | 2.0 | 1.0 | 719 | $1,195 | $1.66 | 23d | 1 | 0.28mi |
| 170 E Loudon Ave Unit 2 Lexington, KY | 3.0 | 1.0 | 1500 | $1,350 | $0.90 | 23d | 1 | 0.33mi |
| 653 Jackson St Lexington, KY | 2.0 | 1.0 | 839 | $1,295 | $1.54 | 14d | 1 | 0.34mi |
| 425 Hawkins Ave Lexington, KY | 3.0 | 1.5 | 1124 | $1,570 | $1.40 | 14d | 1 | 0.36mi |
| 161 E Loudon Ave Lexington, KY | 2.0 | 1.0 | 1118 | $1,300 | $1.16 | 23d | 1 | 0.36mi |
| 434 N Martin Luther King Blvd #201 Lexington, KY | 2.0 | 2.0 | 950 | $1,450 | $1.53 | 23d | 1 | 0.38mi |
| 222 W Sixth St Lexington, KY | 3.0 | 1.5 | 1050 | $1,150 | $1.10 | 23d | 1 | 0.47mi |
| 115 W Loudon Ave Unit L97 Lexington, KY | 3.0 | 2.0 | 960 | $980 | $1.02 | 23d | 1 | 0.58mi |
| 246 Warnock St Lexington, KY | 2.0 | 1.0 | 810 | $1,195 | $1.48 | 23d | 1 | 0.58mi |
| 236 Warnock St Lexington, KY | 3.0 | 1.0 | 1028 | $2,200 | $2.14 | 23d | 1 | 0.60mi |
| 444 N Broadway Lexington, KY | 3.0 | 1.0 | 1160 | $1,595 | $1.38 | 23d | 1 | 0.64mi |
| 231 Walton Ave Unit 206 Lexington, KY | 2.0 | 2.0 | 1178 | $1,700 | $1.44 | 23d | 1 | 0.69mi |
| 458 Morgan Ave Lexington, KY | 3.0 | 1.0 | 1275 | $1,325 | $1.04 | 23d | 1 | 0.79mi |
| 1211 N Limestone Lexington, KY | 3.0 | 1.0 | 1300 | $1,050 | $0.81 | 23d | 1 | 0.79mi |
| 411 Morgan Ave Lexington, KY | 3.0 | 2.0 | 1160 | $1,600 | $1.38 | 21d | 1 | 0.79mi |
| 811 Shelby Ave Unit Z1 Lexington, KY | 2.0 | 1.0 | 792 | $1,224 | $1.55 | 14d | 1 | 0.86mi |
| 443 Shawnee Ave Lexington, KY | 4.0 | 1.0 | 1435 | $1,600 | $1.11 | 23d | 1 | 0.87mi |
| 444 Jefferson St Unit A Lexington, KY | 2.0 | 2.0 | 1220 | $1,950 | $1.60 | 14d | 1 | 0.89mi |
| 120 E Main St Lexington, KY | 2.0 | 1.0–2.0 | 710 | $2,486 | $3.50 | 14d | 20 | 0.95mi |
| 143 Woodland Ave Lexington, KY | 2.0 | 1.0 | 1100 | $1,650 | $1.50 | 23d | 1 | 1.03mi |
| 345 Blackburn Ave Lexington, KY | 2.0 | 2.0 | 946 | $1,925 | $2.03 | 14d | 1 | 1.06mi |
| 341 Grosvenor Ave Unit 1 Lexington, KY | 3.0 | 2.0 | 700 | $2,050 | $2.93 | 23d | 1 | 1.10mi |
| 341 Grosvenor Ave #4 Lexington, KY | 3.0 | 3.0 | 859 | $2,600 | $3.03 | 23d | 1 | 1.10mi |
| 341 Grosvenor Ave Unit 3 Lexington, KY | 3.0 | 3.0 | 875 | $2,500 | $2.86 | 23d | 1 | 1.10mi |
| 303 Owsley Ave Lexington, KY | 3.0 | 2.0 | 1188 | $2,100 | $1.77 | 14d | 1 | 1.11mi |
| 302 Owsley Ave Lexington, KY | 4.0 | 1.0 | 1025 | $1,895 | $1.85 | 23d | 1 | 1.13mi |
| 1105 Sparks Rd Lexington, KY | 3.0 | 1.0 | 1302 | $1,575 | $1.21 | 23d | 1 | 1.14mi |
| 330 Newtown Pike Lexington, KY | 1.0–3.0 | 1.0–2.0 | 976 | $1,377 | $1.41 | 23d | 1 | 1.18mi |
| 261 S Limestone #303 Lexington, KY | 2.0 | 2.0 | 1102 | $2,995 | $2.72 | 23d | 1 | 1.19mi |
| 275 S Limestone #135 Lexington, KY | 3.0 | 2.0 | 1142 | $2,950 | $2.58 | 14d | 1 | 1.20mi |
| 275 S Limestone #115 Lexington, KY | 2.0 | 2.0 | 1010 | $2,500 | $2.48 | 23d | 1 | 1.20mi |
| 1120 Sparks Rd Lexington, KY | 3.0 | 1.0 | 1200 | $1,600 | $1.33 | 21d | 1 | 1.22mi |
| 355 S Broadway #305 Lexington, KY | 2.0 | 2.0 | 1436 | $2,900 | $2.02 | 23d | 1 | 1.26mi |
| 330 Rose St Lexington, KY | 1.0–2.0 | 1.0 | 627 | $1,450 | $2.31 | 23d | 1 | 1.27mi |
| 723 Charles Ave Lexington, KY | 3.0 | 1.0 | 992 | $1,300 | $1.31 | 14d | 1 | 1.30mi |
Listing history 26 events
-
2026-06-18days on market $179,900 Active 55 DOM
-
2026-06-17days on market $179,900 Active 54 DOM
-
2026-06-16days on market $179,900 Active 53 DOM
-
2026-06-15days on market $179,900 Active 52 DOM
-
2026-06-14days on market $179,900 Active 50 DOM
-
2026-06-13days on market $179,900 Active 49 DOM
-
2026-06-10days on market $179,900 Active 47 DOM
-
2026-06-09days on market $179,900 Active 46 DOM
-
2026-06-08days on market $179,900 Active 45 DOM
-
2026-06-07days on market $179,900 Active 44 DOM
-
2026-06-05days on market $179,900 Active 41 DOM
-
2026-06-03days on market $179,900 Active 40 DOM
-
2026-06-02days on market $179,900 Active 39 DOM
-
2026-06-01days on market $179,900 Active 38 DOM
-
2026-05-31days on market $179,900 Active 37 DOM
-
2026-05-06price $179,900
-
2026-04-24$189,999 Active
-
2012-02-29soldstatus $16,000
-
2011-12-12soldstatus $16,000 427-char remark
Show marketing remark (427 chars)
~~~This is a great income producing investment!~~~ New Price! Bring an offer! Home has been redone in the inside!! These are some of the updates in 2010: Heating/Air, appliances, Water Heater, Flooring (vinyl in kitchen & bath, hardwood throughout the rest of the house), Master bedroom has a bath and a walk in closet, light fixtures, cabinets, doors and it is all ELECTRIC!! Selling as is, inspections welcome per seller.
-
2011-11-02historical 427-char remark
Show marketing remark (427 chars)
~~~This is a great income producing investment!~~~ New Price! Bring an offer! Home has been redone in the inside!! These are some of the updates in 2010: Heating/Air, appliances, Water Heater, Flooring (vinyl in kitchen & bath, hardwood throughout the rest of the house), Master bedroom has a bath and a walk in closet, light fixtures, cabinets, doors and it is all ELECTRIC!! Selling as is, inspections welcome per seller.
-
2011-07-07$26,500 427-char remark
Show marketing remark (427 chars)
~~~This is a great income producing investment!~~~ New Price! Bring an offer! Home has been redone in the inside!! These are some of the updates in 2010: Heating/Air, appliances, Water Heater, Flooring (vinyl in kitchen & bath, hardwood throughout the rest of the house), Master bedroom has a bath and a walk in closet, light fixtures, cabinets, doors and it is all ELECTRIC!! Selling as is, inspections welcome per seller.
-
2010-02-25soldstatus $7,500 106-char remark
Show marketing remark (106 chars)
Sold As Is. Duplex converted to single family home, but could be converted back to duplex. Priced to sell.
-
2010-02-11historical 106-char remark
Show marketing remark (106 chars)
Sold As Is. Duplex converted to single family home, but could be converted back to duplex. Priced to sell.
-
2009-11-04$17,500 106-char remark
Show marketing remark (106 chars)
Sold As Is. Duplex converted to single family home, but could be converted back to duplex. Priced to sell.
-
2009-03-16historical
-
2008-05-16$48,000
ⓘ Source: listings_history table (triggers on properties + properties_extension) + one-shot
backfill from property_details.listing_events for pre-trigger history.
Tax reassessment forecast KY · Resets to sale price
- Current annual tax
- $483 · $40/mo
- Projected year-2 tax
- $1,547 · $129/mo
- Expected delta
- +$1,064/yr (+$89/mo · 220.3%)
ⓘ Screening estimate from a state-policy table — verify with the county assessor before closing.
Climate risk First Street
- Flood 1/10 Low FEMA zone X (unshaded) · 0% chance over 30 yrs
- Wildfire 1/10 Low
- Heat 4/10 Moderate 7 d/yr ≥101°F today · 19 d/yr by 30 yrs out
- Wind 2/10 Low 100% chance of damaging wind over 30 yrs
- Air quality 2/10 Low 0 unhealthy d/yr today · 2 by 30 yrs out
Nearby sold comps map
Loading sold comps map…
Walkable amenities ~0.75 mi
Loading nearby amenities…
Taxation est. · year 1
- Rental income
- $18,700
- − Mortgage interest
- −$10,077
- − Property taxes
- −$483
- − Insurance
- −$900
- − Repairs & maintenance
- −$1,496
- − Management
- −$1,496
- − Depreciation
- −$5,233
- Taxable loss
- −$985
- Est. tax savings @ 24.0%
- +$237
- After-tax cash flow
- $2,306/yr
For passive investors: Depreciation is non-cash, so a rental often shows a tax loss while cash-flowing — sheltering income. Rental losses are passive: they offset passive income freely, and up to $25,000/yr can offset ordinary (W-2) income if you actively participate and your MAGI is under $100k (phasing out to $0 by $150k); unused losses carry forward. On sale, claimed depreciation is recaptured at up to 25%, and gains may owe capital-gains tax (a 1031 exchange can defer both). Figures are a year-1 estimate at your 24.0% rate — not tax advice; consult a CPA.
Schools (NCES district)
- District
- Fayette County
- NCES district ID
- 2101860
- Math proficiency
- 35% ▼ -16.00%
- Reading proficiency
- 45% ▼ -13.00%
- Median HH income
- $49,245
- Composite
- 34.38/100
- National rank
- #5211
- State rank
- #27 of 165 in KY
Livability — Lexington-Fayette
No livability data for this city. (Only ~50 U.S. cities are tracked.)
Census & demographics
- Census place
- Lexington-Fayette, KY
- County
- Fayette County · 317,143 people
- City population
- 321,882
- Metro
- Lexington-Fayette, KY
- Population (ZIP)
- 23,756
- Household income
- $29,440
- Rent vs Own
- Severe rent burden
- 2644.0
Population outlook (Fayette County) Hauer SSP2
- Today (2025)
- 363,454 people
- By 2030
- 388,270 · +6.8%
- By 2040
- 438,688 · +20.7%
- By 2050
- 490,667 · +35.0%
- By 2075
- 625,394 · +72.1%
- By 2100
- 721,354 · +98.5%
Race, ethnicity, and origin ACS 2023
- Neighborhood character
- Diverse neighborhood (Simpson 0.58)
- Race & ethnicity
- White 60% Black 22% Hispanic / Latino 9% Two or more races 7% Asian 3%
- Hispanic origin (detail)
- Mexican 5%
- Common ancestry
- Serbian 2% Italian 2% Lithuanian 2%
- Foreign-born
- 9% · Canada, China
- Languages at home
- 87% English-only · Spanish 8% Chinese 1% Other Indo-European 1%
Political lean MEDSL · Fayette
- 2024 margin
- D (+18.1) · D 58.0% · R 39.9% · Other 2.1%
- 2008→2024 swing
- +13.3pp toward D · 2008: 4.8pp · 2024: 18.1pp
- All cycles
- 2024: D+18.1 2020: D+20.8 2016: D+9.5 2012: D+1.0 2008: D+4.8
Not yet ingested
- Civics
- —
Market trends
- HPI YoY
- ▼ -251.04%
- Current HPI
- 204.3994
- Rent YoY
- ▲ 11.83%
- Metro
- Lexington-Fayette, KY
- State GDP YoY
- ▲ 1.81%
- F500 in state
- 4
Industry mix (Fortune 500 HQ in KY)
| Industry | F500 HQs | Revenue |
|---|---|---|
| Healthcare | 1 | $118B |
|
||
| Food / Beverage | 1 | $7B |
|
||
Price history
+274.8% since first listed11 events — show timeline
- 2026-05-06 Price Changed $179,900 ImagineMLS
- 2026-04-24 Listed $189,999 ImagineMLS
- 2012-02-29 Sold (Public Records) $16,000 Public Records
- 2011-12-12 Sold (MLS) $16,000 ImagineMLS
- 2011-11-02 Listing Removed — ImagineMLS
- 2011-07-07 Listed $26,500 ImagineMLS
- 2010-02-25 Sold (MLS) $7,500 ImagineMLS
- 2010-02-11 Listing Removed — ImagineMLS
- 2009-11-04 Listed $17,500 ImagineMLS
- 2009-03-16 Listing Removed — ImagineMLS
- 2008-05-16 Listed $48,000 ImagineMLS
Property tax history
+1.9%/yrLatest (2015): $483 · +1.9% YoY. Source: county tax records.
Cash-flow waterfall
monthlySold comps — $/sqft
last 12 mo · ≤1 miLoading sold comps…