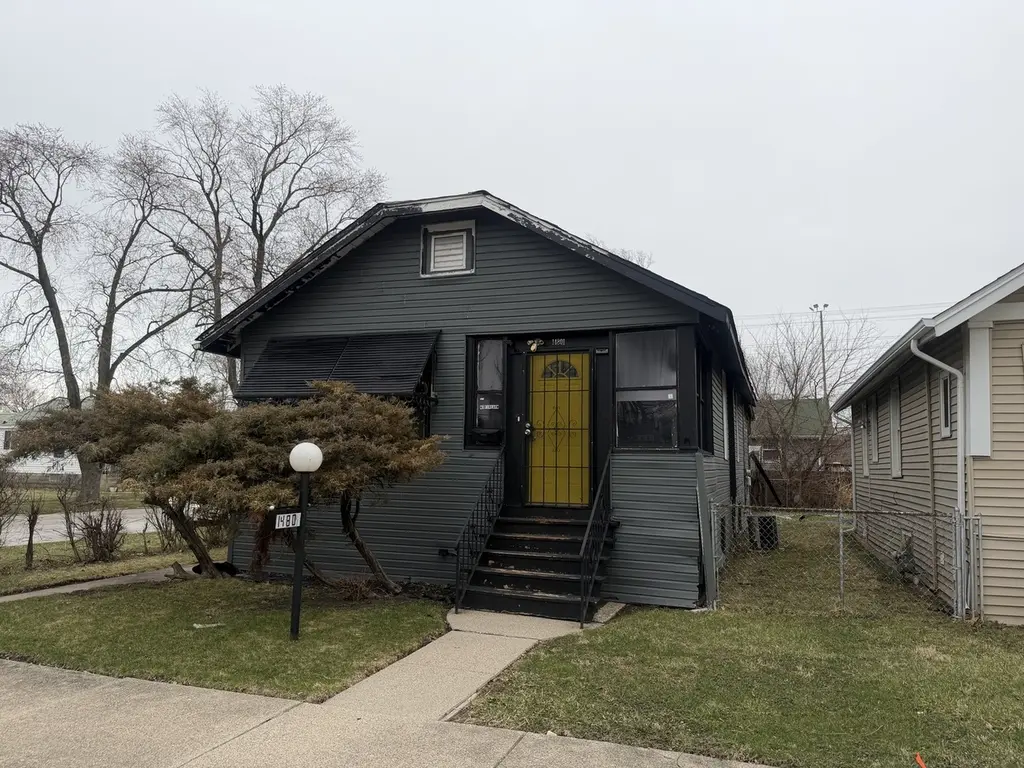
14801 Madison Ave · Harvey, IL
Flood risk 1/10 · Minimal
- FEMA flood zone
- X (unshaded)
- Chance of flooding over 30 yrs
- 0.0%
- Est. flood insurance / yr
- $473 – $860
Fire risk 1/10 · Minimal
- Est. fire insurance / yr
- $804 – $1,492
Heat risk 3/10 · Minor
- Hot days now (above 101°F)
- 7 days/yr
- Hot days in 30 yrs
- 15 days/yr
Wind risk 2/10 · Minimal
- Chance of severe wind over 30 yrs
- —
Air-quality risk 4/10 · Minor
- Unhealthy air days now
- 4 days/yr
- Unhealthy air days in 30 yrs
- 5 days/yr
Risk factors via First Street. Map © Google.
Why this score? — see what drove the A- grade
The composite is a weighted blend of 9 inputs, each scored 0–100. Each bar is that input's sub-score; the figure is the points it added to the 100-point composite (weight × sub-score).
- Cash flow +30.0/30.0
- ARV discount +15.0/15.0
- 1% rule +10.0/10.0
- DSCR +10.0/10.0
- Appreciation +10.0/10.0
- Livability +3.4/5.0
- Rent growth +2.5/5.0
- Condition / age +2.5/5.0
- Schools +0.7/10.0
$55,000
🖨 Deal sheet 📄 Offer letter ✓ Due diligence
Listing remarks
Great opportunity for investors or savvy buyers! This 2-bedroom, 1-bath home offers solid bones with plenty of potential to make it your own. Featuring a spacious living and dining area with original character, this property is ready for your vision and updates. The kitchen offers ample cabinet space and layout potential, while the full basement provides additional storage or future finishing possibilities. Situated on a quiet residential street with a fenced yard, this home is perfect for a rehab project, rental investment, or owner-occupant looking to build equity. Conveniently located near schools, parks, shopping, and major expressways. Sold as-is. Bring your ideas and unlock the potent
Key facts
- Fenced yard
- Full basement
- Ample cabinet space
Tags
Property features AI
Finance
- Other: Property not currently leased; Possession at closing
- HOA & community: No master association fee required
Exterior
- Parking: Attached garage with 2 parking spaces (total 2 spaces)
- Utilities: Public water; Public sewer
- Home design: Detached single-family home; 1.5-story home; Fee simple ownership
- Construction: Vinyl siding; Built before 1978 (property age estimated 91–100 years)
- Exterior features: Lot dimensions approximately 100 x 35; Lot under 0.25 acre; Commuter bus access
Interior
- Kitchen: Kitchen on main level (approx. 10 x 10)
- Bedrooms: Master bedroom (second level); Bedroom (second level, approx. 10 x 10); Additional bedrooms
- Bathrooms: 1 full bathroom
- Heating & cooling: Natural gas heating; Central air conditioning
- Interior features: Unfinished full basement; 5 total rooms
- Laundry & utility: Dedicated laundry room
Neighborhood map
What this means for you Summary
Snapshot
- This is a 2-bed/1.0-bath single-family listed at $55k.
Deal economics
- At list price, monthly cash flow is $521 ($6k/yr) — positive.
- The deal already cash-flows at list — no discount required.
- Meets the 1% rule at list price ($1k rent vs $55k).
- Recommended offer: $52k (6.0% below list) — sets the bar for market timing.
- Cap rate 17.7% vs local median 9.3% in Harvey — top-decile yield for the area; either an underpriced asset or a hidden risk that comps aren't pricing in. Stress-test before assuming the spread holds.
Location & tenants
- Location reads 67/100 on livability (#539 in IL) — a middle-class / working-renter tenant base. Strengths: commute A+, cost of living A+, housing A-; Watch: health & safety D+, schools F, crime F.
- Thornton Twp Hsd 205 (suburban): math 7% / reading 8% proficiency, ranked #594 of 620 in IL (top 96%) — low school quality limits family demand, transient renter base, plan for 1-2y turnover.
- Market conditions: 134 active listings in the ZIP; 3 comparable units currently listed for rent nearby; rentals leasing fast (median 3d on market — plan ~1-2 weeks tenant-placement turnaround); 6,272 units permitted in Cook County in 2024 (4,658 in 5+ unit buildings).
Forward outlook
- In year one you build about $6k of equity ($380 loan paydown + $6k appreciation (10.0% local appreciation)).
- At projected returns (10.0% appreciation + 3.0% rent growth), your $15k cash investment doubles in ~2 years — after that, you're playing with house money.
- By year 6, paydown + projected appreciation supports a ~$35k cash-out refi (75% LTV) — recoverable capital for the next deal without selling this one.
Negotiation context
- It's been on market 83 days — a 6% lower offer ($52k) is reasonable based on typical stale-listing flexibility.
- 2 sale attempts; this cycle's ask has dropped $14k (20%) from the opening price — seller is motivated, your offer sets the floor, not the list.
- Current owner paid $25k; list at $55k implies a 120% gain — meaningful room to come down on a strong offer.
Risks & watch-outs
- Watch-outs: built in 1926 — expect roof / HVAC / electrical / plumbing capex.
Questions for the listing agent
- It's been on market 83 days. Have you received any prior offers? Is the seller open to a 6% concession, seller financing, or rate buy-down credit?
- Built in 1926 — when were the roof, HVAC, electrical panel, plumbing, and water heater last replaced?
- Why hasn't it sold? Are there any deal-killer items the seller is aware of (foundation, flood, title, zoning, code violations)?
- Is there a deadline driving the sale (1031 exchange, divorce, estate, relocation)? That informs how much negotiation room exists.
- Schools are F-rated, which usually means shorter tenancies and higher turnover. Who's the typical renter profile here, and what's been the actual vacancy rate?
- Crime grade is F in this area — have there been break-ins, vandalism, or insurance claims at this property in the last 3 years? What carrier currently insures it and at what premium?
- What's the average days-on-market for RENTAL listings here right now (not sales)? A rising rental-DOM trend means longer vacancies and softer asking-rent achievability than the comps imply.
- What's the recent tenant-quality profile in this submarket — average credit score on applications, eviction rate, late-payment / NSF rate, and stable-employment percentage? A property-management company in the area should have these aggregated.
- How much new for-sale + rental construction is in the pipeline within 1–3 miles? Heavy new supply typically softens prices + rents 12–24 months out; constrained supply supports both.
Investment metrics
- 1% rule
- 2.07% ✓
- Cap rate
- 17.66%
- Cash-on-cash
- 40.59%
- DSCR
- 2.81
- GRM
- 4.0
CMA / ARV
- ARV (on-the-fly)
- $89,280
- Comps found
- 11
Show comp detail 11 sales within ~0.75 mi
| Address | Dist | Beds/Ba | Sqft | Sold | Price | $/sf | Match |
|---|---|---|---|---|---|---|---|
| 14726 Madison Ave | 0.07mi | 2/1.0 | 760 (+2%) | 1mo | $35,000 | $46 | 92 |
| 319 E 148th St | 0.03mi | 2/1.0 | 724 (-3%) | 15mo | $115,000 | $159 | 82 |
| 296 E 149th St | 0.13mi | 3/1.0 (+1) | 772 (+4%) | 4mo | $93,000 | $120 | 79 |
| 14717 E Riverside Dr | 0.56mi | 2/1.0 | 728 (-2%) | 3mo | $35,000 | $48 | 68 |
| 282 E 149th St | 0.15mi | 3/1.0 (+1) | 813 (+9%) | 13mo | $100,000 | $123 | 62 |
| 14300 Parnell Ave | 0.63mi | 3/1.0 (+1) | 730 (-2%) | 7mo | $179,900 | $246 | 56 |
| 14632 Halsted St | 0.42mi | 2/1.0 | 672 (-10%) | 18mo | $40,500 | $60 | 49 |
| 14325 Park Ave | 0.61mi | 2/1.0 | 832 (+12%) | 6mo | $68,000 | $82 | 46 |
| 522 Frances St | 0.56mi | 2/1.0 | 840 (+13%) | 13mo | $115,000 | $137 | 41 |
| 14732 Loomis Ave | 0.70mi | 3/2.0 (+1) | 712 (-4%) | 17mo | $155,000 | $218 | 37 |
| 541 E 149th St | 0.71mi | 1/3.5 (-1) | 720 (-3%) | 20mo | $33,000 | $46 | 30 |
Match score weights: distance 35% · size 25% · config 20% · recency 20%. Top-matched comps best support the ARV.
Projected returns pro-forma
10.0% appreciation · 3.0% rent growth · sell at horizon
- IRR
- 55.7%
- Equity multiple
- 5.10×
- Total profit
- $63,150
- Equity at exit
- $49,548
- IRR
- 49.2%
- Equity multiple
- 11.38×
- Total profit
- $159,909
- Equity at exit
- $106,853
Cash invested: $15,400 (down + closing). Projections, not guarantees.
Landlord ↔ Tenant lean methodology
- Overall (STATE)
- 43 Moderately Tenant-Leaning
- State Illinois
- 43 Moderately Tenant-Leaning · D+7
- County
- — inherits STATE
- City
- — inherits STATE
ZIP-level market 60426
- Home prices YoY
- 6.9%
- Active inventory
- 134
- Price-to-rent
- 4.0×
Monthly cashflow live
- Estimated rent
- $1,141 medium interval (Pro) →
- Mortgage (P&I)
- −$288
- Tax est. 1.5%
- −$69 /mo · $825/yr
- Insurance
- −$23
- HOA
- −$0
- Vacancy / Maint / Mgmt
- −$240
- Net cashflow
- $521
Break-even live
UW: 25.0% down · 7.5% · 30yr · 1.5% tax · 5.0% vac · 8.0% maint · 8.0% mgmt
Financing live
Cash to close
- Down payment
- $13,750
- Closing costs
- $1,650
- Reserves months
- —
- Total cash needed
- —
Loan-product check · same deal, 3 products live
Conventional
25% down · 7.5% · 30yr
- Down + closing
- —
- Monthly P&I
- —
- Monthly cashflow
- —
- DSCR
- —
- Eligible?
- —
Personal DTI + credit; lowest rate.
DSCR
20% down · 8.5% · 30yr
- Down + closing
- —
- Monthly P&I
- —
- Monthly cashflow
- —
- DSCR
- —
- Eligible?
- —
No personal income docs; deal must DSCR.
Hard money
10% down · 12.0% · 12mo
- Down + closing
- —
- Monthly P&I
- —
- Monthly cashflow
- —
- DSCR
- —
- Eligible?
- —
Short-term bridge; refi at stabilization.
Rent comps 3 comps
| Address | Beds | Baths | Sqft | Rent | $/sqft | DOM | Units | Dist |
|---|---|---|---|---|---|---|---|---|
| 455 W 144th St Unit 2W Riverdale, IL | 1.0 | 1.0 | 750 | $1,150 | $1.53 | 4d | 1 | 0.91mi |
| 14119 S Tracy Ave Riverdale, IL | 2.0 | 1.0 | 696 | $1,205 | $1.73 | 3d | 1 | 1.25mi |
| 14031 S School St Riverdale, IL | 1.0 | 1.0 | 620 | $1,045 | $1.69 | 3d | 1 | 1.36mi |
Listing history 14 events
-
2026-06-09days on market $55,000 Active 83 DOM
-
2026-06-08days on market $55,000 Active 82 DOM
-
2026-06-07days on market $55,000 Active 81 DOM
-
2026-06-04days on market $55,000 Active 78 DOM
-
2026-06-03days on market $55,000 Active 77 DOM
-
2026-06-02days on market $55,000 Active 76 DOM
-
2026-06-01days on market $55,000 Active 75 DOM
-
2026-05-31days on market $55,000 Active 74 DOM
-
2026-05-05status Active
-
2026-04-27historical Contingent - Continue to Show
-
2026-04-04price $55,000
-
2026-04-03price $59,000
-
2026-03-19$69,000 Active
-
1994-12-07soldstatus $25,000
ⓘ Source: listings_history table (triggers on properties + properties_extension) + one-shot
backfill from property_details.listing_events for pre-trigger history.
Climate risk First Street
- Flood 1/10 Low FEMA zone X (unshaded) · 0% chance over 30 yrs
- Wildfire 1/10 Low
- Heat 3/10 Moderate 7 d/yr ≥101°F today · 15 d/yr by 30 yrs out
- Wind 2/10 Low
- Air quality 4/10 Moderate 4 unhealthy d/yr today · 5 by 30 yrs out
Nearby sold comps map
Loading sold comps map…
Walkable amenities ~0.75 mi
Loading nearby amenities…
Taxation est. · year 1
- Rental income
- $13,686
- − Mortgage interest
- −$3,081
- − Property taxes
- −$825
- − Insurance
- −$275
- − Repairs & maintenance
- −$1,095
- − Management
- −$1,095
- − Depreciation
- −$1,600
- Taxable income
- $5,716
- Est. tax owed @ 24.0%
- −$1,372
- After-tax cash flow
- $4,879/yr
For passive investors: Depreciation is non-cash, so a rental often shows a tax loss while cash-flowing — sheltering income. Rental losses are passive: they offset passive income freely, and up to $25,000/yr can offset ordinary (W-2) income if you actively participate and your MAGI is under $100k (phasing out to $0 by $150k); unused losses carry forward. On sale, claimed depreciation is recaptured at up to 25%, and gains may owe capital-gains tax (a 1031 exchange can defer both). Figures are a year-1 estimate at your 24.0% rate — not tax advice; consult a CPA.
Schools (NCES district)
- District
- Thornton Twp Hsd 205
- NCES district ID
- 1738970
- Math proficiency
- 7% ▬ 0.00%
- Reading proficiency
- 8% ▼ -2.00%
- Median HH income
- $43,392
- Composite
- 6.92/100
- National rank
- #9976
- State rank
- #594 of 620 in IL
Livability — Harvey
- Score
- 67/100
- State rank
- #539
- US rank
- #11162
Category grades
Schools grade is shown separately in the Schools card above.
Census & demographics
- Census place
- Harvey, IL
- City population
- 23,066
- Population (ZIP)
- 23,066
Population outlook (Cook County) Hauer SSP2
- Today (2025)
- 5,347,519 people
- By 2030
- 5,357,703 · +0.2%
- By 2040
- 5,324,924 · -0.4%
- By 2050
- 5,230,762 · -2.2%
- By 2075
- 4,785,735 · -10.5%
- By 2100
- 4,188,836 · -21.7%
Race, ethnicity, and origin ACS 2023
- Neighborhood character
- Majority Black (59%)
- Race & ethnicity
- Black 59% Hispanic / Latino 33% Two or more races 12% White 3% Asian 2%
- Hispanic origin (detail)
- Mexican 31%
- Foreign-born
- 17% · Canada
- Languages at home
- 67% English-only · Spanish 30% Other Indo-European 2% French/Haitian/Cajun 1%
Political lean MEDSL · Cook
- 2024 margin
- Solid D (+42.0) · D 70.4% · R 28.4% · Other 1.2%
- 2008→2024 swing
- -11.4pp toward R · 2008: 53.4pp · 2024: 42.0pp
- All cycles
- 2024: D+42.0 2020: D+50.3 2016: D+53.0 2012: D+49.4 2008: D+53.4
Not yet ingested
- Civics
- —
Market trends
- HPI YoY
- ▲ 20.36%
- Current HPI
- 313.7895
- Rent YoY
- —
- Metro
- —
- State GDP YoY
- ▲ 1.59%
- F500 in state
- 60
Industry mix (Fortune 500 HQ in IL)
| Industry | F500 HQs | Revenue |
|---|---|---|
| Insurance | 4 | $201B |
|
||
| Consumer Goods | 4 | $87B |
|
||
| Industrial Machinery | 3 | $64B |
|
||
| Healthcare | 2 | $55B |
|
||
| Retail / Pharmacy | 1 | $148B |
|
||
| Agriculture / Food | 1 | $86B |
|
||
Price history
+120.0% since first listed6 events — show timeline
- 2026-05-05 Relisted — MRED as Distributed by MLS Grid
- 2026-04-27 Contingent — MRED as Distributed by MLS Grid
- 2026-04-04 Price Changed $55,000 MRED as Distributed by MLS Grid
- 2026-04-03 Price Changed $59,000 MRED as Distributed by MLS Grid
- 2026-03-19 Listed $69,000 MRED as Distributed by MLS Grid
- 1994-12-07 Sold (Public Records) $25,000 Public Records
Property tax history
+3.2%/yrLatest (2023): $3,791 · +11.2% YoY. Source: county tax records.
Cash-flow waterfall
monthlySold comps — $/sqft
last 12 mo · ≤1 miLoading sold comps…