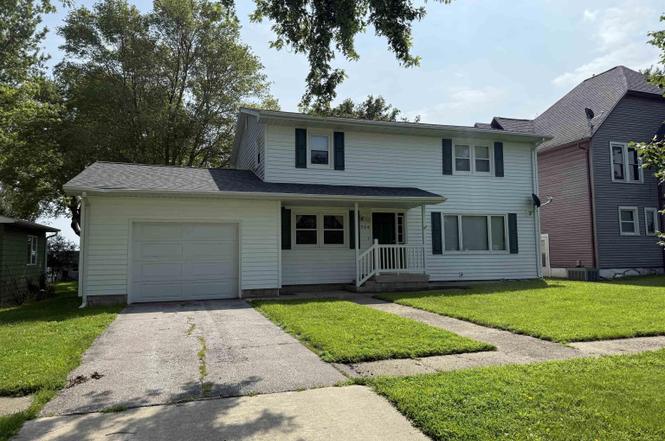
504 Queen St · Fonda, IA
Flood risk 1/10 · Minimal
- FEMA flood zone
- X (unshaded)
- Chance of flooding over 30 yrs
- 0.0%
- Est. flood insurance / yr
- $473 – $860
Fire risk 1/10 · Minimal
- Est. fire insurance / yr
- $902 – $1,676
Heat risk 2/10 · Minimal
- Hot days now (above 101°F)
- 7 days/yr
- Hot days in 30 yrs
- 16 days/yr
Wind risk 2/10 · Minimal
- Chance of severe wind over 30 yrs
- —
Air-quality risk 1/10 · Minimal
- Unhealthy air days now
- 0 days/yr
- Unhealthy air days in 30 yrs
- 0 days/yr
Risk factors via First Street. Map © Google.
Why this score? — see what drove the C grade
The composite is a weighted blend of 9 inputs, each scored 0–100. Each bar is that input's sub-score; the figure is the points it added to the 100-point composite (weight × sub-score).
- Cash flow +16.2/30.0
- ARV discount +11.8/15.0
- Appreciation +5.6/10.0
- Schools +5.6/10.0
- DSCR +5.0/10.0
- 1% rule +3.6/10.0
- Livability +3.3/5.0
- Rent growth +2.5/5.0
- Condition / age +2.5/5.0
$119,900
🖨 Deal sheet 📄 Offer letter ✓ Due diligence
Listing remarks
Nice 2 story home. 5 bedrooms with 2 full bathrooms, 1 car attached garage. Nice location in a small community.
Key facts
- 8,276 sq ft lot
- Garage
- Built 1965
Neighborhood map
What this means for you Summary
Snapshot
- This is a 5-bed/2.0-bath single-family listed at $120k.
Deal economics
- At list price, monthly cash flow is $63 ($751/yr) — positive.
- The deal already cash-flows at list — no discount required.
- To meet the 1% rule (rent ≥ 1% of price), the offer needs to be $103k (13.8% below list).
- Recommended offer: $103k (13.8% below list) — sets the bar for 1% rule.
Location & tenants
- Location reads 66/100 on livability (#532 in IA) — a middle-class / working-renter tenant base. Strengths: cost of living A+, housing A+, employment B; Watch: schools F, amenities F, commute F.
- Newell-Fonda Community School District (rural): math 61% / reading 71% proficiency, ranked #186 of 289 in IA (top 64%) — acceptable for families but not a draw, mixed tenant base, ~2y average lease.
- Market conditions: 3 active listings in the ZIP; 1 units permitted in Pocahontas County in 2024 (0 in 5+ unit buildings).
Forward outlook
- In year one you build about $2k of equity ($829 loan paydown + $1k appreciation (1.2% local appreciation)).
- At projected returns (1.2% appreciation + 3.0% rent growth), your $34k cash investment doubles in ~8 years — after that, you're playing with house money.
Negotiation context
- Only 3 days on market — expect competitive offers; lowballing is unlikely to land.
Questions for the listing agent
- Built in 1965 — when were the roof, HVAC, electrical panel, plumbing, and water heater last replaced?
- Is there a deadline driving the sale (1031 exchange, divorce, estate, relocation)? That informs how much negotiation room exists.
- Schools are F-rated, which usually means shorter tenancies and higher turnover. Who's the typical renter profile here, and what's been the actual vacancy rate?
- What's the average days-on-market for RENTAL listings here right now (not sales)? A rising rental-DOM trend means longer vacancies and softer asking-rent achievability than the comps imply.
- What's the recent tenant-quality profile in this submarket — average credit score on applications, eviction rate, late-payment / NSF rate, and stable-employment percentage? A property-management company in the area should have these aggregated.
- How much new for-sale + rental construction is in the pipeline within 1–3 miles? Heavy new supply typically softens prices + rents 12–24 months out; constrained supply supports both.
Investment metrics
- 1% rule
- 0.86% ✗
- Cap rate
- 6.92%
- Cash-on-cash
- 2.24%
- DSCR
- 1.10
- GRM
- 9.7
CMA / ARV
- ARV (on-the-fly)
- $132,600
- Comps found
- 1
Show comp detail 1 sale within ~0.75 mi
| Address | Dist | Beds/Ba | Sqft | Sold | Price | $/sf | Match |
|---|---|---|---|---|---|---|---|
| 305 Franklin St | 0.22mi | 4/2.0 (-1) | 1,767 (-0%) | 2mo | $133,000 | $75 | 83 |
Match score weights: distance 35% · size 25% · config 20% · recency 20%. Top-matched comps best support the ARV.
Projected returns pro-forma
1.17% appreciation · 3.0% rent growth · sell at horizon
- IRR
- 4.2%
- Equity multiple
- 1.22×
- Total profit
- $7,221
- Equity at exit
- $42,020
- IRR
- 8.4%
- Equity multiple
- 2.05×
- Total profit
- $35,083
- Equity at exit
- $56,692
Cash invested: $33,572 (down + closing). Projections, not guarantees.
Landlord ↔ Tenant lean methodology
- Overall (STATE)
- 83 Strongly Landlord-Friendly
- State Iowa
- 83 Strongly Landlord-Friendly · R+6
- County
- — inherits STATE
- City
- — inherits STATE
ZIP-level market 50540
- Home prices YoY
- 1.1%
- Active inventory
- 3
- Price-to-rent
- 9.7×
Monthly cashflow live
- Estimated rent
- $1,034 medium interval (Pro) →
- Mortgage (P&I)
- −$629
- Tax from tax record
- −$75 /mo · $902/yr
- Insurance
- −$50
- HOA
- −$0
- Vacancy / Maint / Mgmt
- −$217
- Net cashflow
- $63
Break-even live
UW: 25.0% down · 7.5% · 30yr · 1.5% tax · 5.0% vac · 8.0% maint · 8.0% mgmt
Financing live
Cash to close
- Down payment
- $29,975
- Closing costs
- $3,597
- Reserves months
- —
- Total cash needed
- —
Loan-product check · same deal, 3 products live
Conventional
25% down · 7.5% · 30yr
- Down + closing
- —
- Monthly P&I
- —
- Monthly cashflow
- —
- DSCR
- —
- Eligible?
- —
Personal DTI + credit; lowest rate.
DSCR
20% down · 8.5% · 30yr
- Down + closing
- —
- Monthly P&I
- —
- Monthly cashflow
- —
- DSCR
- —
- Eligible?
- —
No personal income docs; deal must DSCR.
Hard money
10% down · 12.0% · 12mo
- Down + closing
- —
- Monthly P&I
- —
- Monthly cashflow
- —
- DSCR
- —
- Eligible?
- —
Short-term bridge; refi at stabilization.
Listing history 2 events
-
2025-08-11status Pending
-
2025-08-04$119,900 Active
ⓘ Source: listings_history table (triggers on properties + properties_extension) + one-shot
backfill from property_details.listing_events for pre-trigger history.
Tax reassessment forecast IA · Partial reset (capped growth)
- Current annual tax
- $902 · $75/mo
- Projected year-2 tax
- $1,392 · $116/mo
- Expected delta
- +$490/yr (+$41/mo · 54.3%)
ⓘ Screening estimate from a state-policy table — verify with the county assessor before closing.
Climate risk First Street
- Flood 1/10 Low FEMA zone X (unshaded) · 0% chance over 30 yrs
- Wildfire 1/10 Low
- Heat 2/10 Low 7 d/yr ≥101°F today · 16 d/yr by 30 yrs out
- Wind 2/10 Low
- Air quality 1/10 Low 0 unhealthy d/yr today · 0 by 30 yrs out
Nearby sold comps map
Loading sold comps map…
Walkable amenities ~0.75 mi
Loading nearby amenities…
Taxation est. · year 1
- Rental income
- $12,402
- − Mortgage interest
- −$6,716
- − Property taxes
- −$902
- − Insurance
- −$600
- − Repairs & maintenance
- −$992
- − Management
- −$992
- − Depreciation
- −$3,488
- Taxable loss
- −$1,288
- Est. tax savings @ 24.0%
- +$309
- After-tax cash flow
- $1,060/yr
For passive investors: Depreciation is non-cash, so a rental often shows a tax loss while cash-flowing — sheltering income. Rental losses are passive: they offset passive income freely, and up to $25,000/yr can offset ordinary (W-2) income if you actively participate and your MAGI is under $100k (phasing out to $0 by $150k); unused losses carry forward. On sale, claimed depreciation is recaptured at up to 25%, and gains may owe capital-gains tax (a 1031 exchange can defer both). Figures are a year-1 estimate at your 24.0% rate — not tax advice; consult a CPA.
Schools (NCES district)
- District
- Newell-Fonda Community School District
- NCES district ID
- 1920580
- Math proficiency
- 61% ▼ -9.00%
- Reading proficiency
- 71% ▲ 5.00%
- Median HH income
- $49,274
- Composite
- 55.95/100
- National rank
- #1197
- State rank
- #186 of 289 in IA
Livability — Fonda
- Score
- 66/100
- State rank
- #532
- US rank
- #11834
Category grades
Schools grade is shown separately in the Schools card above.
Census & demographics
- Census place
- Fonda, IA
- Population (ZIP)
- 1,253
Population outlook (Pocahontas County) Hauer SSP2
- Today (2025)
- 6,624 people
- By 2030
- 6,482 · -2.1%
- By 2040
- 6,359 · -4.0%
- By 2050
- 6,439 · -2.8%
- By 2075
- 7,397 · +11.7%
- By 2100
- 8,428 · +27.2%
Race, ethnicity, and origin ACS 2023
- Neighborhood character
- Predominantly White (78%)
- Race & ethnicity
- White 78% Hispanic / Latino 15% Pacific Islander 6% Two or more races 2%
- Hispanic origin (detail)
- Mexican 11% Puerto Rican 3%
- Common ancestry
- Portuguese 7% Scottish 1%
- Foreign-born
- 8% · Canada
- Languages at home
- 87% English-only · Spanish 9% Other Asian/Pacific 4%
Political lean MEDSL · Pocahontas
- 2024 margin
- Solid R (+54.0) · D 22.3% · R 76.3% · Other 1.4%
- 2008→2024 swing
- -45.6pp toward R · 2008: -8.4pp · 2024: -54.0pp
- All cycles
- 2024: R+54.0 2020: R+49.5 2016: R+45.2 2012: R+21.8 2008: R+8.4
Not yet ingested
- Civics
- —
Market trends
- HPI YoY
- ▲ 1.17%
- Current HPI
- 109.9325
- Rent YoY
- —
- Metro
- —
- State GDP YoY
- ▲ 2.48%
- F500 in state
- 4
Industry mix (Fortune 500 HQ in IA)
| Industry | F500 HQs | Revenue |
|---|---|---|
| Financial Services | 1 | $16B |
|
||
| Retail / Convenience | 1 | $15B |
|
||
Price history
2 events — show timeline
- 2025-08-11 Pending — IAR
- 2025-08-04 Listed $119,900 IAR
Property tax history
+1.9%/yrLatest (2025): $902 · -18.6% YoY. Source: county tax records.
Cash-flow waterfall
monthlySold comps — $/sqft
last 12 mo · ≤1 miLoading sold comps…