 🏷️ Likely Rental
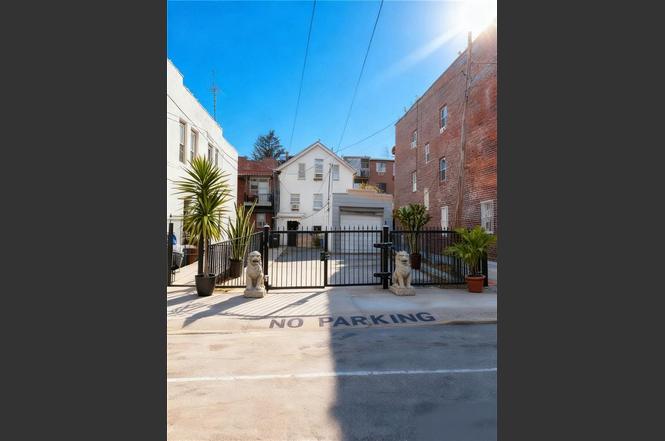
10601 53rd Ave · New York, NY
Flood risk 1/10 · Minimal
- FEMA flood zone
- X (unshaded)
- Chance of flooding over 30 yrs
- 0.0%
- Est. flood insurance / yr
- $507 – $1,088
Fire risk 1/10 · Minimal
- Est. fire insurance / yr
- $691 – $1,283
Heat risk 6/10 · Moderate
- Hot days now (above 99°F)
- 7 days/yr
- Hot days in 30 yrs
- 15 days/yr
Wind risk 6/10 · Moderate
- Chance of severe wind over 30 yrs
- 27.0%
Air-quality risk 5/10 · Moderate
- Unhealthy air days now
- 6 days/yr
- Unhealthy air days in 30 yrs
- 8 days/yr
Risk factors via First Street. Map © Google.
Why this score? — see what drove the D+ grade
The composite is a weighted blend of 9 inputs, each scored 0–100. Each bar is that input's sub-score; the figure is the points it added to the 100-point composite (weight × sub-score).
- ARV discount +15.0/15.0
- Appreciation +8.7/10.0
- Cash flow +8.2/30.0
- Schools +5.0/10.0
- Livability +3.8/5.0
- Rent growth +2.5/5.0
- Condition / age +2.5/5.0
- DSCR +2.2/10.0
- 1% rule +1.6/10.0
$899,000
🖨 Deal sheet 📄 Offer letter ✓ Due diligence
Multi-family units
County records classify this as Multi-Family (2-4 Unit). Listing-text estimate: 2 units. confirmed
Listing remarks
Rare fully detached 2-family with private driveway & detached garage for 4–5 cars — impossible to find in Corona at this price point. First-floor walk-in + two full floors above, ideal for end-user or investor. LOW TAX (˜ $5,000/yr) keeps monthly cost down. R5 zoning = value-add upside for future expansion (buyers to verify). Month-to-month tenants offer flexibility for vacant delivery or rental income. About 10 min to Flushing Main Street for transportation, dining & supermarkets. Big lot • Big parking • Low tax • High upside. A rare opportunity. Text/Call listing agent for fastest response.
Key facts
- Private driveway
- Two family home
- Close to shopping
Tags
Property features AI
Finance
- Other: Two-unit multi-family property with both units on month-to-month tenancy
- Financial info: Financing options may include cash, bank mortgage, or exchange considered
Exterior
- Parking: Detached garage; Approximately 5 parking spaces
- Utilities: 110V electric; Gas hot water; Gas heating
- Home design: Detached residential building; Two-story (two levels with separate units); Lot zoned R5
- Construction: Wood frame construction; Siding exterior; Pitched roof; Poured concrete foundation; Building footprint approximately 560 (dimensions ~28 x 20)
- Exterior features: Front yard; Private drive
Interior
- Kitchen: Oven/Range; Stove
- Bedrooms: Two bedrooms on the first floor; Two bedrooms on the second floor; Property has two separate units (each a 2-bedroom unit)
- Flooring: Other flooring (see remarks)
- Bathrooms: One full bath on the first floor; One full bath on the second floor; Each unit includes one full bathroom
- Heating & cooling: Steam/radiator heat; Gas-fired hot water
- Interior features: Stove; Finished full walk-in basement
- Laundry & utility: Heat included in each unit; Water included in each unit
Neighborhood map
What this means for you Summary
Snapshot
- This is a 2 × 2-bed/0.5-bath units multifamily listed at $899k.
Deal economics
- At list price, monthly cash flow is $-838 ($-10k/yr) — negative. Per door: $-419/mo.
- To cash-flow at today's rent, offer at most $751k (16.5% below list).
- To meet the 1% rule (rent ≥ 1% of price), the offer needs to be $591k (34.3% below list).
- Recommended offer: $591k (34.3% below list) — sets the bar for 1% rule.
- Cap rate 5.2% vs local median 2.6% in New York — top-decile yield for the area; either an underpriced asset or a hidden risk that comps aren't pricing in. Stress-test before assuming the spread holds.
Location & tenants
- Location reads 75/100 on livability (#268 in NY, #4,188 nationally) — a middle-class / working-renter tenant base. Strengths: amenities A+, commute A+, health & safety A; Watch: crime F, cost of living F.
- Market conditions: 243 active listings in the ZIP; 1 comparable units currently listed for rent nearby; 5,302 units permitted in Queens County in 2024 (4,918 in 5+ unit buildings).
- At $5,906/mo this rent would consume 98% of the median local household income ($72k/yr) (locally 6817% of renters already pay >50% of income on rent) — very limited rent-growth headroom before tenants either downsize or default.
Forward outlook
- In year one you build about $73k of equity ($6k loan paydown + $67k appreciation (7.4% local appreciation)).
- Queens County population projected at +16% by 2050 — long-run rental-demand tailwind backs the buy-and-hold thesis.
- By year 2, paydown + projected appreciation supports a ~$116k cash-out refi (75% LTV) — recoverable capital for the next deal without selling this one.
Negotiation context
- It's been on market 149 days — a 12% lower offer ($791k) is reasonable based on typical stale-listing flexibility.
- 4 sale attempts since 13y ago; this cycle's ask has dropped $99k (10%) from the opening price — seller is motivated, your offer sets the floor, not the list.
- Current owner paid $610k; 47% above their basis — modest negotiation headroom, anchor on the comps not their cost.
Risks & watch-outs
- Watch-outs: built in 1901 — expect roof / HVAC / electrical / plumbing capex.
- Climate carrying-cost: major wind risk, 27% chance of damaging wind over 30y; extreme-heat days projected 7→15/yr by 2055 (HVAC capex compounding) — expect insurance premiums to compound above CPI over the hold.
Questions for the listing agent
- What do current leases actually rent for vs. the listed asking? Can we see a recent rent roll and the last 12 months of T-12 income?
- It's been on market 149 days. Have you received any prior offers? Is the seller open to a 34% concession, seller financing, or rate buy-down credit?
- Can we see the unit-by-unit rent roll, current vacancy, and any below-market leases? What's the average tenancy length?
- What capital expenditures (roof, boiler, parking lot, exteriors) have been made in the last 5 years, and what's planned in the next 2?
- Built in 1901 — when were the roof, HVAC, electrical panel, plumbing, and water heater last replaced?
- Why hasn't it sold? Are there any deal-killer items the seller is aware of (foundation, flood, title, zoning, code violations)?
- Is there a deadline driving the sale (1031 exchange, divorce, estate, relocation)? That informs how much negotiation room exists.
- Schools are B-rated — typically a magnet for longer-tenancy family renters. What's the average tenant stay here, and is there a school-zone premium baked into asking?
- Crime grade is F in this area — have there been break-ins, vandalism, or insurance claims at this property in the last 3 years? What carrier currently insures it and at what premium?
- The area grade is low — what's the realistic commute time and amenity access for the typical tenant pool here? Any planned neighborhood developments (good or bad) we should know about?
- What's the average days-on-market for RENTAL listings here right now (not sales)? A rising rental-DOM trend means longer vacancies and softer asking-rent achievability than the comps imply.
- What's the recent tenant-quality profile in this submarket — average credit score on applications, eviction rate, late-payment / NSF rate, and stable-employment percentage? A property-management company in the area should have these aggregated.
- How much new apartment / multifamily construction is in the pipeline within 1–3 miles? Heavy new supply (>2% of stock underway) typically softens rents 12–24 months out; light construction supports rent growth.
Investment metrics
- 1% rule
- 0.66% ✗
- Cap rate
- 5.17%
- Cash-on-cash
- -3.99%
- DSCR
- 0.82
- GRM
- 12.7
CMA / ARV
- ARV (on-the-fly)
- $1,213,290
- Comps found
- 6
Show comp detail 6 sales within ~0.75 mi
| Address | Dist | Beds/Ba | Sqft | Sold | Price | $/sf | Match |
|---|---|---|---|---|---|---|---|
| 101-08/06 Christie Ave | 0.29mi | 4/2.0 | 1,788 (-2%) | 3mo | $1,200,000 | $671 | 76 |
| 55-12 Van Cleef St | 0.16mi | 5/2.0 (+1) | 1,964 (+7%) | 6mo | $980,000 | $499 | 66 |
| 109-07 46 Ave | 0.37mi | 4/2.0 | 1,728 (-6%) | 14mo | $1,145,000 | $663 | 58 |
| 11214 Roosevelt Ave | 0.65mi | 5/— (+1) | 1,760 (-4%) | 7mo | $1,060,000 | $602 | 52 |
| 9626 Corona Ave | 0.59mi | 5/2.0 (+1) | 1,960 (+7%) | 8mo | $1,480,000 | $755 | 45 |
| 108-26 49th Ave | 0.19mi | 5/4.0 (+1) | 2,044 (+12%) | 15mo | $995,000 | $487 | 42 |
Match score weights: distance 35% · size 25% · config 20% · recency 20%. Top-matched comps best support the ARV.
Projected returns pro-forma
7.4% appreciation · 3.0% rent growth · sell at horizon
- IRR
- 15.5%
- Equity multiple
- 2.12×
- Total profit
- $282,438
- Equity at exit
- $646,609
- IRR
- 15.3%
- Equity multiple
- 4.41×
- Total profit
- $858,483
- Equity at exit
- $1,250,283
Cash invested: $251,720 (down + closing). Projections, not guarantees.
Landlord ↔ Tenant lean methodology
- Overall (CITY)
- 0 Strongly Tenant-Friendly
- State New York
- 15 Strongly Tenant-Friendly · D+10
- County
- — inherits STATE
- City New York
- 0 Strongly Tenant-Friendly · D+34
ZIP-level market 11368
- Home prices YoY
- 2.7%
- Active inventory
- 243
- Price-to-rent
- 25.4×
Monthly cashflow live
- Estimated rent
- $5,906 high interval (Pro) →
- Mortgage (P&I)
- −$4,714
- Tax from tax record
- −$414 /mo · $4,972/yr
- Insurance
- −$375
- HOA
- −$0
- Vacancy / Maint / Mgmt
- −$1,240
- Net cashflow
- $-838
Break-even live
2-unit breakdown (identical units grouped — click to expand)
| Units | Beds | Baths | Est. rent |
|---|---|---|---|
| 2× units | 2 | 0.5 | $5,906 |
| #1 | 2 | 0.5 | $2,953 |
| #2 | 2 | 0.5 | $2,953 |
| Total (2 units) | $5,906 | ||
UW: 25.0% down · 7.5% · 30yr · 1.5% tax · 5.0% vac · 8.0% maint · 8.0% mgmt
Financing live
Cash to close
- Down payment
- $224,750
- Closing costs
- $26,970
- Reserves months
- —
- Total cash needed
- —
Loan-product check · same deal, 3 products live
Conventional
25% down · 7.5% · 30yr
- Down + closing
- —
- Monthly P&I
- —
- Monthly cashflow
- —
- DSCR
- —
- Eligible?
- —
Personal DTI + credit; lowest rate.
DSCR
20% down · 8.5% · 30yr
- Down + closing
- —
- Monthly P&I
- —
- Monthly cashflow
- —
- DSCR
- —
- Eligible?
- —
No personal income docs; deal must DSCR.
Hard money
10% down · 12.0% · 12mo
- Down + closing
- —
- Monthly P&I
- —
- Monthly cashflow
- —
- DSCR
- —
- Eligible?
- —
Short-term bridge; refi at stabilization.
Rent comps 1 comps
| Address | Beds | Baths | Sqft | Rent | $/sqft | DOM | Units | Dist |
|---|---|---|---|---|---|---|---|---|
| 13225 58th Ave Flushing, NY | 3.0 | 3.0 | 1300 | $3,500 | $2.69 | 4d | 1 | 1.21mi |
Listing history 12 events
-
2026-04-10status Pending
-
2026-03-15price $899,000
-
2026-02-28price $950,000
-
2025-11-19price $1,118,000
-
2025-11-12$998,000 Active
-
2022-08-19historical
-
2022-07-30$880,000 Active
-
2022-07-24$880,000 Active
-
2016-07-28soldstatus $610,000
-
2014-04-26historical
-
2013-10-26$489,000
-
1999-03-15soldstatus $157,000
ⓘ Source: listings_history table (triggers on properties + properties_extension) + one-shot
backfill from property_details.listing_events for pre-trigger history.
Tax reassessment forecast NY · Partial reset (capped growth)
- Current annual tax
- $4,972 · $414/mo
- Projected year-2 tax
- $10,083 · $840/mo
- Expected delta
- +$5,110/yr (+$426/mo · 102.8%)
ⓘ Screening estimate from a state-policy table — verify with the county assessor before closing.
Climate risk First Street
- Flood 1/10 Low FEMA zone X (unshaded) · 0% chance over 30 yrs
- Wildfire 1/10 Low
- Heat 6/10 Major 7 d/yr ≥99°F today · 15 d/yr by 30 yrs out
- Wind 6/10 Major 27% chance of damaging wind over 30 yrs
- Air quality 5/10 Major 6 unhealthy d/yr today · 8 by 30 yrs out
Nearby sold comps map
Loading sold comps map…
Walkable amenities ~0.75 mi
Loading nearby amenities…
Taxation est. · year 1
- Rental income
- $70,872
- − Mortgage interest
- −$50,358
- − Property taxes
- −$4,972
- − Insurance
- −$4,495
- − Repairs & maintenance
- −$5,670
- − Management
- −$5,670
- − Depreciation
- −$26,153
- Taxable loss
- −$26,445
- Est. tax savings @ 24.0%
- +$6,347
- After-tax cash flow
- $-3,705/yr
For passive investors: Depreciation is non-cash, so a rental often shows a tax loss while cash-flowing — sheltering income. Rental losses are passive: they offset passive income freely, and up to $25,000/yr can offset ordinary (W-2) income if you actively participate and your MAGI is under $100k (phasing out to $0 by $150k); unused losses carry forward. On sale, claimed depreciation is recaptured at up to 25%, and gains may owe capital-gains tax (a 1031 exchange can defer both). Figures are a year-1 estimate at your 24.0% rate — not tax advice; consult a CPA.
Schools (NCES district)
No district data.
Livability — New York
- Score
- 75/100
- State rank
- #268
- US rank
- #4188
Category grades
Schools grade is shown separately in the Schools card above.
Census & demographics
- Census place
- New York, NY
- County
- Queens County · 1,914,869 people
- City population
- 7,731,280
- Metro
- New York-Newark-Jersey City, NY-NJ-PA
- Population (ZIP)
- 105,716
- Household income
- $72,270
- Rent vs Own
- Severe rent burden
- 6817.0
Population outlook (Queens County) Hauer SSP2
- Today (2025)
- 2,546,320 people
- By 2030
- 2,643,059 · +3.8%
- By 2040
- 2,815,563 · +10.6%
- By 2050
- 2,944,423 · +15.6%
- By 2075
- 3,123,338 · +22.7%
- By 2100
- 3,098,688 · +21.7%
Race, ethnicity, and origin ACS 2023
- Neighborhood character
- Predominantly Hispanic (75%)
- Race & ethnicity
- Hispanic / Latino 75% Two or more races 14% Asian 12% Black 8% White 4% Native American 1%
- Hispanic origin (detail)
- Mexican 20% Puerto Rican 2% Dominican 14%
- Foreign-born
- 60% · Canada, China, Jamaica
- Languages at home
- 15% English-only · Spanish 70% Chinese 6% Other Indo-European 3%
Political lean MEDSL · Queens
- 2024 margin
- Strong D (+24.6) · D 62.3% · R 37.7%
- 2008→2024 swing
- -26.2pp toward R · 2008: 50.8pp · 2024: 24.6pp
- All cycles
- 2024: D+24.6 2020: D+45.2 2016: D+53.4 2012: D+58.5 2008: D+50.8
Not yet ingested
- Civics
- —
Market trends
- HPI YoY
- ▲ 7.40%
- Current HPI
- 282.8276
- Rent YoY
- —
- Metro
- New York-Newark-Jersey City, NY-NJ-PA
- State GDP YoY
- ▲ 2.60%
- F500 in state
- 92
Industry mix (Fortune 500 HQ in NY)
| Industry | F500 HQs | Revenue |
|---|---|---|
| Financial Services | 10 | $950B |
|
||
| Consumer Goods | 9 | $162B |
|
||
| Insurance | 4 | $225B |
|
||
| Telecommunications | 2 | $144B |
|
||
| Pharmaceuticals | 2 | $112B |
|
||
| Media / Entertainment | 2 | $69B |
|
||
Price history
+472.6% since first listed12 events — show timeline
- 2026-04-10 Pending — BNYMLS
- 2026-03-15 Price Changed $899,000 BNYMLS
- 2026-02-28 Price Changed $950,000 BNYMLS
- 2025-11-19 Price Changed $1,118,000 BNYMLS
- 2025-11-12 Listed $998,000 BNYMLS
- 2022-08-19 Listing Removed — OneKey® MLS as Distributed by MLS Grid
- 2022-07-30 Listed $880,000 OneKey® MLS as Distributed by MLS Grid
- 2022-07-24 Listed $880,000 RLS at REBNY
- 2016-07-28 Sold (Public Records) $610,000 Public Records
- 2014-04-26 Listing Removed — OneKey® MLS as Distributed by MLS Grid
- 2013-10-26 Listed $489,000 OneKey® MLS as Distributed by MLS Grid
- 1999-03-15 Sold (Public Records) $157,000 Public Records
Property tax history
+6.0%/yrLatest (2025): $4,972 · -2.4% YoY. Source: county tax records.
Cash-flow waterfall
monthlySold comps — $/sqft
last 12 mo · ≤1 miLoading sold comps…