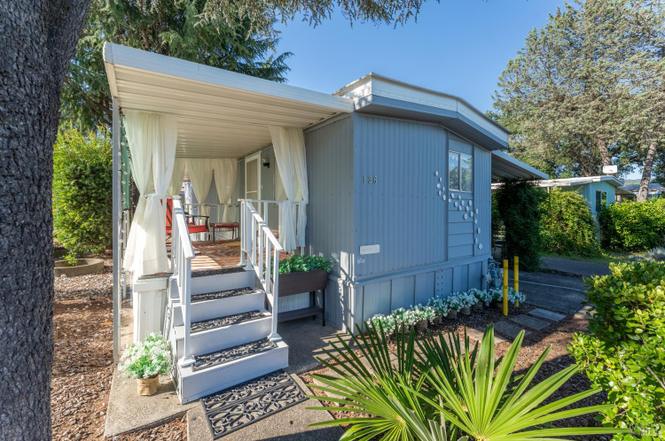
700 E Gobbi St #136 · Ukiah, CA
Flood risk 4/10 · Minor
- FEMA flood zone
- AE
- Chance of flooding over 30 yrs
- 0.22%
- Est. flood insurance / yr
- $1,737 – $8,500
Fire risk 7/10 · Major
- Est. fire insurance / yr
- $659 – $1,223
Heat risk 6/10 · Moderate
- Hot days now (above 100°F)
- 6 days/yr
- Hot days in 30 yrs
- 13 days/yr
Wind risk 1/10 · Minimal
- Chance of severe wind over 30 yrs
- —
Air-quality risk 10/10 · Severe
- Unhealthy air days now
- 20 days/yr
- Unhealthy air days in 30 yrs
- 22 days/yr
Risk factors via First Street. Map © Google.
Why this score? — see what drove the C- grade
The composite is a weighted blend of 9 inputs, each scored 0–100. Each bar is that input's sub-score; the figure is the points it added to the 100-point composite (weight × sub-score).
- Cash flow +15.0/30.0
- ARV discount +15.0/15.0
- 1% rule +5.0/10.0
- DSCR +5.0/10.0
- Rent growth +4.0/5.0
- Livability +3.2/5.0
- Schools +2.9/10.0
- Condition / age +2.5/5.0
- Appreciation +0.0/10.0
$35,000
🖨 Deal sheet 📄 Offer letter ✓ Due diligence
Listing remarks MLS
A quaint mobile awaiting new owner(s) to breathe fresh life into this home!
Key facts
- Remodeled
- Furnished
- 2 parking spots
Tags
Property features AI
Finance
- Other: Located in Manor Oaks park; Not a senior community
- Financial info: Land lease: yes (land lease amount provided in listing data)
- HOA & community: No association
Exterior
- Parking: Covered parking (2 total); No garage
- Security: Carbon monoxide detector; Smoke detector
- Utilities: Public sewer; Natural gas connected; Internet available; Other utilities: see remarks
- Home design: Manufactured home in park (single wide); Facing west; Updated/remodeled condition
- Construction: Metal roof; Aluminum skirting; Manufactured home (Bendix)
- Exterior features: Carport awning; Patio awning; Carpeted porch with porch steps; Storage shed(s); Corner lot
Interior
- Kitchen: Free standing gas range; Free standing refrigerator; Laminate counters; Breakfast area
- Bedrooms: 1 bedroom
- Flooring: Carpet
- Bathrooms: 1 full bathroom with shower stall
- Heating & cooling: Evaporative cooler; Window unit(s) for cooling; No central heating
- Interior features: Dining and living area combined; Breakfast area in kitchen; Laminate kitchen counters; Free standing gas range; Free standing refrigerator; Carbon monoxide detector; Smoke detector; Updated/remodeled interior; Green energy features: window shading/exposure
- Laundry & utility: No laundry hookups inside (listed as None/Other)
Neighborhood map
What this means for you Summary
Snapshot
- This is a 1-bed/1.0-bath manufactured listed at $35k.
Deal economics
- At list price, monthly cash flow is $589 ($7k/yr) — positive.
- The deal already cash-flows at list — no discount required.
- Meets the 1% rule at list price ($2k rent vs $35k).
- Cap rate 41.1% vs local median 3.0% in Ukiah — top-decile yield for the area; either an underpriced asset or a hidden risk that comps aren't pricing in. Stress-test before assuming the spread holds.
Location & tenants
- Location reads 64/100 on livability (#425 in CA) — a middle-class / working-renter tenant base. Strengths: amenities A+, health & safety A+; Watch: schools C-, employment D, crime D-.
- Ukiah Unified (town): math 24% / reading 37% proficiency, ranked #1,018 of 1,400 in CA (top 73%) — families likely to look elsewhere, expect single-tenant / working-renter base with shorter leases; 65% free/reduced lunch — lower-income household profile, screen leases tightly.
- Market conditions: Rents rising fast (+6.1%/yr); 153 active listings in the ZIP; 1 comparable units currently listed for rent nearby; 8 units permitted in Mendocino County in 2024 (0 in 5+ unit buildings).
Forward outlook
- Local home prices are declining (-3.0%/yr); year-one equity from $242 of loan paydown is wiped out by about $1k of value loss. Plan a longer hold.
- Mendocino County population projected at -15% by 2050 — secular population decline; favor cash flow + early exit over multi-decade hold.
- At projected returns (-3.0% appreciation + 6.1% rent growth), your $10k cash investment doubles in ~2 years — after that, you're playing with house money.
Negotiation context
- Only 2 days on market — expect competitive offers; lowballing is unlikely to land.
- 3 sale attempts since 13y ago with the ask held roughly flat each time — persistent listings suggest the price (not the market) is what's stuck; bring a comps-based counter.
- Current owner paid $12k; list at $35k implies a 192% gain — meaningful room to come down on a strong offer.
Risks & watch-outs
- Watch-outs: flood insurance adds $427/mo.
- Climate carrying-cost: in FEMA flood zone AE (mandatory federal flood insurance); major wildfire risk; extreme-heat days projected 6→13/yr by 2055 (HVAC capex compounding) — expect insurance premiums to compound above CPI over the hold.
Questions for the listing agent
- Built in 1975 — when were the roof, HVAC, electrical panel, plumbing, and water heater last replaced?
- What's the actual annual flood-insurance premium (NFIP or private), and is the property in a SFHA with mandatory coverage?
- Is there a deadline driving the sale (1031 exchange, divorce, estate, relocation)? That informs how much negotiation room exists.
- Crime grade is D in this area — have there been break-ins, vandalism, or insurance claims at this property in the last 3 years? What carrier currently insures it and at what premium?
- What's the average days-on-market for RENTAL listings here right now (not sales)? A rising rental-DOM trend means longer vacancies and softer asking-rent achievability than the comps imply.
- What's the recent tenant-quality profile in this submarket — average credit score on applications, eviction rate, late-payment / NSF rate, and stable-employment percentage? A property-management company in the area should have these aggregated.
- How much new for-sale + rental construction is in the pipeline within 1–3 miles? Heavy new supply typically softens prices + rents 12–24 months out; constrained supply supports both.
Investment metrics
- 1% rule
- 4.55% ✓
- Cap rate
- 41.10%
- Cash-on-cash
- 124.30%
- DSCR
- 6.53
- GRM
- 1.8
CMA / ARV
- ARV (on-the-fly)
- $46,656
- Comps found
- 2
Show comp detail 2 sales within ~0.75 mi
| Address | Dist | Beds/Ba | Sqft | Sold | Price | $/sf | Match |
|---|---|---|---|---|---|---|---|
| 700 E Gobbi St #34 | 0.00mi | 2/1.0 (+1) | 672 (+4%) | 18mo | $48,500 | $72 | 73 |
| 700 E Gobbi St #37 | 0.01mi | 2/1.0 (+1) | 742 (+14%) | 6mo | $43,700 | $59 | 65 |
Match score weights: distance 35% · size 25% · config 20% · recency 20%. Top-matched comps best support the ARV.
Projected returns pro-forma
-3.0% appreciation · 6.07% rent growth · sell at horizon
- IRR
- 77.2%
- Equity multiple
- 4.79×
- Total profit
- $37,167
- Equity at exit
- $5,219
- IRR
- 82.0%
- Equity multiple
- 11.61×
- Total profit
- $103,938
- Equity at exit
- $3,026
Cash invested: $9,800 (down + closing). Projections, not guarantees.
Landlord ↔ Tenant lean methodology
- Overall (STATE)
- 18 Strongly Tenant-Friendly
- State California
- 18 Strongly Tenant-Friendly · D+13
- County
- — inherits STATE
- City
- — inherits STATE
ZIP-level market 95482
- Rents YoY
- 6.1%
- Active inventory
- 153
- Price-to-rent
- 1.8×
Monthly cashflow live
- Estimated rent
- $1,591 medium interval (Pro) →
- Mortgage (P&I)
- −$184
- Tax est. 1.5%
- −$44 /mo · $525/yr
- Insurance
- −$15
- Flood insurance flood zone
- −$427 /mo · $5,118/yr
- HOA
- −$0
- Vacancy / Maint / Mgmt
- −$334
- Net cashflow
- $589
Break-even live
UW: 25.0% down · 7.5% · 30yr · 1.5% tax · 5.0% vac · 8.0% maint · 8.0% mgmt
Financing live
Cash to close
- Down payment
- $8,750
- Closing costs
- $1,050
- Reserves months
- —
- Total cash needed
- —
Loan-product check · same deal, 3 products live
Conventional
25% down · 7.5% · 30yr
- Down + closing
- —
- Monthly P&I
- —
- Monthly cashflow
- —
- DSCR
- —
- Eligible?
- —
Personal DTI + credit; lowest rate.
DSCR
20% down · 8.5% · 30yr
- Down + closing
- —
- Monthly P&I
- —
- Monthly cashflow
- —
- DSCR
- —
- Eligible?
- —
No personal income docs; deal must DSCR.
Hard money
10% down · 12.0% · 12mo
- Down + closing
- —
- Monthly P&I
- —
- Monthly cashflow
- —
- DSCR
- —
- Eligible?
- —
Short-term bridge; refi at stabilization.
Rent comps 1 comps
| Address | Beds | Baths | Sqft | Rent | $/sqft | DOM | Units | Dist |
|---|---|---|---|---|---|---|---|---|
| 314 Cooper Ln Ukiah, CA | 2.0 | 1.0 | 660 | $1,750 | $2.65 | 43d | 1 | 0.45mi |
Listing history 3 events
-
2026-06-19days on market $35,000 Active 2 DOM
-
2026-06-17remarks 644-char remark
-
2026-06-17$35,000 Active 1 DOM
ⓘ Source: listings_history table (triggers on properties + properties_extension) + one-shot
backfill from property_details.listing_events for pre-trigger history.
Climate risk First Street
- Flood 4/10 Moderate FEMA zone AE · 22% chance over 30 yrs
- Wildfire 7/10 Severe
- Heat 6/10 Major 6 d/yr ≥100°F today · 13 d/yr by 30 yrs out
- Wind 1/10 Low
- Air quality 10/10 Extreme 20 unhealthy d/yr today · 22 by 30 yrs out
Nearby sold comps map
Loading sold comps map…
Walkable amenities ~0.75 mi
Loading nearby amenities…
Taxation est. · year 1
- Rental income
- $19,094
- − Mortgage interest
- −$1,961
- − Property taxes
- −$525
- − Insurance
- −$5,294
- − Repairs & maintenance
- −$1,527
- − Management
- −$1,527
- − Depreciation
- −$1,018
- Taxable income
- $7,241
- Est. tax owed @ 24.0%
- −$1,738
- After-tax cash flow
- $5,325/yr
For passive investors: Depreciation is non-cash, so a rental often shows a tax loss while cash-flowing — sheltering income. Rental losses are passive: they offset passive income freely, and up to $25,000/yr can offset ordinary (W-2) income if you actively participate and your MAGI is under $100k (phasing out to $0 by $150k); unused losses carry forward. On sale, claimed depreciation is recaptured at up to 25%, and gains may owe capital-gains tax (a 1031 exchange can defer both). Figures are a year-1 estimate at your 24.0% rate — not tax advice; consult a CPA.
Schools (NCES district)
- District
- Ukiah Unified
- NCES district ID
- 0640300
- Math proficiency
- 24% ▲ 2.00%
- Reading proficiency
- 37% ▲ 4.00%
- Median HH income
- $47,865
- Composite
- 29.21/100
- National rank
- #11858
- State rank
- #1018 of 1400 in CA
Livability — Ukiah
- Score
- 64/100
- State rank
- #425
- US rank
- #14442
Category grades
Schools grade is shown separately in the Schools card above.
Census & demographics
- Census place
- Ukiah, CA
- County
- Mendocino County · 33,164 people
- City population
- 33,164
- Metro
- Ukiah, CA
- Population (ZIP)
- 33,164
- Household income
- $69,772
- Rent vs Own
- Severe rent burden
- 1349.0
Population outlook (Mendocino County) Hauer SSP2
- Today (2025)
- 84,643 people
- By 2030
- 82,138 · -3.0%
- By 2040
- 76,402 · -9.7%
- By 2050
- 71,759 · -15.2%
- By 2075
- 61,454 · -27.4%
- By 2100
- 50,130 · -40.8%
Race, ethnicity, and origin ACS 2023
- Neighborhood character
- Diverse neighborhood (Simpson 0.57)
- Race & ethnicity
- White 57% Hispanic / Latino 32% Two or more races 18% Asian 3% Native American 2% Black 1%
- Hispanic origin (detail)
- Mexican 30%
- Common ancestry
- Slovak 3% Italian 2% Lithuanian 2%
- Foreign-born
- 16% · Canada, China, Vietnam
- Languages at home
- 71% English-only · Spanish 25% Chinese 1% Tagalog/Filipino 1%
Political lean MEDSL · Mendocino
- 2024 margin
- Strong D (+26.8) · D 61.3% · R 34.5% · Other 4.2%
- 2008→2024 swing
- -16.0pp toward R · 2008: 42.8pp · 2024: 26.8pp
- All cycles
- 2024: D+26.8 2020: D+35.8 2016: D+29.1 2012: D+37.6 2008: D+42.8
Not yet ingested
- Civics
- —
Market trends
- HPI YoY
- ▼ -485.34%
- Current HPI
- 164.6978
- Rent YoY
- ▲ 6.07%
- Metro
- Ukiah, CA
- State GDP YoY
- ▲ 3.21%
- F500 in state
- 116
Industry mix (Fortune 500 HQ in CA)
| Industry | F500 HQs | Revenue |
|---|---|---|
| Technology | 27 | $1,492B |
|
||
| Financial Services | 3 | $174B |
|
||
| Retail | 3 | $44B |
|
||
| Insurance | 3 | $26B |
|
||
| Media / Entertainment | 2 | $115B |
|
||
| Pharmaceuticals / Biotech | 2 | $62B |
|
||
Price history
+94.4% since first listed5 events — show timeline
- 2026-06-17 Listed $35,000 BAREIS
- 2015-12-04 Sold (MLS) $12,000 BAREIS
- 2015-09-28 Listed $15,000 BAREIS
- 2013-08-29 Sold (MLS) $15,000 BAREIS
- 2013-06-20 Listed $18,000 BAREIS
Cash-flow waterfall
monthlySold comps — $/sqft
last 12 mo · ≤1 miLoading sold comps…