 🌊 Lakefront
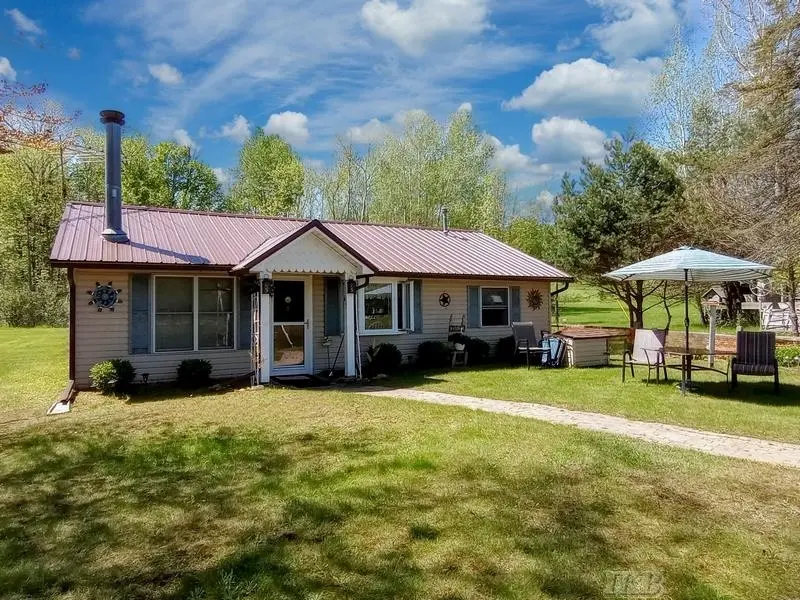
519 E Sun Oil Rd · Hay, MI
Flood risk 1/10 · Minimal
- FEMA flood zone
- X (unshaded)
- Chance of flooding over 30 yrs
- 0.0%
- Est. flood insurance / yr
- $473 – $860
Fire risk 3/10 · Minor
- Est. fire insurance / yr
- $784 – $1,456
Heat risk 2/10 · Minimal
- Hot days now (above 96°F)
- 7 days/yr
- Hot days in 30 yrs
- 14 days/yr
Wind risk 1/10 · Minimal
- Chance of severe wind over 30 yrs
- —
Air-quality risk 2/10 · Minimal
- Unhealthy air days now
- 1 days/yr
- Unhealthy air days in 30 yrs
- 1 days/yr
Risk factors via First Street. Map © Google.
Why this score? — see what drove the C+ grade
The composite is a weighted blend of 9 inputs, each scored 0–100. Each bar is that input's sub-score; the figure is the points it added to the 100-point composite (weight × sub-score).
- Cash flow +28.4/30.0
- DSCR +10.0/10.0
- ARV discount +7.5/15.0
- 1% rule +6.8/10.0
- Schools +3.3/10.0
- Rent growth +2.5/5.0
- Livability +2.5/5.0
- Condition / age +2.5/5.0
- Appreciation +0.0/10.0
$179,777
🖨 Deal sheet 📄 Offer letter ✓ Due diligence
Listing remarks MLS
Experience Lakeside Living at Its Finest! Welcome to your beautifully updated waterfront retreat on stunning Smallwood Lake! Perfectly positioned on the main body of the lake, this well-maintained home offers breathtaking panoramic views and a front-row seat to all the lakefront action. When the lake returns to its full level, you'll enjoy a sandy bottom shoreline—ideal for swimming, wading, and lakeside fun. Inside, the home boasts a host of recent upgrades, including brand-new kitchen cabinetry and countertops, updated flooring throughout, fresh drywall and doors, a new refrigerator, and even a newer roof. Step outside to find a newly installed seawall and dock boards, making this property truly turn-key. Cozy up in front of the gas log fireplace, or relax on the lakeside and watch the boats drift by. The home comes mostly furnished and includes all appliances—just bring your suitcase and start enjoying lake life today! Take a VIRTUAL TOUR: https://idx. paradym.com/idx/4922492 (((There are 2 Waterfront Parcels included)))
Key facts
- Updated flooring
- Waterfront retreat
- 0.26 acre lot
Tags
Neighborhood map
What this means for you Summary
Snapshot
- This is a 3-bed/1.0-bath single-family listed at $180k.
Deal economics
- At list price, monthly cash flow is $580 ($7k/yr) — positive.
- The deal already cash-flows at list — no discount required.
- Meets the 1% rule at list price ($2k rent vs $180k).
- Recommended offer: $169k (6.0% below list) — sets the bar for market timing.
Location & tenants
- Location reads: area grade C — affects rentability + tenant quality, not the cash-flow math above.
- Gladwin Community Schools (town): math 28% / reading 51% proficiency, ranked #232 of 540 in MI (top 43%) — families likely to look elsewhere, expect single-tenant / working-renter base with shorter leases.
- Market conditions: 287 active listings in the ZIP; 90 units permitted in Gladwin County in 2024 (0 in 5+ unit buildings).
Forward outlook
- Local home prices are declining (-3.0%/yr); year-one equity from $1k of loan paydown is wiped out by about $5k of value loss. Plan a longer hold.
- Gladwin County population projected at -25% by 2050 — secular population decline; favor cash flow + early exit over multi-decade hold.
- At projected returns (-3.0% appreciation + 3.0% rent growth), your $50k cash investment doubles in ~9 years — after that, you're playing with house money.
Negotiation context
- It's been on market 78 days — a 6% lower offer ($169k) is reasonable based on typical stale-listing flexibility.
- 7 sale attempts since 22y ago with the ask held roughly flat each time — persistent listings suggest the price (not the market) is what's stuck; bring a comps-based counter.
- Current owner paid $155k; 16% above their basis — modest negotiation headroom, anchor on the comps not their cost.
Questions for the listing agent
- It's been on market 78 days. Have you received any prior offers? Is the seller open to a 6% concession, seller financing, or rate buy-down credit?
- Why hasn't it sold? Are there any deal-killer items the seller is aware of (foundation, flood, title, zoning, code violations)?
- Is there a deadline driving the sale (1031 exchange, divorce, estate, relocation)? That informs how much negotiation room exists.
- This sits on a lake — are riparian / water-frontage rights deeded with the parcel? Any dock permits, shoreline easements, or HOA water-use restrictions?
- What's the documented flood / surge / shoreline-erosion history here (FEMA AND non-FEMA — e.g., storm surge, creek backup, septic-field saturation)?
- Any water-quality or seasonal algae-bloom issues that affect tenant satisfaction or short-term-rental demand?
- What's the average days-on-market for RENTAL listings here right now (not sales)? A rising rental-DOM trend means longer vacancies and softer asking-rent achievability than the comps imply.
- What's the recent tenant-quality profile in this submarket — average credit score on applications, eviction rate, late-payment / NSF rate, and stable-employment percentage? A property-management company in the area should have these aggregated.
- How much new for-sale + rental construction is in the pipeline within 1–3 miles? Heavy new supply typically softens prices + rents 12–24 months out; constrained supply supports both.
Investment metrics
- 1% rule
- 1.18% ✓
- Cap rate
- 10.16%
- Cash-on-cash
- 13.82%
- DSCR
- 1.62
- GRM
- 7.1
CMA / ARV
- ARV (median comp)
- $110,936
- List price
- $179,777
- Delta
- 62.06%
- Verdict
- OVERPRICED
- Comps
- 12 within 1.0 mi
Show comp detail 3 sales within ~0.75 mi
| Address | Dist | Beds/Ba | Sqft | Sold | Price | $/sf | Match |
|---|---|---|---|---|---|---|---|
| 542 Silver St | 0.41mi | 3/2.0 | 1,100 (+2%) | 5mo | $92,000 | $84 | 69 |
| 620 Bushong Beach Dr | 0.33mi | 3/1.0 | 1,000 (-7%) | 13mo | $100,000 | $100 | 62 |
| 591 E SUN OIL Rd | 0.26mi | 2/1.0 (-1) | 1,176 (+9%) | 10mo | $200,000 | $170 | 60 |
Match score weights: distance 35% · size 25% · config 20% · recency 20%. Top-matched comps best support the ARV.
Projected returns pro-forma
-3.0% appreciation · 3.0% rent growth · sell at horizon
- IRR
- 4.0%
- Equity multiple
- 1.15×
- Total profit
- $7,741
- Equity at exit
- $26,805
- IRR
- 13.5%
- Equity multiple
- 2.07×
- Total profit
- $54,057
- Equity at exit
- $15,544
Cash invested: $50,338 (down + closing). Projections, not guarantees.
Landlord ↔ Tenant lean methodology
- Overall (STATE)
- 62 Landlord-Friendly
- State Michigan
- 62 Landlord-Friendly · EVEN
- County
- — inherits STATE
- City
- — inherits STATE
ZIP-level market 48624
- Home prices YoY
- -23.4%
- Active inventory
- 287
- Price-to-rent
- 7.1×
Monthly cashflow live
- Estimated rent
- $2,120 medium interval (Pro) →
- Mortgage (P&I)
- −$943
- Tax from tax record
- −$77 /mo · $924/yr
- Insurance
- −$75
- HOA
- −$0
- Vacancy / Maint / Mgmt
- −$445
- Net cashflow
- $580
Break-even live
UW: 25.0% down · 7.5% · 30yr · 1.5% tax · 5.0% vac · 8.0% maint · 8.0% mgmt
Financing live
Cash to close
- Down payment
- $44,944
- Closing costs
- $5,393
- Reserves months
- —
- Total cash needed
- —
Loan-product check · same deal, 3 products live
Conventional
25% down · 7.5% · 30yr
- Down + closing
- —
- Monthly P&I
- —
- Monthly cashflow
- —
- DSCR
- —
- Eligible?
- —
Personal DTI + credit; lowest rate.
DSCR
20% down · 8.5% · 30yr
- Down + closing
- —
- Monthly P&I
- —
- Monthly cashflow
- —
- DSCR
- —
- Eligible?
- —
No personal income docs; deal must DSCR.
Hard money
10% down · 12.0% · 12mo
- Down + closing
- —
- Monthly P&I
- —
- Monthly cashflow
- —
- DSCR
- —
- Eligible?
- —
Short-term bridge; refi at stabilization.
Listing history 28 events
-
2026-06-18days on market $179,777 Active 78 DOM
-
2026-06-17days on market $179,777 Active 77 DOM
-
2026-06-16days on market $179,777 Active 76 DOM
-
2026-06-15days on market $179,777 Active 75 DOM
-
2026-06-13days on market $179,777 Active 73 DOM
-
2026-06-12days on market $179,777 Active 72 DOM
-
2026-06-09days on market $179,777 Active 69 DOM
-
2026-06-08days on market $179,777 Active 68 DOM
-
2026-06-07days on market $179,777 Active 67 DOM
-
2026-06-07pricedays on market $179,777 Active 66 DOM
-
2026-06-04days on market $184,998 Active 63 DOM
-
2026-06-02days on market $184,998 Active 62 DOM
-
2026-06-01days on market $184,998 Active 61 DOM
-
2026-05-31days on market $184,998 Active 60 DOM
-
2026-05-31days on market $184,998 Active 59 DOM
-
2026-05-07historical Accepting Backup Offers 1052-char remark
Show marketing remark (1052 chars)
Experience Lakeside Living at Its Finest! Welcome to your beautifully updated waterfront retreat on stunning Smallwood Lake! Perfectly positioned on the main body of the lake, this well-maintained home offers breathtaking panoramic views and a front-row seat to all the lakefront action. When the lake returns to its full level, you'll enjoy a sandy bottom shoreline—ideal for swimming, wading, and lakeside fun. Inside, the home boasts a host of recent upgrades, including brand-new kitchen cabinetry and countertops, updated flooring throughout, fresh drywall and doors, a new refrigerator, and even a newer roof. Step outside to find a newly installed seawall and dock boards, making this property truly turn-key. Cozy up in front of the gas log fireplace, or relax on the lakeside and watch the boats drift by. The home comes mostly furnished and includes all appliances—just bring your suitcase and start enjoying lake life today! Take a VIRTUAL TOUR: https://idx. paradym.com/idx/4922492 (((There are 2 Waterfront Parcels included)))
-
2026-04-01$184,998 Active 1052-char remark
Show marketing remark (1052 chars)
Experience Lakeside Living at Its Finest! Welcome to your beautifully updated waterfront retreat on stunning Smallwood Lake! Perfectly positioned on the main body of the lake, this well-maintained home offers breathtaking panoramic views and a front-row seat to all the lakefront action. When the lake returns to its full level, you'll enjoy a sandy bottom shoreline—ideal for swimming, wading, and lakeside fun. Inside, the home boasts a host of recent upgrades, including brand-new kitchen cabinetry and countertops, updated flooring throughout, fresh drywall and doors, a new refrigerator, and even a newer roof. Step outside to find a newly installed seawall and dock boards, making this property truly turn-key. Cozy up in front of the gas log fireplace, or relax on the lakeside and watch the boats drift by. The home comes mostly furnished and includes all appliances—just bring your suitcase and start enjoying lake life today! Take a VIRTUAL TOUR: https://idx. paradym.com/idx/4922492 (((There are 2 Waterfront Parcels included)))
-
2025-09-10historical
-
2025-05-17$169,917 Active
-
2010-12-20$65,900
-
2009-12-14historical
-
2009-01-13$145,000
-
2008-11-26historical
-
2007-11-26$149,900
-
2005-09-07soldstatus $154,900
-
2005-05-08$154,900
-
2005-01-06historical
-
2004-07-06$154,900
ⓘ Source: listings_history table (triggers on properties + properties_extension) + one-shot
backfill from property_details.listing_events for pre-trigger history.
Tax reassessment forecast MI · Partial reset (capped growth)
- Current annual tax
- $924 · $77/mo
- Projected year-2 tax
- $1,846 · $154/mo
- Expected delta
- +$922/yr (+$77/mo · 99.8%)
ⓘ Screening estimate from a state-policy table — verify with the county assessor before closing.
Climate risk First Street
- Flood 1/10 Low FEMA zone X (unshaded) · 0% chance over 30 yrs
- Wildfire 3/10 Moderate
- Heat 2/10 Low 7 d/yr ≥96°F today · 14 d/yr by 30 yrs out
- Wind 1/10 Low
- Air quality 2/10 Low 1 unhealthy d/yr today · 1 by 30 yrs out
Nearby sold comps map
Loading sold comps map…
Walkable amenities ~0.75 mi
Loading nearby amenities…
Taxation est. · year 1
- Rental income
- $25,436
- − Mortgage interest
- −$10,070
- − Property taxes
- −$924
- − Insurance
- −$899
- − Repairs & maintenance
- −$2,035
- − Management
- −$2,035
- − Depreciation
- −$5,230
- Taxable income
- $4,243
- Est. tax owed @ 24.0%
- −$1,018
- After-tax cash flow
- $5,940/yr
For passive investors: Depreciation is non-cash, so a rental often shows a tax loss while cash-flowing — sheltering income. Rental losses are passive: they offset passive income freely, and up to $25,000/yr can offset ordinary (W-2) income if you actively participate and your MAGI is under $100k (phasing out to $0 by $150k); unused losses carry forward. On sale, claimed depreciation is recaptured at up to 25%, and gains may owe capital-gains tax (a 1031 exchange can defer both). Figures are a year-1 estimate at your 24.0% rate — not tax advice; consult a CPA.
Schools (NCES district)
- District
- Gladwin Community Schools
- NCES district ID
- 2615990
- Math proficiency
- 28% ▼ -13.00%
- Reading proficiency
- 51% ▼ -2.00%
- Median HH income
- $38,917
- Composite
- 32.93/100
- National rank
- #5595
- State rank
- #232 of 540 in MI
Livability — Hay
No livability data for this city. (Only ~50 U.S. cities are tracked.)
Census & demographics
- Population (ZIP)
- 16,269
Population outlook (Gladwin County) Hauer SSP2
- Today (2025)
- 23,440 people
- By 2030
- 22,281 · -4.9%
- By 2040
- 19,867 · -15.2%
- By 2050
- 17,667 · -24.6%
- By 2075
- 12,909 · -44.9%
- By 2100
- 8,629 · -63.2%
Race, ethnicity, and origin ACS 2023
- Neighborhood character
- Predominantly White (94%)
- Race & ethnicity
- White 94% Two or more races 4% Hispanic / Latino 2%
- Common ancestry
- Romanian 8% Lithuanian 3% Iranian 3%
- Foreign-born
- 1%
- Languages at home
- 95% English-only · German/W. Germanic 4% Spanish 1%
Political lean MEDSL · Gladwin
- 2024 margin
- Solid R (+40.7) · D 29.1% · R 69.8% · Other 1.1%
- 2008→2024 swing
- -42.2pp toward R · 2008: 1.5pp · 2024: -40.7pp
- All cycles
- 2024: R+40.7 2020: R+36.8 2016: R+34.7 2012: R+7.2 2008: D+1.5
Not yet ingested
- Civics
- —
Market trends
- HPI YoY
- ▼ -72.67%
- Current HPI
- 238.0744
- Rent YoY
- —
- Metro
- —
- State GDP YoY
- ▲ 1.37%
- F500 in state
- 28
Industry mix (Fortune 500 HQ in MI)
| Industry | F500 HQs | Revenue |
|---|---|---|
| Automotive Parts | 3 | $48B |
|
||
| Automotive | 2 | $372B |
|
||
| Chemicals | 1 | $45B |
|
||
| Automotive Retail | 1 | $29B |
|
||
| Healthcare / Medical Devices | 1 | $23B |
|
||
| Automotive Technology | 1 | $20B |
|
||
Price history
+19.4% since first listed13 events — show timeline
- 2026-05-07 Contingent — MiRealSource-MiMLS
- 2026-04-01 Listed $184,998 MiRealSource-MiMLS
- 2025-09-10 Listing Removed — MiRealSource-MiMLS
- 2025-05-17 Listed $169,917 MiRealSource-MiMLS
- 2010-12-20 Listed $65,900 MiRealSource-MiMLS
- 2009-12-14 Listing Removed — MiRealSource-MiMLS
- 2009-01-13 Listed $145,000 MiRealSource-MiMLS
- 2008-11-26 Listing Removed — MiRealSource-MiMLS
- 2007-11-26 Listed $149,900 MiRealSource-MiMLS
- 2005-09-07 Sold (Public Records) $154,900 Public Records
- 2005-05-08 Listed $154,900 MiRealSource-MiMLS
- 2005-01-06 Listing Removed — MiRealSource-MiMLS
- 2004-07-06 Listed $154,900 MiRealSource-MiMLS
Property tax history
-5.0%/yrLatest (2025): $924 · -46.7% YoY. Source: county tax records.
Cash-flow waterfall
monthlySold comps — $/sqft
last 12 mo · ≤1 miLoading sold comps…