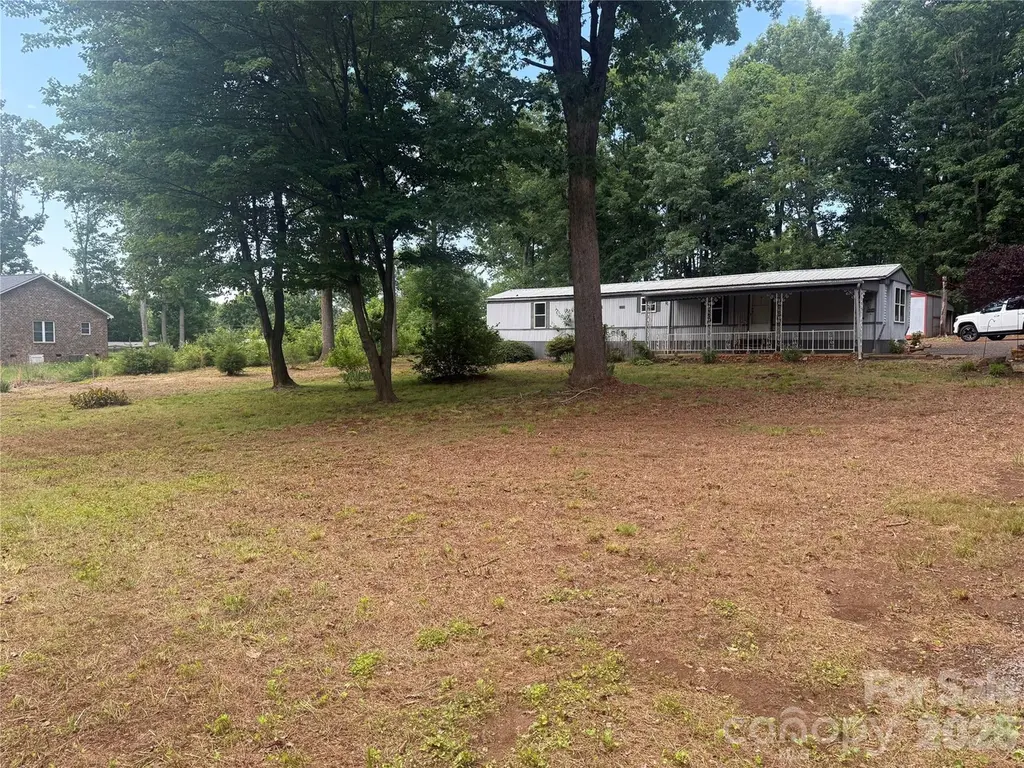
3514 Diesel Dr · Denver, NC
Flood risk 1/10 · Minimal
- FEMA flood zone
- X (unshaded)
- Chance of flooding over 30 yrs
- 0.0%
- Est. flood insurance / yr
- $507 – $1,088
Fire risk 4/10 · Minor
- Est. fire insurance / yr
- $906 – $1,684
Heat risk 5/10 · Moderate
- Hot days now (above 103°F)
- 7 days/yr
- Hot days in 30 yrs
- 16 days/yr
Wind risk 3/10 · Minor
- Chance of severe wind over 30 yrs
- 5.0%
Air-quality risk 3/10 · Minor
- Unhealthy air days now
- 3 days/yr
- Unhealthy air days in 30 yrs
- 3 days/yr
Risk factors via First Street. Map © Google.
Why this score? — see what drove the C+ grade
The composite is a weighted blend of 9 inputs, each scored 0–100. Each bar is that input's sub-score; the figure is the points it added to the 100-point composite (weight × sub-score).
- Cash flow +27.9/30.0
- DSCR +9.9/10.0
- ARV discount +7.5/15.0
- 1% rule +6.4/10.0
- Schools +4.8/10.0
- Livability +3.3/5.0
- Condition / age +2.5/5.0
- Rent growth +2.4/5.0
- Appreciation +0.0/10.0
$125,000
🖨 Deal sheet 📄 Offer letter ✓ Due diligence
Key facts
- 1.09 acre lot
- Built 1987
Property features AI
Finance
- HOA & community: No HOA
Exterior
- Parking: Detached carport
- Utilities: County water; Septic system installed
- Home design: Manufactured single-family residence; One story (single level); R-S zoning
- Construction: Aluminum and metal exterior materials; Crawl space foundation; Manufactured construction
- Exterior features: Lot approximately 1.09 acres; Roads are gravel and paved; Publicly maintained road access
Interior
- Kitchen: No appliances listed for the kitchen
- Bedrooms: Two bedrooms on the main level
- Bathrooms: Two full bathrooms on the main level
- Heating & cooling: Floor furnace heating; Central air conditioning
- Interior features: Six total rooms; No built-in appliances listed
- Laundry & utility: Utility room for laundry
Neighborhood map
What this means for you Summary
Snapshot
- This is a 3-bed/1.0-bath manufactured listed at $125k.
Deal economics
- At list price, monthly cash flow is $386 ($5k/yr) — positive.
- The deal already cash-flows at list — no discount required.
- Meets the 1% rule at list price ($1k rent vs $125k).
- Cap rate 10.0% vs local median 2.1% in Denver — top-decile yield for the area; either an underpriced asset or a hidden risk that comps aren't pricing in. Stress-test before assuming the spread holds.
Location & tenants
- Location reads 66/100 on livability (#255 in NC) — a middle-class / working-renter tenant base. Strengths: crime A+, cost of living A+, housing B+; Watch: employment D, amenities F, commute F.
- Lincoln County Schools (rural): math 57% / reading 55% proficiency, ranked #42 of 178 in NC (top 24%) — acceptable for families but not a draw, mixed tenant base, ~2y average lease.
- Zoned schools: Pumpkin Center Primary (306 students, 46% FRL); North Lincoln High (math 75% / reading 74%, grade B+, #92 of 535 statewide, top 18%, 1,079 students, 27% FRL) — zoned schools at 36% FRL track the district average.
- Zoned-school proficiency averages 74% at this address vs 56% district-wide (+18 pts) — the actual schools serving this property are materially stronger than the Lincoln County Schools average implies; a family-tenant draw the district grade alone would hide.
- Market conditions: Rents soft (-0.6%/yr); 290 active listings in the ZIP; 697 units permitted in Lincoln County in 2024 (0 in 5+ unit buildings).
Forward outlook
- Local home prices are declining (-3.0%/yr); year-one equity from $864 of loan paydown is wiped out by about $4k of value loss. Plan a longer hold.
- Lincoln County population projected at +8% by 2050 — modest demand growth; plan on rents tracking national, not racing it.
Negotiation context
- Only 1 days on market — expect competitive offers; lowballing is unlikely to land.
- Current owner paid $31k; list at $125k implies a 303% gain — meaningful room to come down on a strong offer.
Risks & watch-outs
- Climate carrying-cost: extreme-heat days projected 7→16/yr by 2055 (HVAC capex compounding) — expect insurance premiums to compound above CPI over the hold.
Questions for the listing agent
- Is there a deadline driving the sale (1031 exchange, divorce, estate, relocation)? That informs how much negotiation room exists.
- Schools are B-rated — typically a magnet for longer-tenancy family renters. What's the average tenant stay here, and is there a school-zone premium baked into asking?
- What's the average days-on-market for RENTAL listings here right now (not sales)? A rising rental-DOM trend means longer vacancies and softer asking-rent achievability than the comps imply.
- What's the recent tenant-quality profile in this submarket — average credit score on applications, eviction rate, late-payment / NSF rate, and stable-employment percentage? A property-management company in the area should have these aggregated.
- How much new for-sale + rental construction is in the pipeline within 1–3 miles? Heavy new supply typically softens prices + rents 12–24 months out; constrained supply supports both.
Investment metrics
- 1% rule
- 1.14% ✓
- Cap rate
- 9.99%
- Cash-on-cash
- 13.22%
- DSCR
- 1.59
- GRM
- 7.3
CMA / ARV
No comps found within radius.
Projected returns pro-forma
-3.0% appreciation · 0.0% rent growth · sell at horizon
- IRR
- 0.1%
- Equity multiple
- 1.00×
- Total profit
- $78
- Equity at exit
- $18,638
- IRR
- 6.7%
- Equity multiple
- 1.44×
- Total profit
- $15,355
- Equity at exit
- $10,808
Cash invested: $35,000 (down + closing). Projections, not guarantees.
Landlord ↔ Tenant lean methodology
- Overall (STATE)
- 85 Strongly Landlord-Friendly
- State North Carolina
- 85 Strongly Landlord-Friendly · R+3
- County
- — inherits STATE
- City
- — inherits STATE
ZIP-level market 28092
- Home prices YoY
- -23.3%
- Rents YoY
- -0.6%
- Active inventory
- 290
- Price-to-rent
- 7.3×
Monthly cashflow live
- Estimated rent
- $1,422 medium interval (Pro) →
- Mortgage (P&I)
- −$656
- Tax from tax record
- −$30 /mo · $363/yr
- Insurance
- −$52
- HOA
- −$0
- Vacancy / Maint / Mgmt
- −$299
- Net cashflow
- $386
Break-even live
UW: 25.0% down · 7.5% · 30yr · 1.5% tax · 5.0% vac · 8.0% maint · 8.0% mgmt
Financing live
Cash to close
- Down payment
- $31,250
- Closing costs
- $3,750
- Reserves months
- —
- Total cash needed
- —
Loan-product check · same deal, 3 products live
Conventional
25% down · 7.5% · 30yr
- Down + closing
- —
- Monthly P&I
- —
- Monthly cashflow
- —
- DSCR
- —
- Eligible?
- —
Personal DTI + credit; lowest rate.
DSCR
20% down · 8.5% · 30yr
- Down + closing
- —
- Monthly P&I
- —
- Monthly cashflow
- —
- DSCR
- —
- Eligible?
- —
No personal income docs; deal must DSCR.
Hard money
10% down · 12.0% · 12mo
- Down + closing
- —
- Monthly P&I
- —
- Monthly cashflow
- —
- DSCR
- —
- Eligible?
- —
Short-term bridge; refi at stabilization.
Listing history 1 events
-
2026-06-07$125,000 Pending 1 DOM
ⓘ Source: listings_history table (triggers on properties + properties_extension) + one-shot
backfill from property_details.listing_events for pre-trigger history.
Tax reassessment forecast NC · Resets to sale price
- Current annual tax
- $363 · $30/mo
- Projected year-2 tax
- $1,025 · $85/mo
- Expected delta
- +$662/yr (+$55/mo · 182.0%)
ⓘ Screening estimate from a state-policy table — verify with the county assessor before closing.
Climate risk First Street
- Flood 1/10 Low FEMA zone X (unshaded) · 0% chance over 30 yrs
- Wildfire 4/10 Moderate
- Heat 5/10 Major 7 d/yr ≥103°F today · 16 d/yr by 30 yrs out
- Wind 3/10 Moderate 5% chance of damaging wind over 30 yrs
- Air quality 3/10 Moderate 3 unhealthy d/yr today · 3 by 30 yrs out
Nearby sold comps map
Loading sold comps map…
Walkable amenities ~0.75 mi
Loading nearby amenities…
Taxation est. · year 1
- Rental income
- $17,065
- − Mortgage interest
- −$7,002
- − Property taxes
- −$363
- − Insurance
- −$625
- − Repairs & maintenance
- −$1,365
- − Management
- −$1,365
- − Depreciation
- −$3,636
- Taxable income
- $2,708
- Est. tax owed @ 24.0%
- −$650
- After-tax cash flow
- $3,977/yr
For passive investors: Depreciation is non-cash, so a rental often shows a tax loss while cash-flowing — sheltering income. Rental losses are passive: they offset passive income freely, and up to $25,000/yr can offset ordinary (W-2) income if you actively participate and your MAGI is under $100k (phasing out to $0 by $150k); unused losses carry forward. On sale, claimed depreciation is recaptured at up to 25%, and gains may owe capital-gains tax (a 1031 exchange can defer both). Figures are a year-1 estimate at your 24.0% rate — not tax advice; consult a CPA.
Schools (NCES district)
- District
- Lincoln County Schools
- NCES district ID
- 3702680
- Math proficiency
- 57% ▲ 7.00%
- Reading proficiency
- 55% ▲ 1.00%
- Median HH income
- $49,203
- Composite
- 47.7/100
- National rank
- #2242
- State rank
- #42 of 178 in NC
Livability — Denver
- Score
- 66/100
- State rank
- #255
- US rank
- #11212
Category grades
Schools grade is shown separately in the Schools card above.
Census & demographics
- County
- Lincoln County · 69,118 people
- City population
- 28,768
- Metro
- Charlotte-Concord-Gastonia, NC-SC
- Population (ZIP)
- 40,350
- Household income
- $60,984
- Rent vs Own
- Severe rent burden
- 1134.0
Population outlook (Lincoln County) Hauer SSP2
- Today (2025)
- 86,972 people
- By 2030
- 89,467 · +2.9%
- By 2040
- 93,107 · +7.1%
- By 2050
- 94,304 · +8.4%
- By 2075
- 95,190 · +9.4%
- By 2100
- 90,096 · +3.6%
Race, ethnicity, and origin ACS 2023
- Neighborhood character
- Predominantly White (76%)
- Race & ethnicity
- White 76% Hispanic / Latino 11% Black 9% Two or more races 7%
- Hispanic origin (detail)
- Mexican 5%
- Common ancestry
- Italian 2% Serbian 1% Slovak 1%
- Foreign-born
- 6% · Canada, Guatemala
- Languages at home
- 90% English-only · Spanish 8% Russian/Polish/Slavic 1%
Political lean MEDSL · Lincoln
- 2024 margin
- Solid R (+45.7) · D 26.8% · R 72.5%
- 2008→2024 swing
- -12.4pp toward R · 2008: -33.3pp · 2024: -45.7pp
- All cycles
- 2024: R+45.7 2020: R+45.9 2016: R+47.7 2012: R+38.9 2008: R+33.3
Not yet ingested
- Civics
- —
Market trends
- HPI YoY
- ▼ -92.94%
- Current HPI
- 306.3997
- Rent YoY
- ▼ -0.58%
- Metro
- Charlotte-Concord-Gastonia, NC-SC
- State GDP YoY
- ▲ 3.28%
- F500 in state
- 26
Industry mix (Fortune 500 HQ in NC)
| Industry | F500 HQs | Revenue |
|---|---|---|
| Financial Services | 2 | $213B |
|
||
| Retail | 2 | $95B |
|
||
| Industrial Conglomerate | 1 | $38B |
|
||
| Metals / Steel | 1 | $35B |
|
||
| Utilities | 1 | $30B |
|
||
| Industrial Machinery | 1 | $19B |
|
||
Price history
+92.3% since first listed4 events — show timeline
- 2026-06-07 Pending — CANOPYMLS as Distributed by MLS Grid
- 2026-06-03 Listed $125,000 CANOPYMLS as Distributed by MLS Grid
- 2007-06-06 Sold (Public Records) $31,000 Public Records
- 2006-04-12 Sold (Public Records) $65,000 Public Records
Property tax history
+2.2%/yrLatest (2025): $363 · +1.3% YoY. Source: county tax records.
Cash-flow waterfall
monthlySold comps — $/sqft
last 12 mo · ≤1 miLoading sold comps…