 🏗️ New Construction
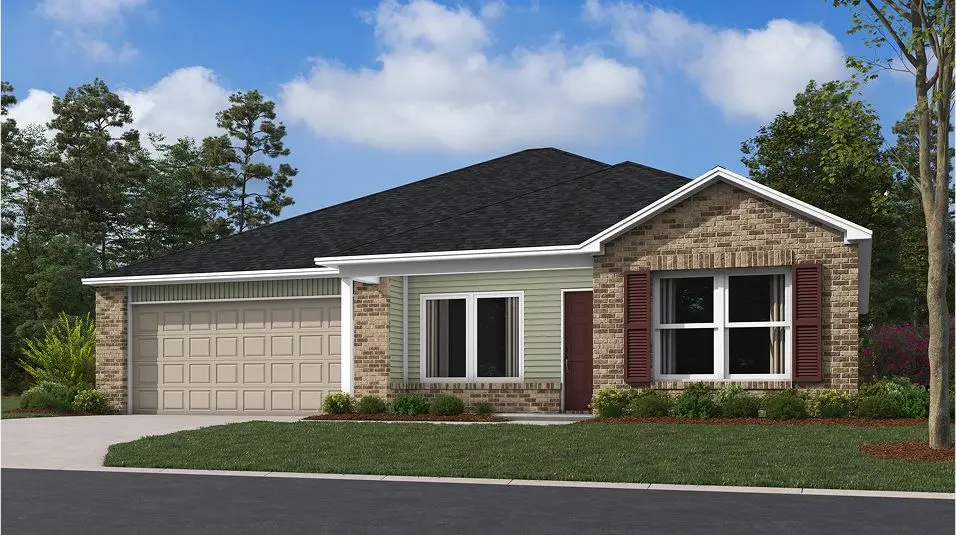
Rc Carnegie II Plan · Jonesboro, AR
Flood risk 1/10 · Minimal
- FEMA flood zone
- X
- Chance of flooding over 30 yrs
- 0.0%
- Est. flood insurance / yr
- $507 – $1,088
Fire risk 3/10 · Minor
- Est. fire insurance / yr
- $1,499 – $2,785
Heat risk 5/10 · Moderate
- Hot days now (above 109°F)
- 7 days/yr
- Hot days in 30 yrs
- 20 days/yr
Wind risk 4/10 · Minor
- Chance of severe wind over 30 yrs
- 10.0%
Air-quality risk 2/10 · Minimal
- Unhealthy air days now
- 0 days/yr
- Unhealthy air days in 30 yrs
- 2 days/yr
Risk factors via First Street. Map © Google.
Why this score? — see what drove the D+ grade
The composite is a weighted blend of 9 inputs, each scored 0–100. Each bar is that input's sub-score; the figure is the points it added to the 100-point composite (weight × sub-score).
- Cash flow +15.0/30.0
- ARV discount +7.5/15.0
- Schools +5.2/10.0
- DSCR +4.6/10.0
- 1% rule +4.1/10.0
- Condition / age +4.0/5.0
- Livability +3.2/5.0
- Rent growth +2.7/5.0
- Appreciation +0.0/10.0
$225,900
🖨 Deal sheet (PDF) 📄 Offer letter ✓ Due diligence
Listing remarks MLS
This new single-story home is ready for modern lifestyles. An open-concept floorplan shared between the kitchen and living room encourages simple everyday transitions and multitasking. Three secondary bedrooms are tucked away to the side of the home, opposite from the luxurious owner's suite with a full bathroom and walk-in closet.
Key facts
- Full bathroom
- Walk-in closet
- Owner's suite
Tags
Neighborhood map
What this means for you Summary
Snapshot
- This is a 4-bed/2.0-bath single-family listed at $226k. Condition is rated good.
Deal economics
- At list price, monthly cash flow is $68 ($816/yr) — positive.
- The deal already cash-flows at list — no discount required.
- To meet the 1% rule (rent ≥ 1% of price), the offer needs to be $202k (10.6% below list).
- Recommended offer: $199k (12.0% below list) — sets the bar for market timing.
- Cap rate 6.7% vs local median 4.4% in Jonesboro — top-decile yield for the area; either an underpriced asset or a hidden risk that comps aren't pricing in. Stress-test before assuming the spread holds.
Location & tenants
- Location reads 65/100 on livability (#145 in AR) — a middle-class / working-renter tenant base. Strengths: cost of living A+, housing A+, health & safety A+; Watch: crime F, amenities F, commute F.
- Valley View School District (rural): math 55% / reading 60% proficiency, ranked #4 of 238 in AR (top 2%) — acceptable for families but not a draw, mixed tenant base, ~2y average lease; only 19% free/reduced lunch — higher-income household profile.
- Zoned schools: Valley View Intermediate School (math 61% / reading 58%, grade B-, #38 of 454 statewide, top 9%, 893 students, 30% FRL); Valley View Junior High School (math 54% / reading 65%, grade B, #12 of 201 statewide, top 6%, 712 students, 25% FRL); Valley View High School (math 32% / reading 52%, grade F, #38 of 292 statewide, top 14%, 631 students, 22% FRL).
- Market conditions: Rents flat; 309 active listings in the ZIP; 2 comparable units currently listed for rent nearby; 926 units permitted in Craighead County in 2024 (69 in 5+ unit buildings).
- This rent runs 34% of the median local income ($70k/yr) — at the standard rent-burdened threshold; future hikes will face affordability resistance.
Forward outlook
- Local home prices are declining (-3.0%/yr); year-one equity from $2k of loan paydown is wiped out by about $7k of value loss. Plan a longer hold.
- Craighead County population projected at +38% by 2050 — long-run rental-demand tailwind backs the buy-and-hold thesis.
Negotiation context
- It's been on market 125 days — a 12% lower offer ($199k) is reasonable based on typical stale-listing flexibility.
Risks & watch-outs
- Climate carrying-cost: extreme-heat days projected 7→20/yr by 2055 (HVAC capex compounding) — expect insurance premiums to compound above CPI over the hold.
Questions for the listing agent
- It's been on market 125 days. Have you received any prior offers? Is the seller open to a 12% concession, seller financing, or rate buy-down credit?
- Why hasn't it sold? Are there any deal-killer items the seller is aware of (foundation, flood, title, zoning, code violations)?
- Is there a deadline driving the sale (1031 exchange, divorce, estate, relocation)? That informs how much negotiation room exists.
- Schools are D-rated, which usually means shorter tenancies and higher turnover. Who's the typical renter profile here, and what's been the actual vacancy rate?
- Crime grade is F in this area — have there been break-ins, vandalism, or insurance claims at this property in the last 3 years? What carrier currently insures it and at what premium?
- The area grade is low — what's the realistic commute time and amenity access for the typical tenant pool here? Any planned neighborhood developments (good or bad) we should know about?
- What's the average days-on-market for RENTAL listings here right now (not sales)? A rising rental-DOM trend means longer vacancies and softer asking-rent achievability than the comps imply.
- What's the recent tenant-quality profile in this submarket — average credit score on applications, eviction rate, late-payment / NSF rate, and stable-employment percentage? A property-management company in the area should have these aggregated.
- How much new for-sale + rental construction is in the pipeline within 1–3 miles? Heavy new supply typically softens prices + rents 12–24 months out; constrained supply supports both.
Investment metrics
- 1% rule
- 0.91% ✗
- Cap rate
- 6.66%
- Cash-on-cash
- 1.32%
- DSCR
- 1.06
- GRM
- 9.1
CMA / ARV
- ARV (median comp)
- $220,900
- List price
- $225,900
- Delta
- 2.26%
- Verdict
- FAIR
- Comps
- 20 within 1.0 mi
Show comp detail 12 sales within ~0.75 mi
| Address | Dist | Beds/Ba | Sqft | Sold | Price | $/sf | Match |
|---|---|---|---|---|---|---|---|
| 5249 Orchard Pass Pass | 0.02mi | 4/2.0 | 1,496 (+2%) | 1mo | $219,900 | $147 | 95 |
| 5245 Orchard Pass Pass | 0.02mi | 3/2.0 (-1) | 1,523 (+4%) | 1mo | $220,900 | $145 | 87 |
| 5317 Orchard Pass Pass | 0.02mi | 3/2.0 (-1) | 1,355 (-8%) | 0mo | $220,900 | $163 | 81 |
| 5241 Orchard Pass Pass | 0.02mi | 3/2.0 (-1) | 1,355 (-8%) | 1mo | $212,000 | $156 | 80 |
| 5304 Orchard Pass Pass | 0.03mi | 3/2.0 (-1) | 1,355 (-8%) | 1mo | $214,900 | $159 | 80 |
| 5238 Orchard Pass Pass | 0.03mi | 3/2.0 (-1) | 1,355 (-8%) | 1mo | $216,900 | $160 | 80 |
| 6005 Beaver Creek Ln | 0.25mi | 3/2.0 (-1) | 1,508 (+3%) | 0mo | $242,500 | $161 | 79 |
| 5300 Orchard Pass Pass | 0.03mi | 4/2.0 | 1,640 (+12%) | 1mo | $235,900 | $144 | 79 |
| 5246 Orchard Pass | 0.03mi | 4/2.0 | 1,640 (+12%) | 2mo | $226,500 | $138 | 78 |
| 5313 Orchard Pass Pass | 0.02mi | 3/2.0 (-1) | 1,288 (-12%) | 0mo | $215,900 | $168 | 73 |
| 5237 Orchard Pass Pass | 0.02mi | 3/2.0 (-1) | 1,288 (-12%) | 1mo | $208,100 | $162 | 73 |
| 3624 Leafy Pass | 0.17mi | 3/2.0 (-1) | 1,595 (+8%) | 1mo | $228,000 | $143 | 72 |
Match score weights: distance 35% · size 25% · config 20% · recency 20%. Top-matched comps best support the ARV.
Projected returns pro-forma
-3.0% appreciation · 0.74% rent growth · sell at horizon
- IRR
- -16.8%
- Equity multiple
- 0.42×
- Total profit
- $-35,923
- Equity at exit
- $32,937
- IRR
- -13.3%
- Equity multiple
- 0.30×
- Total profit
- $-43,184
- Equity at exit
- $19,099
Cash invested: $61,852 (down + closing). Projections, not guarantees.
Landlord ↔ Tenant lean methodology
- Overall (STATE)
- 92 Strongly Landlord-Friendly
- State Arkansas
- 92 Strongly Landlord-Friendly · R+14
- County
- — inherits STATE
- City
- — inherits STATE
ZIP-level market 72404
- Home prices YoY
- -14.5%
- Rents YoY
- 0.7%
- Active inventory
- 309
- Price-to-rent
- 9.3×
Monthly cashflow live
- Estimated rent
- $2,018 medium interval (Pro) →
- Mortgage (P&I)
- −$1,158
- Tax est. 1.5%
- −$276 /mo · $3,314/yr
- Insurance
- −$92
- HOA
- −$0
- Vacancy / Maint / Mgmt
- −$424
- Net cashflow
- $68
Break-even live
Sensitivity live
| Price | -10% $221 | -5% $144 | +0% $68 | +5% $-8 | +10% $-85 |
|---|---|---|---|---|---|
| Rent | -10% $-91 | -5% $-12 | +0% $68 | +5% $148 | +10% $227 |
| Rate | -1.0pp $179 | -0.5pp $124 | base $68 | +0.5pp $11 | +1.0pp $-47 |
UW: 25.0% down · 7.5% · 30yr · 1.5% tax · 5.0% vac · 8.0% maint · 8.0% mgmt
Financing live
Cash to close
- Down payment
- $55,225
- Closing costs
- $6,627
- Reserves months
- —
- Total cash needed
- —
Loan-product check · same deal, 3 products live
Conventional
25% down · 7.5% · 30yr
- Down + closing
- —
- Monthly P&I
- —
- Monthly cashflow
- —
- DSCR
- —
- Eligible?
- —
Personal DTI + credit; lowest rate.
DSCR
20% down · 8.5% · 30yr
- Down + closing
- —
- Monthly P&I
- —
- Monthly cashflow
- —
- DSCR
- —
- Eligible?
- —
No personal income docs; deal must DSCR.
Hard money
10% down · 12.0% · 12mo
- Down + closing
- —
- Monthly P&I
- —
- Monthly cashflow
- —
- DSCR
- —
- Eligible?
- —
Short-term bridge; refi at stabilization.
Rent comps 2 comps
| Address | Beds | Baths | Sqft | Rent | $/sqft | DOM | Units | Dist |
|---|---|---|---|---|---|---|---|---|
| 5242 Orchard Pass Jonesboro, AR | 4.0 | 1.0 | 1500 | $1,700 | $1.13 | 45d | 1 | 0.03mi |
| 3632 Leafy Pass Jonesboro, AR | 3.0 | 2.0 | 1662 | $1,750 | $1.05 | 45d | 1 | 0.14mi |
Listing history 20 events
-
2026-06-21days on market $225,900 Active 125 DOM
-
2026-06-19days on market $225,900 Active 123 DOM
-
2026-06-18days on market $225,900 Active 122 DOM
-
2026-06-17days on market $225,900 Active 121 DOM
-
2026-06-16days on market $225,900 Active 120 DOM
-
2026-06-15days on market $225,900 Active 119 DOM
-
2026-06-14days on market $225,900 Active 117 DOM
-
2026-06-13days on market $225,900 Active 116 DOM
-
2026-06-10days on market $225,900 Active 114 DOM
-
2026-06-09days on market $225,900 Active 113 DOM
-
2026-06-08days on market $225,900 Active 112 DOM
-
2026-06-07days on market $225,900 Active 111 DOM
-
2026-06-05days on market $225,900 Active 108 DOM
-
2026-06-03days on market $225,900 Active 107 DOM
-
2026-06-02days on market $225,900 Active 106 DOM
-
2026-06-01days on market $225,900 Active 105 DOM
-
2026-05-31days on market $225,900 Active 104 DOM
-
2026-05-30days on market $225,900 Active 103 DOM
-
2026-02-28price $225,900 333-char remark
Show marketing remark (333 chars)
This new single-story home is ready for modern lifestyles. An open-concept floorplan shared between the kitchen and living room encourages simple everyday transitions and multitasking. Three secondary bedrooms are tucked away to the side of the home, opposite from the luxurious owner's suite with a full bathroom and walk-in closet.
-
2026-02-16$229,900 Active 333-char remark
Show marketing remark (333 chars)
This new single-story home is ready for modern lifestyles. An open-concept floorplan shared between the kitchen and living room encourages simple everyday transitions and multitasking. Three secondary bedrooms are tucked away to the side of the home, opposite from the luxurious owner's suite with a full bathroom and walk-in closet.
ⓘ Source: listings_history table (triggers on properties + properties_extension) + one-shot
backfill from property_details.listing_events for pre-trigger history.
Climate risk First Street
- Flood 1/10 Low FEMA zone X · 0% chance over 30 yrs
- Wildfire 3/10 Moderate
- Heat 5/10 Major 7 d/yr ≥109°F today · 20 d/yr by 30 yrs out
- Wind 4/10 Moderate 10% chance of damaging wind over 30 yrs
- Air quality 2/10 Low 0 unhealthy d/yr today · 2 by 30 yrs out
Nearby sold comps map
Loading sold comps map…
Walkable amenities ~0.75 mi
Loading nearby amenities…
Taxation est. · year 1
- Rental income
- $24,222
- − Mortgage interest
- −$12,374
- − Property taxes
- −$3,314
- − Insurance
- −$1,104
- − Repairs & maintenance
- −$1,938
- − Management
- −$1,938
- − Depreciation
- −$6,426
- Taxable loss
- −$2,872
- Est. tax savings @ 24.0%
- +$689
- After-tax cash flow
- $1,505/yr
For passive investors: Depreciation is non-cash, so a rental often shows a tax loss while cash-flowing — sheltering income. Rental losses are passive: they offset passive income freely, and up to $25,000/yr can offset ordinary (W-2) income if you actively participate and your MAGI is under $100k (phasing out to $0 by $150k); unused losses carry forward. On sale, claimed depreciation is recaptured at up to 25%, and gains may owe capital-gains tax (a 1031 exchange can defer both). Figures are a year-1 estimate at your 24.0% rate — not tax advice; consult a CPA.
Condition & rehab AI · 1 photo
This single-story home is in good condition with a good exterior and interior. It is ready for a cosmetic upgrade to enhance its curb appeal and value.
Value-add opportunities
- Resale Paint exterior shutters — Enhances curb appeal and can be a quick, low-cost improvement
- Both Landscaping — Improves curb appeal and can attract more potential buyers or renters
Renovation cost estimate screening
Value-add ROI direction
- Resale Paint exterior shutters — Enhances curb appeal and can be a quick, low-cost improvement ↑
- Both Landscaping — Improves curb appeal and can attract more potential buyers or renters ↑
ⓘ Cost ranges are severity-bucket heuristics (US national rule-of-thumb). Get contractor quotes + a written scope before underwriting a rehab budget.
Schools (NCES district)
- District
- Valley View School District
- NCES district ID
- 0513380
- Math proficiency
- 55% ▼ -11.00%
- Reading proficiency
- 60% ▼ -10.00%
- Median HH income
- $79,148
- Composite
- 51.78/100
- National rank
- #1672
- State rank
- #4 of 238 in AR
Livability — Jonesboro
- Score
- 65/100
- State rank
- #145
- US rank
- #12692
Category grades
Schools grade is shown separately in the Schools card above.
Census & demographics
- Census place
- Jonesboro, AR
- County
- Craighead County · 97,185 people
- City population
- 91,245
- Metro
- Jonesboro, AR
- Population (ZIP)
- 29,968
- Household income
- $70,269
- Rent vs Own
- Severe rent burden
- 869.0
Population outlook (Craighead County) Hauer SSP2
- Today (2025)
- 122,235 people
- By 2030
- 131,338 · +7.4%
- By 2040
- 149,862 · +22.6%
- By 2050
- 168,034 · +37.5%
- By 2075
- 208,094 · +70.2%
- By 2100
- 233,251 · +90.8%
Race, ethnicity, and origin ACS 2023
- Neighborhood character
- Predominantly White (72%)
- Race & ethnicity
- White 72% Black 18% Two or more races 5% Hispanic / Latino 4% Asian 2%
- Common ancestry
- Slovak 3% Lithuanian 1% Italian 1%
- Foreign-born
- 5% · Canada, China, South Korea
- Languages at home
- 95% English-only · Spanish 3% Chinese 1%
Political lean MEDSL · Craighead
- 2024 margin
- Solid R (+37.4) · D 30.1% · R 67.5% · Other 2.4%
- 2008→2024 swing
- -12.9pp toward R · 2008: -24.5pp · 2024: -37.4pp
- All cycles
- 2024: R+37.4 2020: R+35.4 2016: R+35.2 2012: R+31.1 2008: R+24.5
Not yet ingested
- Civics
- —
Market trends
- HPI YoY
- ▼ -35.22%
- Current HPI
- 208.3772
- Rent YoY
- ▲ 0.74%
- Metro
- Jonesboro, AR
- State GDP YoY
- ▲ 3.80%
- F500 in state
- 10
Industry mix (Fortune 500 HQ in AR)
| Industry | F500 HQs | Revenue |
|---|---|---|
| Retail | 1 | $681B |
|
||
| Food / Agriculture | 1 | $53B |
|
||
| Retail / Energy | 1 | $22B |
|
||
| Transportation / Logistics | 1 | $12B |
|
||
| Energy | 1 | $4B |
|
||
Price history
-1.7% since first listed2 events — show timeline
- 2026-02-28 Price Changed $225,900 Zillow
- 2026-02-16 Listed $229,900 Zillow
Cash-flow waterfall
monthlySold comps — $/sqft
last 12 mo · ≤1 miLoading sold comps…