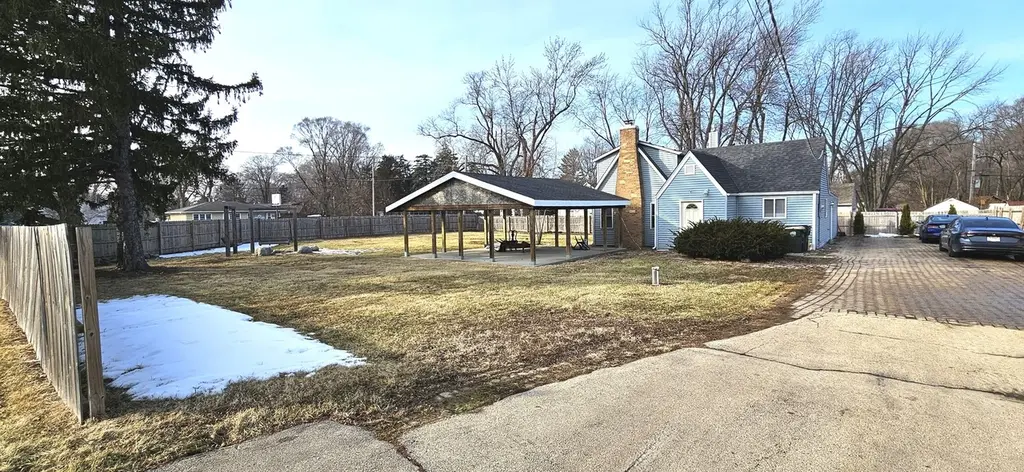
36107 N Green Bay Rd · Waukegan, IL
Flood risk 1/10 · Minimal
- FEMA flood zone
- X (unshaded)
- Chance of flooding over 30 yrs
- 0.0%
- Est. flood insurance / yr
- $507 – $1,088
Fire risk 1/10 · Minimal
- Est. fire insurance / yr
- $804 – $1,492
Heat risk 2/10 · Minimal
- Hot days now (above 98°F)
- 7 days/yr
- Hot days in 30 yrs
- 13 days/yr
Wind risk 2/10 · Minimal
- Chance of severe wind over 30 yrs
- —
Air-quality risk 3/10 · Minor
- Unhealthy air days now
- 2 days/yr
- Unhealthy air days in 30 yrs
- 3 days/yr
Risk factors via First Street. Map © Google.
Why this score? — see what drove the D grade
The composite is a weighted blend of 9 inputs, each scored 0–100. Each bar is that input's sub-score; the figure is the points it added to the 100-point composite (weight × sub-score).
- Cash flow +13.6/30.0
- ARV discount +11.4/15.0
- DSCR +4.1/10.0
- Livability +3.8/5.0
- 1% rule +3.3/10.0
- Rent growth +2.5/5.0
- Condition / age +2.5/5.0
- Schools +0.8/10.0
- Appreciation +0.0/10.0
$300,000
🖨 Deal sheet 📄 Offer letter ✓ Due diligence
Listing remarks MLS
Gorgeous property on a large lot! Comfort, peace of mind and space on the outside for entertaining all of your guests. Home offer 4 bedrooms and 1 full bath. Beautiful kitchen. New Roof, Carpet and Paint. Don't let this one get away!
Key facts
- Newer roof
- Expansive yard
- Minutes from i-94
Tags
Property features AI
Finance
- Other: Property is not currently leased; Possession at closing; immediate or negotiable
- HOA & community: No master association fee required; Community features include curbs, sidewalks, street lights and paved streets
Exterior
- Parking: Parking for 10 vehicles; Asphalt and brick driveway; owned driveway
- Utilities: Well water; Septic tank sewer; 100 amp electric service with circuit breakers; Cable available
- Home design: Detached single-family home; 1.5-story layout; Fee simple ownership; Built approximately 91–100 years ago; Not rebuilt or recently rehabilitated
- Construction: Vinyl siding; Asphalt roof; Concrete perimeter foundation; Built before 1978
- Exterior features: Corner lot; Fenced yard with wood fencing; Curbs, sidewalks and street lights nearby; Street is paved
Interior
- Kitchen: Kitchen with eating area (17 x 10); Range; Microwave; Refrigerator
- Bedrooms: 4 bedrooms total; Master bedroom on main level; Three additional bedrooms on second level (13 x 10; 14 x 13; 12 x 10)
- Flooring: Hardwood in living and dining areas; Carpet in bedrooms and family room; Ceramic tile in kitchen
- Bathrooms: 1 full bathroom
- Heating & cooling: Natural gas forced air heating; Central air conditioning
- Interior features: First-floor bedroom; 8 total rooms; Hardwood flooring throughout main living areas
- Laundry & utility: Main-level laundry; Gas dryer hookup; Washer and dryer included; Laundry closet; Water softener (owned)
Neighborhood map
What this means for you Summary
Snapshot
- This is a 3-bed/1.0-bath single-family listed at $300k.
Deal economics
- At list price, monthly cash flow is $17 ($202/yr) — positive.
- The deal already cash-flows at list — no discount required.
- To meet the 1% rule (rent ≥ 1% of price), the offer needs to be $248k (17.2% below list).
- Recommended offer: $248k (17.2% below list) — sets the bar for 1% rule.
- Cap rate 6.4% vs local median 4.6% in Waukegan — top-decile yield for the area; either an underpriced asset or a hidden risk that comps aren't pricing in. Stress-test before assuming the spread holds.
Location & tenants
- Location reads 75/100 on livability (#216 in IL, #4,074 nationally) — a middle-class / working-renter tenant base. Strengths: commute A+, cost of living A+, housing A+; Watch: employment C-, crime D, schools F.
- Waukegan CUSD 60 (suburban): math 7% / reading 10% proficiency, ranked #587 of 620 in IL (top 95%) — low school quality limits family demand, transient renter base, plan for 1-2y turnover; 66% free/reduced lunch — lower-income household profile, screen leases tightly.
- Market conditions: 40 active listings in the ZIP; 2 comparable units currently listed for rent nearby; solid renter incomes; 948 units permitted in Lake County in 2024 (424 in 5+ unit buildings).
- This rent runs 39% of the median local income ($77k/yr) — at the standard rent-burdened threshold; future hikes will face affordability resistance.
Forward outlook
- Local home prices are declining (-3.0%/yr); year-one equity from $2k of loan paydown is wiped out by about $9k of value loss. Plan a longer hold.
- Lake County population projected to shrink 8% by 2050 — rents likely to lag national; underwrite the cash flow, not the appreciation.
Negotiation context
- It's been on market 27 days — a 2% lower offer ($296k) is reasonable based on typical stale-listing flexibility.
- 5 sale attempts since 19y ago; this cycle's ask is 6% above the opening price — seller raised mid-cycle; expect resistance to lowballs.
Risks & watch-outs
- Watch-outs: built in 1935 — expect roof / HVAC / electrical / plumbing capex.
Questions for the listing agent
- Built in 1935 — when were the roof, HVAC, electrical panel, plumbing, and water heater last replaced?
- Is there a deadline driving the sale (1031 exchange, divorce, estate, relocation)? That informs how much negotiation room exists.
- Schools are F-rated, which usually means shorter tenancies and higher turnover. Who's the typical renter profile here, and what's been the actual vacancy rate?
- Crime grade is D in this area — have there been break-ins, vandalism, or insurance claims at this property in the last 3 years? What carrier currently insures it and at what premium?
- The area grade is low — what's the realistic commute time and amenity access for the typical tenant pool here? Any planned neighborhood developments (good or bad) we should know about?
- What's the average days-on-market for RENTAL listings here right now (not sales)? A rising rental-DOM trend means longer vacancies and softer asking-rent achievability than the comps imply.
- What's the recent tenant-quality profile in this submarket — average credit score on applications, eviction rate, late-payment / NSF rate, and stable-employment percentage? A property-management company in the area should have these aggregated.
- How much new for-sale + rental construction is in the pipeline within 1–3 miles? Heavy new supply typically softens prices + rents 12–24 months out; constrained supply supports both.
Investment metrics
- 1% rule
- 0.83% ✗
- Cap rate
- 6.36%
- Cash-on-cash
- 0.24%
- DSCR
- 1.01
- GRM
- 10.1
CMA / ARV
- ARV (median comp)
- $328,589
- List price
- $300,000
- Delta
- -8.70%
- Verdict
- FAIR
- Comps
- 20 within 1.0 mi
Show comp detail 12 sales within ~0.75 mi
| Address | Dist | Beds/Ba | Sqft | Sold | Price | $/sf | Match |
|---|---|---|---|---|---|---|---|
| 36107 N Green Bay Rd | 0.00mi | 4/1.0 (+1) | 1,710 (0%) | 20mo | $263,000 | $154 | 79 |
| 3436 Florida Ave | 0.18mi | 3/2.0 | 1,820 (+6%) | 6mo | $383,000 | $210 | 72 |
| 1856 Magnolia Ave | 0.45mi | 3/2.0 | 1,702 (-0%) | 8mo | $350,000 | $206 | 67 |
| 3517 Glen Flora Ave | 0.64mi | 3/2.0 | 1,700 (-1%) | 2mo | $366,000 | $215 | 63 |
| 3627 Atlantic Ave | 0.48mi | 3/1.5 | 1,600 (-6%) | 6mo | $305,000 | $191 | 60 |
| 3426 Country Club Ave | 0.27mi | 4/3.0 (+1) | 1,613 (-6%) | 8mo | $355,000 | $220 | 58 |
| 3668 Atlantic Ave | 0.48mi | 3/2.0 | 1,728 (+1%) | 17mo | $335,000 | $194 | 58 |
| 1277 Magnolia Ave | 0.73mi | 3/2.0 | 1,694 (-1%) | 16mo | $350,000 | $207 | 46 |
| 3421 Atlantic Ave | 0.33mi | 4/1.5 (+1) | 1,456 (-15%) | 11mo | $270,000 | $185 | 43 |
| 2910 W Clearview Ave | 0.55mi | 3/1.5 | 1,456 (-15%) | 9mo | $310,000 | $213 | 40 |
| 2229 Winnebago Rd | 0.72mi | 3/2.0 | 1,536 (-10%) | 9mo | $263,000 | $171 | 38 |
| 3002 W Lee Ave | 0.64mi | 3/3.0 | 1,850 (+8%) | 18mo | $305,000 | $165 | 33 |
Match score weights: distance 35% · size 25% · config 20% · recency 20%. Top-matched comps best support the ARV.
Projected returns pro-forma
-3.0% appreciation · 3.0% rent growth · sell at horizon
- IRR
- -15.9%
- Equity multiple
- 0.43×
- Total profit
- $-47,580
- Equity at exit
- $44,731
- IRR
- -7.6%
- Equity multiple
- 0.52×
- Total profit
- $-40,215
- Equity at exit
- $25,939
Cash invested: $84,000 (down + closing). Projections, not guarantees.
Landlord ↔ Tenant lean methodology
- Overall (STATE)
- 43 Moderately Tenant-Leaning
- State Illinois
- 43 Moderately Tenant-Leaning · D+7
- County
- — inherits STATE
- City
- — inherits STATE
ZIP-level market 60087
- Home prices YoY
- -20.3%
- Active inventory
- 40
- Price-to-rent
- 10.1×
Monthly cashflow live
- Estimated rent
- $2,484 medium interval (Pro) →
- Mortgage (P&I)
- −$1,573
- Tax from tax record
- −$247 /mo · $2,965/yr
- Insurance
- −$125
- HOA
- −$0
- Vacancy / Maint / Mgmt
- −$522
- Net cashflow
- $17
Break-even live
UW: 25.0% down · 7.5% · 30yr · 1.5% tax · 5.0% vac · 8.0% maint · 8.0% mgmt
Financing live
Cash to close
- Down payment
- $75,000
- Closing costs
- $9,000
- Reserves months
- —
- Total cash needed
- —
Loan-product check · same deal, 3 products live
Conventional
25% down · 7.5% · 30yr
- Down + closing
- —
- Monthly P&I
- —
- Monthly cashflow
- —
- DSCR
- —
- Eligible?
- —
Personal DTI + credit; lowest rate.
DSCR
20% down · 8.5% · 30yr
- Down + closing
- —
- Monthly P&I
- —
- Monthly cashflow
- —
- DSCR
- —
- Eligible?
- —
No personal income docs; deal must DSCR.
Hard money
10% down · 12.0% · 12mo
- Down + closing
- —
- Monthly P&I
- —
- Monthly cashflow
- —
- DSCR
- —
- Eligible?
- —
Short-term bridge; refi at stabilization.
Rent comps 2 comps
| Address | Beds | Baths | Sqft | Rent | $/sqft | DOM | Units | Dist |
|---|---|---|---|---|---|---|---|---|
| 1244 Pine Grove Ave Gurnee, IL | 3.0 | 2.5 | 1920 | $3,400 | $1.77 | 24d | 1 | 0.71mi |
| 2025 Greystem Cir Gurnee, IL | 2.0 | 1.0–2.0 | 827 | $2,425 | $2.93 | 1d | 43 | 1.13mi |
Listing history 26 events
-
2026-06-09days on market $300,000 Active 27 DOM
-
2026-06-08days on market $300,000 Active 26 DOM
-
2026-06-07days on market $300,000 Active 25 DOM
-
2026-06-04days on market $300,000 Active 22 DOM
-
2026-06-03days on market $300,000 Active 21 DOM
-
2026-06-02days on market $300,000 Active 20 DOM
-
2026-06-01days on market $300,000 Active 19 DOM
-
2026-05-31days on market $300,000 Active 18 DOM
-
2026-05-13historical
-
2026-05-13$300,000 Active 1210-char remark
-
2026-04-23price
-
2026-03-13price
-
2026-02-18Active
-
2024-11-12soldstatus $263,000
-
2024-11-04soldstatus $263,000 Closed
Show marketing remark (233 chars)
Gorgeous property on a large lot! Comfort, peace of mind and space on the outside for entertaining all of your guests. Home offer 4 bedrooms and 1 full bath. Beautiful kitchen. New Roof, Carpet and Paint. Don't let this one get away!
-
2024-09-23historical Contingent - No Showings
Show marketing remark (233 chars)
Gorgeous property on a large lot! Comfort, peace of mind and space on the outside for entertaining all of your guests. Home offer 4 bedrooms and 1 full bath. Beautiful kitchen. New Roof, Carpet and Paint. Don't let this one get away!
-
2024-09-14price $279,000
Show marketing remark (233 chars)
Gorgeous property on a large lot! Comfort, peace of mind and space on the outside for entertaining all of your guests. Home offer 4 bedrooms and 1 full bath. Beautiful kitchen. New Roof, Carpet and Paint. Don't let this one get away!
-
2024-08-23$284,000 Active
Show marketing remark (233 chars)
Gorgeous property on a large lot! Comfort, peace of mind and space on the outside for entertaining all of your guests. Home offer 4 bedrooms and 1 full bath. Beautiful kitchen. New Roof, Carpet and Paint. Don't let this one get away!
-
2024-06-11soldstatus $147,500 Closed
-
2024-06-11soldstatus $147,500
-
2009-06-10historical
-
2009-04-22price
-
2009-04-17
-
2007-12-27historical
-
2007-08-06
-
2004-04-14soldstatus $90,000
ⓘ Source: listings_history table (triggers on properties + properties_extension) + one-shot
backfill from property_details.listing_events for pre-trigger history.
Tax reassessment forecast IL · Partial reset (capped growth)
- Current annual tax
- $2,965 · $247/mo
- Projected year-2 tax
- $4,887 · $407/mo
- Expected delta
- +$1,923/yr (+$160/mo · 64.9%)
ⓘ Screening estimate from a state-policy table — verify with the county assessor before closing.
Climate risk First Street
- Flood 1/10 Low FEMA zone X (unshaded) · 0% chance over 30 yrs
- Wildfire 1/10 Low
- Heat 2/10 Low 7 d/yr ≥98°F today · 13 d/yr by 30 yrs out
- Wind 2/10 Low
- Air quality 3/10 Moderate 2 unhealthy d/yr today · 3 by 30 yrs out
Nearby sold comps map
Loading sold comps map…
Walkable amenities ~0.75 mi
Loading nearby amenities…
Taxation est. · year 1
- Rental income
- $29,805
- − Mortgage interest
- −$16,805
- − Property taxes
- −$2,965
- − Insurance
- −$1,500
- − Repairs & maintenance
- −$2,384
- − Management
- −$2,384
- − Depreciation
- −$8,727
- Taxable loss
- −$4,960
- Est. tax savings @ 24.0%
- +$1,191
- After-tax cash flow
- $1,393/yr
For passive investors: Depreciation is non-cash, so a rental often shows a tax loss while cash-flowing — sheltering income. Rental losses are passive: they offset passive income freely, and up to $25,000/yr can offset ordinary (W-2) income if you actively participate and your MAGI is under $100k (phasing out to $0 by $150k); unused losses carry forward. On sale, claimed depreciation is recaptured at up to 25%, and gains may owe capital-gains tax (a 1031 exchange can defer both). Figures are a year-1 estimate at your 24.0% rate — not tax advice; consult a CPA.
Schools (NCES district)
- District
- Waukegan CUSD 60
- NCES district ID
- 1741250
- Math proficiency
- 7% ▼ -8.00%
- Reading proficiency
- 10% ▼ -8.00%
- Median HH income
- $43,248
- Composite
- 7.73/100
- National rank
- #9939
- State rank
- #587 of 620 in IL
Livability — Waukegan
- Score
- 75/100
- State rank
- #216
- US rank
- #4074
Category grades
Schools grade is shown separately in the Schools card above.
Census & demographics
- County
- Lake County · 591,991 people
- City population
- 99,634
- Metro
- Chicago-Naperville-Elgin, IL-IN-WI
- Population (ZIP)
- 27,293
- Household income
- $76,738
- Rent vs Own
- Severe rent burden
- 894.0
Population outlook (Lake County) Hauer SSP2
- Today (2025)
- 700,217 people
- By 2030
- 693,290 · -1.0%
- By 2040
- 673,588 · -3.8%
- By 2050
- 643,556 · -8.1%
- By 2075
- 562,792 · -19.6%
- By 2100
- 457,715 · -34.6%
Race, ethnicity, and origin ACS 2023
- Neighborhood character
- Diverse neighborhood (Simpson 0.60)
- Race & ethnicity
- Hispanic / Latino 56% White 25% Two or more races 20% Black 15% Asian 3% Native American 2%
- Hispanic origin (detail)
- Mexican 40% Puerto Rican 7%
- Common ancestry
- Romanian 2% Italian 1% Slovak 1%
- Foreign-born
- 25% · Canada, United Kingdom
- Languages at home
- 49% English-only · Spanish 46% French/Haitian/Cajun 1% Other Asian/Pacific 1%
Political lean MEDSL · Lake
- 2024 margin
- Strong D (+20.8) · D 59.7% · R 38.9% · Other 1.4%
- 2008→2024 swing
- +1.1pp toward D · 2008: 19.6pp · 2024: 20.8pp
- All cycles
- 2024: D+20.8 2020: D+24.1 2016: D+20.3 2012: D+8.1 2008: D+19.6
Not yet ingested
- Civics
- —
Market trends
- HPI YoY
- ▼ -62.05%
- Current HPI
- 243.1613
- Rent YoY
- —
- Metro
- Chicago-Naperville-Elgin, IL-IN-WI
- State GDP YoY
- ▲ 1.59%
- F500 in state
- 60
Industry mix (Fortune 500 HQ in IL)
| Industry | F500 HQs | Revenue |
|---|---|---|
| Insurance | 4 | $201B |
|
||
| Consumer Goods | 4 | $87B |
|
||
| Industrial Machinery | 3 | $64B |
|
||
| Healthcare | 2 | $55B |
|
||
| Retail / Pharmacy | 1 | $148B |
|
||
| Agriculture / Food | 1 | $86B |
|
||
Price history
+192.2% since first listed19 events — show timeline
- 2026-06-11 Listing Removed — MRED as Distributed by MLS Grid
- 2026-05-13 Listing Removed — MRED as Distributed by MLS Grid
- 2026-05-13 Listed — MRED as Distributed by MLS Grid
- 2026-04-23 Price Changed — MRED as Distributed by MLS Grid
- 2026-03-13 Price Changed — MRED as Distributed by MLS Grid
- 2026-02-18 Listed — MRED as Distributed by MLS Grid
- 2024-11-12 Sold (Public Records) $263,000 Public Records
- 2024-11-04 Sold (MLS) $263,000 MRED as Distributed by MLS Grid
- 2024-09-23 Contingent — MRED as Distributed by MLS Grid
- 2024-09-14 Price Changed $279,000 MRED as Distributed by MLS Grid
- 2024-08-23 Listed $284,000 MRED as Distributed by MLS Grid
- 2024-06-11 Sold (Public Records) $147,500 Public Records
- 2024-06-11 Sold (MLS) $147,500 MRED as Distributed by MLS Grid
- 2009-06-10 Listing Removed — MRED as Distributed by MLS Grid
- 2009-04-22 Price Changed — MRED as Distributed by MLS Grid
- 2009-04-17 Listed — MRED as Distributed by MLS Grid
- 2007-12-27 Listing Removed — MRED as Distributed by MLS Grid
- 2007-08-06 Listed — MRED as Distributed by MLS Grid
- 2004-04-14 Sold (Public Records) $90,000 Public Records
Property tax history
-0.4%/yrLatest (2024): $2,965 · +14.9% YoY. Source: county tax records.
Cash-flow waterfall
monthlySold comps — $/sqft
last 12 mo · ≤1 miLoading sold comps…