 🏷️ Likely Rental
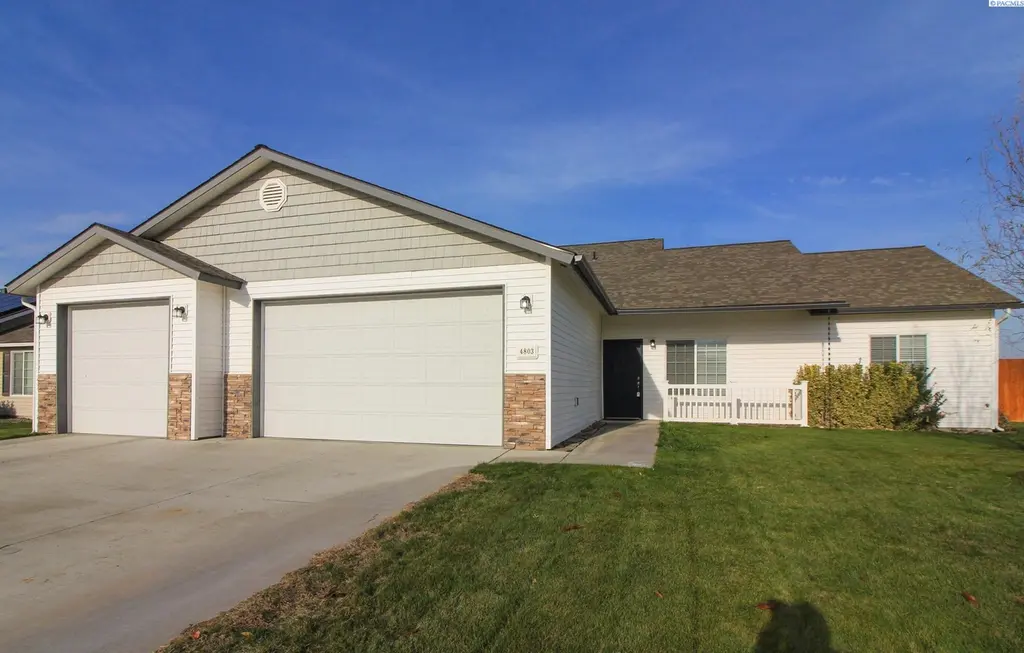
4803 Catalonia Dr · Pasco, WA
Flood risk 1/10 · Minimal
- FEMA flood zone
- X
- Chance of flooding over 30 yrs
- 0.0%
- Est. flood insurance / yr
- $507 – $1,088
Fire risk 3/10 · Minor
- Est. fire insurance / yr
- $604 – $1,122
Heat risk 5/10 · Moderate
- Hot days now (above 99°F)
- 7 days/yr
- Hot days in 30 yrs
- 14 days/yr
Wind risk 1/10 · Minimal
- Chance of severe wind over 30 yrs
- —
Air-quality risk 7/10 · Major
- Unhealthy air days now
- 9 days/yr
- Unhealthy air days in 30 yrs
- 11 days/yr
Risk factors via First Street. Map © Google.
Why this score? — see what drove the D+ grade
The composite is a weighted blend of 9 inputs, each scored 0–100. Each bar is that input's sub-score; the figure is the points it added to the 100-point composite (weight × sub-score).
- Cash flow +15.0/30.0
- ARV discount +7.5/15.0
- 1% rule +5.0/10.0
- DSCR +5.0/10.0
- Livability +4.0/5.0
- Schools +3.4/10.0
- Rent growth +3.0/5.0
- Condition / age +2.5/5.0
- Appreciation +0.0/10.0
$2,350
🖨 Deal sheet 📄 Offer letter ✓ Due diligence
Listing remarks MLS
WOW!!! STOP THE CAR!! This stunning rambler is a must see! Not only is the curb appeal on this house to die for, you'll love the beautifully done interior, the backyard and of course, the 4 car garage! This home boasts 3 bedrooms, 2 bathrooms with a desirable split bedroom floor plan. This house has been beautifully updated throughout including doors, trim and lighting. The master bedroom is a true retreat with double doors to the walk in closet and a slider that leads out to the back patio. The kitchen boasts a kitchen island, updated cabinets, backsplash and SS appliances. If the interior doesn't impress enough, the backyard is just as gorgeous with a perfectly manicured fully fenced and private yard, covered patio and RV parking. For the "toy enthusiast, " the garage is almost 1100 SF and can accommodate your vehicles, all of your toys and then some! This property will not last long in any market, let alone the Tri Cities market. You better call your favorite Realtor and make an appointment NOW before it's gone!
Key facts
- Eat-at island
- Open concept
- Covered back patio
Tags
Property features AI
Exterior
- Parking: 3 total parking spaces; All 3 parking spaces are covered; 3-car garage
- Home design: Single-family residence, site-built on owned lot; One level / single-story; New construction
- Construction: Built as new construction
- Exterior features: Lot approximately 0.24 acres (10,454 sq ft); Zoned for single-family residence
Interior
- Bathrooms: 2 full bathrooms
- Interior features: No basement
Neighborhood map
What this means for you Summary
Snapshot
- This is a 3-bed/2.0-bath single-family listed at $2k.
Deal economics
- At list price, monthly cash flow is $2k ($19k/yr) — positive.
- The deal already cash-flows at list — no discount required.
- Meets the 1% rule at list price ($2k rent vs $2k).
- Recommended offer: $2k (1.5% below list) — sets the bar for market timing.
- Cap rate 833.4% vs local median 3.0% in Pasco — top-decile yield for the area; either an underpriced asset or a hidden risk that comps aren't pricing in. Stress-test before assuming the spread holds.
Location & tenants
- Location reads 79/100 on livability (#104 in WA, #1,999 nationally) — a middle-class / working-renter tenant base. Strengths: commute A+, housing A+, health & safety A+; Watch: crime D+, schools D-.
- Pasco School District (suburban): math 31% / reading 40% proficiency, ranked #242 of 291 in WA (top 83%) — families likely to look elsewhere, expect single-tenant / working-renter base with shorter leases; 61% free/reduced lunch — lower-income household profile, screen leases tightly.
- Market conditions: Rents rising (+2.0%/yr); 705 active listings in the ZIP; 9 comparable units currently listed for rent nearby; rentals lingering (median 44d on market — plan ~5-8 weeks vacancy on turnover, expect pricing pressure); 67% of comp listings sitting > 30 days — soft ceiling on asking rent; solid renter incomes; 981 units permitted in Franklin County in 2024 (517 in 5+ unit buildings).
Forward outlook
- Local home prices are declining (-3.0%/yr); year-one equity from $16 of loan paydown is wiped out by about $70 of value loss. Plan a longer hold.
- Franklin County population projected at +50% by 2050 — long-run rental-demand tailwind backs the buy-and-hold thesis.
- At projected returns (-3.0% appreciation + 2.0% rent growth), your $658 cash investment doubles in ~1 year — after that, you're playing with house money.
Negotiation context
- It's been on market 17 days — a 2% lower offer ($2k) is reasonable based on typical stale-listing flexibility.
- 3 sale attempts since 16y ago with the ask held roughly flat each time — persistent listings suggest the price (not the market) is what's stuck; bring a comps-based counter.
Risks & watch-outs
- Climate carrying-cost: extreme-heat days projected 7→14/yr by 2055 (HVAC capex compounding) — expect insurance premiums to compound above CPI over the hold.
Questions for the listing agent
- Is there a deadline driving the sale (1031 exchange, divorce, estate, relocation)? That informs how much negotiation room exists.
- Schools are D-rated, which usually means shorter tenancies and higher turnover. Who's the typical renter profile here, and what's been the actual vacancy rate?
- Crime grade is D in this area — have there been break-ins, vandalism, or insurance claims at this property in the last 3 years? What carrier currently insures it and at what premium?
- The area grade is low — what's the realistic commute time and amenity access for the typical tenant pool here? Any planned neighborhood developments (good or bad) we should know about?
- What's the average days-on-market for RENTAL listings here right now (not sales)? A rising rental-DOM trend means longer vacancies and softer asking-rent achievability than the comps imply.
- What's the recent tenant-quality profile in this submarket — average credit score on applications, eviction rate, late-payment / NSF rate, and stable-employment percentage? A property-management company in the area should have these aggregated.
- How much new for-sale + rental construction is in the pipeline within 1–3 miles? Heavy new supply typically softens prices + rents 12–24 months out; constrained supply supports both.
Investment metrics
- 1% rule
- 88.12% ✓
- Cap rate
- 833.39%
- Cash-on-cash
- 2953.90%
- DSCR
- 132.43
- GRM
- 0.1
CMA / ARV
- ARV (on-the-fly)
- $395,136
- Comps found
- 12
Show comp detail 12 sales within ~0.75 mi
| Address | Dist | Beds/Ba | Sqft | Sold | Price | $/sf | Match |
|---|---|---|---|---|---|---|---|
| 5505 Marbella Ln | 0.19mi | 3/2.0 | 1,344 (0%) | 2mo | $395,000 | $294 | 89 |
| 6615 Road 52 | 0.27mi | 3/2.0 | 1,408 (+5%) | 1mo | $434,264 | $308 | 79 |
| 5014 Seville Dr | 0.18mi | 3/2.0 | 1,440 (+7%) | 4mo | $398,000 | $276 | 76 |
| 4908 Antioch Dr | 0.44mi | 3/2.0 | 1,416 (+5%) | 1mo | $410,000 | $290 | 70 |
| 4519 Catalonia Dr | 0.14mi | 3/2.5 | 1,161 (-14%) | 4mo | $1,095 | $1 | 66 |
| 4407 Sinai Dr | 0.49mi | 3/2.0 | 1,420 (+6%) | 5mo | $396,000 | $279 | 63 |
| 6214 Berea Ln | 0.51mi | 3/2.0 | 1,235 (-8%) | 3mo | $395,000 | $320 | 60 |
| 4516 Saguaro Dr | 0.58mi | 3/2.0 | 1,441 (+7%) | 2mo | $405,000 | $281 | 59 |
| 6306 Berea Ln | 0.55mi | 3/2.0 | 1,235 (-8%) | 3mo | $395,000 | $320 | 59 |
| 4607 Santa Fe Ln | 0.72mi | 3/2.0 | 1,459 (+9%) | 1mo | $400,000 | $274 | 52 |
| 6302 Berea Ln | 0.54mi | 3/2.0 | 1,152 (-14%) | 4mo | $389,000 | $338 | 48 |
| 4906 Kalahari Dr | 0.59mi | 3/2.0 | 1,144 (-15%) | 5mo | $356,500 | $312 | 44 |
Match score weights: distance 35% · size 25% · config 20% · recency 20%. Top-matched comps best support the ARV.
Projected returns pro-forma
-3.0% appreciation · 1.99% rent growth · sell at horizon
- IRR
- —
- Equity multiple
- 154.08×
- Total profit
- $100,728
- Equity at exit
- $350
- IRR
- —
- Equity multiple
- 323.64×
- Total profit
- $212,298
- Equity at exit
- $203
Cash invested: $658 (down + closing). Projections, not guarantees.
Landlord ↔ Tenant lean methodology
- Overall (STATE)
- 28 Tenant-Leaning
- State Washington
- 28 Tenant-Leaning · D+8
- County
- — inherits STATE
- City
- — inherits STATE
ZIP-level market 99301
- Rents YoY
- 2.0%
- Active inventory
- 705
- Price-to-rent
- 0.1×
Monthly cashflow live
- Estimated rent
- $2,071 high interval (Pro) →
- Mortgage (P&I)
- −$12
- Tax est. 1.5%
- −$3 /mo · $35/yr
- Insurance
- −$1
- HOA
- −$0
- Vacancy / Maint / Mgmt
- −$435
- Net cashflow
- $1,620
Break-even live
UW: 25.0% down · 7.5% · 30yr · 1.5% tax · 5.0% vac · 8.0% maint · 8.0% mgmt
Financing live
Cash to close
- Down payment
- $588
- Closing costs
- $70
- Reserves months
- —
- Total cash needed
- —
Loan-product check · same deal, 3 products live
Conventional
25% down · 7.5% · 30yr
- Down + closing
- —
- Monthly P&I
- —
- Monthly cashflow
- —
- DSCR
- —
- Eligible?
- —
Personal DTI + credit; lowest rate.
DSCR
20% down · 8.5% · 30yr
- Down + closing
- —
- Monthly P&I
- —
- Monthly cashflow
- —
- DSCR
- —
- Eligible?
- —
No personal income docs; deal must DSCR.
Hard money
10% down · 12.0% · 12mo
- Down + closing
- —
- Monthly P&I
- —
- Monthly cashflow
- —
- DSCR
- —
- Eligible?
- —
Short-term bridge; refi at stabilization.
Rent comps 9 comps
| Address | Beds | Baths | Sqft | Rent | $/sqft | DOM | Units | Dist |
|---|---|---|---|---|---|---|---|---|
| 4914 Sinai Dr Pasco, WA | 3.0 | 2.0 | 1144 | $2,095 | $1.83 | 13d | 1 | 0.49mi |
| 4511 Saguaro Dr Pasco, WA | 3.0 | 2.0 | 1152 | $2,025 | $1.76 | 43d | 1 | 0.61mi |
| 5313 Remington Dr Pasco, WA | 3.0 | 3.0 | 1232 | $2,200 | $1.79 | 43d | 1 | 1.35mi |
| 6005 Chapel Hill Blvd Unit I 102 Pasco, WA | 3.0 | 2.0 | 1262 | $1,650 | $1.31 | 43d | 1 | 1.36mi |
| 5430 Remington Dr Pasco, WA | 4.0 | 2.5 | 1798 | $2,300 | $1.28 | 21d | 1 | 1.37mi |
| 6305 Chapel Hill Blvd Unit D102 Pasco, WA | 2.0 | 2.0 | 938 | $1,686 | $1.80 | 21d | 1 | 1.37mi |
| 6405N Chapel Hill Blvd Unit N102 Pasco, WA | 3.0 | 2.0 | 1262 | $1,750 | $1.39 | 43d | 1 | 1.43mi |
| 6405H Chapel Hill Blvd Unit H201 Pasco, WA | 2.0 | 2.0 | 960 | $1,751 | $1.82 | 43d | 1 | 1.49mi |
| 6405H Chapel Hill Blvd Unit H103 Pasco, WA | 2.0 | 2.0 | 1007 | $1,794 | $1.78 | 43d | 1 | 1.49mi |
Listing history 12 events
-
2026-06-18days on market $2,350 Active 17 DOM
-
2026-06-17days on market $2,350 Active 16 DOM
-
2026-06-16days on market $2,350 Active 15 DOM
-
2026-06-15days on market $2,350 Active 14 DOM
-
2026-06-14days on market $2,350 Active 12 DOM
-
2026-06-13days on market $2,350 Active 11 DOM
-
2026-06-10days on market $2,350 Active 9 DOM
-
2026-06-09days on market $2,350 Active 8 DOM
-
2026-06-08days on market $2,350 Active 7 DOM
-
2026-06-07days on market $2,350 Active 6 DOM
-
2026-06-02remarks 699-char remark
-
2026-06-02$2,350 Active 1 DOM
ⓘ Source: listings_history table (triggers on properties + properties_extension) + one-shot
backfill from property_details.listing_events for pre-trigger history.
Climate risk First Street
- Flood 1/10 Low FEMA zone X · 0% chance over 30 yrs
- Wildfire 3/10 Moderate
- Heat 5/10 Major 7 d/yr ≥99°F today · 14 d/yr by 30 yrs out
- Wind 1/10 Low
- Air quality 7/10 Severe 9 unhealthy d/yr today · 11 by 30 yrs out
Nearby sold comps map
Loading sold comps map…
Walkable amenities ~0.75 mi
Loading nearby amenities…
Taxation est. · year 1
- Rental income
- $24,850
- − Mortgage interest
- −$132
- − Property taxes
- −$35
- − Insurance
- −$12
- − Repairs & maintenance
- −$1,988
- − Management
- −$1,988
- − Depreciation
- −$68
- Taxable income
- $20,627
- Est. tax owed @ 24.0%
- −$4,950
- After-tax cash flow
- $14,486/yr
For passive investors: Depreciation is non-cash, so a rental often shows a tax loss while cash-flowing — sheltering income. Rental losses are passive: they offset passive income freely, and up to $25,000/yr can offset ordinary (W-2) income if you actively participate and your MAGI is under $100k (phasing out to $0 by $150k); unused losses carry forward. On sale, claimed depreciation is recaptured at up to 25%, and gains may owe capital-gains tax (a 1031 exchange can defer both). Figures are a year-1 estimate at your 24.0% rate — not tax advice; consult a CPA.
Schools (NCES district)
- District
- Pasco School District
- NCES district ID
- 5306570
- Math proficiency
- 31% ▬ 0.00%
- Reading proficiency
- 40% ▬ 0.00%
- Median HH income
- $54,454
- Composite
- 33.78/100
- National rank
- #10401
- State rank
- #242 of 291 in WA
Livability — Pasco
- Score
- 79/100
- State rank
- #104
- US rank
- #1999
Category grades
Schools grade is shown separately in the Schools card above.
Census & demographics
- Census place
- Pasco, WA
- County
- Franklin County · 87,044 people
- City population
- 87,044
- Metro
- Kennewick-Richland, WA
- Population (ZIP)
- 87,044
- Household income
- $87,951
- Rent vs Own
- Severe rent burden
- 1556.0
Population outlook (Franklin County) Hauer SSP2
- Today (2025)
- 108,530 people
- By 2030
- 118,705 · +9.4%
- By 2040
- 140,053 · +29.0%
- By 2050
- 162,360 · +49.6%
- By 2075
- 217,667 · +100.6%
- By 2100
- 264,533 · +143.7%
Race, ethnicity, and origin ACS 2023
- Neighborhood character
- Diverse neighborhood (Simpson 0.56)
- Race & ethnicity
- Hispanic / Latino 55% White 37% Two or more races 22% Black 2% Asian 2% Native American 2%
- Hispanic origin (detail)
- Mexican 51%
- Common ancestry
- Lithuanian 2% Italian 2% Portuguese 2%
- Foreign-born
- 21% · Canada, Vietnam
- Languages at home
- 49% English-only · Spanish 47% Russian/Polish/Slavic 2% Other Asian/Pacific 0%
Political lean MEDSL · Franklin
- 2024 margin
- Strong R (+22.7) · D 37.4% · R 60.1% · Other 2.4%
- 2008→2024 swing
- +1.0pp toward D · 2008: -23.7pp · 2024: -22.7pp
- All cycles
- 2024: R+22.7 2020: R+14.5 2016: R+17.1 2012: R+25.2 2008: R+23.7
Not yet ingested
- Civics
- —
Market trends
- HPI YoY
- ▼ -331.74%
- Current HPI
- 284.481
- Rent YoY
- ▲ 1.99%
- Metro
- Kennewick-Richland, WA
- State GDP YoY
- ▲ 4.65%
- F500 in state
- 22
Industry mix (Fortune 500 HQ in WA)
| Industry | F500 HQs | Revenue |
|---|---|---|
| Retail | 2 | $269B |
|
||
| Technology / Retail | 1 | $638B |
|
||
| Technology | 1 | $245B |
|
||
| Telecommunications | 1 | $38B |
|
||
| Food / Beverage | 1 | $36B |
|
||
| Automotive / Trucks | 1 | $34B |
|
||
Price history
-98.4% since first listed5 events — show timeline
- 2026-06-01 Listed $2,350 PACMLS
- 2020-10-26 Sold (MLS) $302,000 PACMLS
- 2020-09-03 Listed $299,900 PACMLS
- 2010-07-30 Sold (MLS) $145,950 PACMLS
- 2010-04-20 Listed $145,950 PACMLS
Property tax history
+4.4%/yrLatest (2026): $3,219 · +3.8% YoY. Source: county tax records.
Cash-flow waterfall
monthlySold comps — $/sqft
last 12 mo · ≤1 miLoading sold comps…