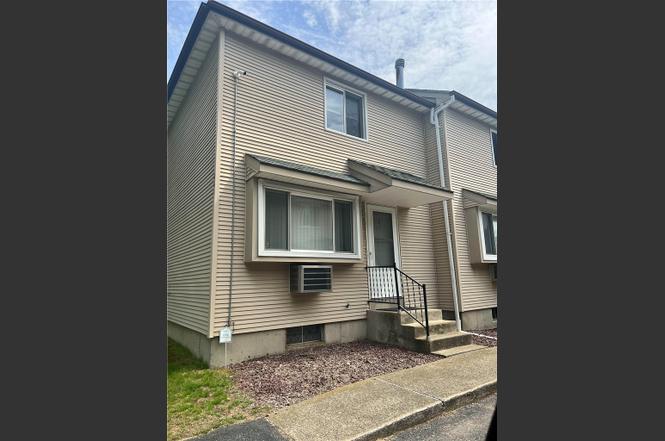
670 Union Ave #1 · Providence, RI
Flood risk 1/10 · Minimal
- FEMA flood zone
- X (unshaded)
- Chance of flooding over 30 yrs
- 0.0%
- Est. flood insurance / yr
- $473 – $860
Fire risk 1/10 · Minimal
- Est. fire insurance / yr
- $835 – $1,551
Heat risk 6/10 · Moderate
- Hot days now (above 96°F)
- 7 days/yr
- Hot days in 30 yrs
- 16 days/yr
Wind risk 6/10 · Moderate
- Chance of severe wind over 30 yrs
- 71.0%
Air-quality risk 2/10 · Minimal
- Unhealthy air days now
- 1 days/yr
- Unhealthy air days in 30 yrs
- 2 days/yr
Risk factors via First Street. Map © Google.
Why this score? — see what drove the D grade
The composite is a weighted blend of 9 inputs, each scored 0–100. Each bar is that input's sub-score; the figure is the points it added to the 100-point composite (weight × sub-score).
- Cash flow +13.7/30.0
- ARV discount +7.5/15.0
- 1% rule +5.1/10.0
- Livability +4.2/5.0
- DSCR +4.1/10.0
- Rent growth +3.4/5.0
- Condition / age +2.5/5.0
- Schools +1.0/10.0
- Appreciation +0.0/10.0
$239,999
🖨 Deal sheet (PDF) 📄 Offer letter ✓ Due diligence
Listing remarks
Desirable End-Unit Townhome! This bright and inviting 2-bedroom, 1.5-bath townhouse offers the perfect combination of comfort, convenience, and privacy. As an end unit, the home enjoys additional windows that fill the living spaces with natural light and create an open, airy feel throughout. The functional floor plan features spacious living and dining areas, a well-appointed kitchen, and a convenient half bath on the main level. Upstairs, you'll find two generously sized bedrooms and a full bath. The lower level provides a dedicated laundry area and an abundance of basement storage space, offering plenty of room for seasonal items, hobbies, or organizational needs. With its desirable end-u
Key facts
- End unit
- Natural light
- $300 HOA
Tags
Property features AI
Finance
- HOA & community: Association fee of $300 per month; Pets allowed: cats and small dogs under 25 lbs.
Exterior
- Parking: Assigned parking (2 spaces), no garage
- Utilities: 100 amp electric service; Water service with tap fee
- Home design: Union Place Condominiums; 2-story building
- Construction: Aluminum siding construction; Concrete perimeter foundation
- Exterior features: Aluminum siding; Concrete perimeter foundation; Entry level on first floor; 490 sq ft finished lower level; 1,008 sq ft finished upper level
Interior
- Kitchen: No kitchen appliance list provided
- Bedrooms: 4 total rooms (includes bedrooms and living spaces)
- Flooring: Carpet; Laminate; Vinyl
- Bathrooms: 1 full bathroom; 1 half bathroom
- Heating & cooling: Gas baseboard heating; Wall-mounted cooling unit(s)
- Interior features: Full unfinished basement with interior entry
- Laundry & utility: Electric water heater
Neighborhood map
What this means for you Summary
Snapshot
- This is a 2-bed/1.5-bath condo listed at $240k.
Deal economics
- At list price, monthly cash flow is $19 ($227/yr) — positive.
- The deal already cash-flows at list — no discount required.
- Meets the 1% rule at list price ($2k rent vs $240k).
- Cap rate 6.4% vs local median 4.0% in Providence — top-decile yield for the area; either an underpriced asset or a hidden risk that comps aren't pricing in. Stress-test before assuming the spread holds.
Location & tenants
- Location reads 84/100 on livability (#2 in RI, #794 nationally) — a professional / high-income tenant draw. Strengths: amenities A+, commute A+, housing A+; Watch: employment C-.
- Providence (urban): math 8% / reading 16% proficiency, ranked #34 of 39 in RI (top 87%) — low school quality limits family demand, transient renter base, plan for 1-2y turnover; 79% free/reduced lunch — lower-income household profile, screen leases tightly.
- Zoned schools: George J. West El. School (math 7% / reading 13%, grade F, #148 of 167 statewide, top 90%, 601 students, 84% FRL); Nathanael Greene Middle (math 10% / reading 23%, grade F, #37 of 57 statewide, top 64%, 808 students, 85% FRL); Central High School (math 2% / reading 12%, grade F, #53 of 58 statewide, top 96%, 1,302 students, 87% FRL).
- Market conditions: Rents rising (+3.7%/yr); 133 active listings in the ZIP; 25 comparable units currently listed for rent nearby; rentals at typical pace (median 19d on market — plan ~3-4 weeks tenant-placement turnaround); 776 units permitted in Providence County in 2024 (229 in 5+ unit buildings).
- At $2,432/mo this rent would consume 45% of the median local household income ($65k/yr) (locally 2000% of renters already pay >50% of income on rent) — very limited rent-growth headroom before tenants either downsize or default.
Forward outlook
- Local home prices are declining (-3.0%/yr); year-one equity from $2k of loan paydown is wiped out by about $7k of value loss. Plan a longer hold.
- Providence County population projected at +5% by 2050 — modest demand growth; plan on rents tracking national, not racing it.
Negotiation context
- Only 11 days on market — expect competitive offers; lowballing is unlikely to land.
- Current owner paid $165k; 45% above their basis — modest negotiation headroom, anchor on the comps not their cost.
Risks & watch-outs
- Climate carrying-cost: major wind risk, 71% chance of damaging wind over 30y; extreme-heat days projected 7→16/yr by 2055 (HVAC capex compounding) — expect insurance premiums to compound above CPI over the hold.
Questions for the listing agent
- What does the HOA fee cover, when was the last increase, and are there any pending special assessments or reserve-fund shortfalls?
- Any open or pending special assessments — roof, HVAC, plumbing, elevator, façade? What's the per-unit balance and payoff schedule, and is the seller paying it off at close or rolling it to the buyer?
- Is there a deadline driving the sale (1031 exchange, divorce, estate, relocation)? That informs how much negotiation room exists.
- Schools are F-rated, which usually means shorter tenancies and higher turnover. Who's the typical renter profile here, and what's been the actual vacancy rate?
- The area grade is low — what's the realistic commute time and amenity access for the typical tenant pool here? Any planned neighborhood developments (good or bad) we should know about?
- What's the average days-on-market for RENTAL listings here right now (not sales)? A rising rental-DOM trend means longer vacancies and softer asking-rent achievability than the comps imply.
- What's the recent tenant-quality profile in this submarket — average credit score on applications, eviction rate, late-payment / NSF rate, and stable-employment percentage? A property-management company in the area should have these aggregated.
- How much new apartment / multifamily construction is in the pipeline within 1–3 miles? Heavy new supply (>2% of stock underway) typically softens rents 12–24 months out; light construction supports rent growth.
Investment metrics
- 1% rule
- 1.01% ✓
- Cap rate
- 6.39%
- Cash-on-cash
- 0.34%
- DSCR
- 1.01
- GRM
- 8.2
CMA / ARV
No comps found within radius.
Projected returns pro-forma
-3.0% appreciation · 3.68% rent growth · sell at horizon
- IRR
- -14.8%
- Equity multiple
- 0.47×
- Total profit
- $-35,826
- Equity at exit
- $35,785
- IRR
- -4.8%
- Equity multiple
- 0.67×
- Total profit
- $-21,920
- Equity at exit
- $20,751
Cash invested: $67,200 (down + closing). Projections, not guarantees.
Landlord ↔ Tenant lean methodology
- Overall (STATE)
- 31 Tenant-Leaning
- State Rhode Island
- 31 Tenant-Leaning · D+8
- County
- — inherits STATE
- City
- — inherits STATE
ZIP-level market 02909
- Home prices YoY
- -13.3%
- Rents YoY
- 3.7%
- Active inventory
- 133
- Price-to-rent
- 8.2×
Monthly cashflow live
- Estimated rent
- $2,432 high interval (Pro) →
- Mortgage (P&I)
- −$1,259
- Tax from tax record
- −$244 /mo · $2,927/yr
- Insurance
- −$100
- HOA
- −$300
- Vacancy / Maint / Mgmt
- −$511
- Net cashflow
- $19
Break-even live
Sensitivity live
| Price | -10% $155 | -5% $87 | +0% $19 | +5% $-49 | +10% $-117 |
|---|---|---|---|---|---|
| Rent | -10% $-173 | -5% $-77 | +0% $19 | +5% $115 | +10% $211 |
| Rate | -1.0pp $140 | -0.5pp $80 | base $19 | +0.5pp $-43 | +1.0pp $-107 |
UW: 25.0% down · 7.5% · 30yr · 1.5% tax · 5.0% vac · 8.0% maint · 8.0% mgmt
Financing live
Cash to close
- Down payment
- $60,000
- Closing costs
- $7,200
- Reserves months
- —
- Total cash needed
- —
Loan-product check · same deal, 3 products live
Conventional
25% down · 7.5% · 30yr
- Down + closing
- —
- Monthly P&I
- —
- Monthly cashflow
- —
- DSCR
- —
- Eligible?
- —
Personal DTI + credit; lowest rate.
DSCR
20% down · 8.5% · 30yr
- Down + closing
- —
- Monthly P&I
- —
- Monthly cashflow
- —
- DSCR
- —
- Eligible?
- —
No personal income docs; deal must DSCR.
Hard money
10% down · 12.0% · 12mo
- Down + closing
- —
- Monthly P&I
- —
- Monthly cashflow
- —
- DSCR
- —
- Eligible?
- —
Short-term bridge; refi at stabilization.
Rent comps 25 comps
| Address | Beds | Baths | Sqft | Rent | $/sqft | DOM | Units | Dist |
|---|---|---|---|---|---|---|---|---|
| 50 Murray St Unit 9 Providence, RI | 2.0 | 1.5 | 886 | $2,500 | $2.82 | 3d | 1 | 0.14mi |
| 50 Murray St Unit 19 Providence, RI | 2.0 | 1.5 | 1130 | $2,750 | $2.43 | 18d | 1 | 0.14mi |
| 50 Murray St Unit 19 Providence, RI | 2.0 | 1.5 | 1130 | $2,750 | $2.43 | 3d | 1 | 0.14mi |
| 50 Murray St Unit 20 Providence, RI | 2.0 | 1.5 | 1130 | $2,750 | $2.43 | 13d | 1 | 0.14mi |
| 50 Murray St Unit 10 Providence, RI | 2.0 | 1.5 | 860 | $2,500 | $2.91 | 21d | 1 | 0.14mi |
| 50 Murray St Unit 2 Providence, RI | 2.0 | 1.5 | 860 | $2,500 | $2.91 | 45d | 1 | 0.14mi |
| 50 Murray St Unit 2 Providence, RI | 2.0 | 1.5 | 840 | $2,350 | $2.80 | 3d | 1 | 0.14mi |
| 50 Murray St Unit 21 Providence, RI | 2.0 | 1.5 | 1130 | $2,750 | $2.43 | 22d | 1 | 0.14mi |
| 348 Union Ave Unit 1 Providence, RI | 2.0 | 1.0 | 900 | $1,900 | $2.11 | 16d | 1 | 0.63mi |
| 29 Dunford St Unit 2 Providence, RI | 3.0 | 2.0 | 1116 | $2,400 | $2.15 | 25d | 1 | 0.67mi |
| 304 Webster Ave Cranston, RI | 2.0 | 1.0 | 1144 | $1,850 | $1.62 | 12d | 1 | 0.72mi |
| 78 Old Oak Ave Unit 2 Cranston, RI | 2.0 | 1.0 | 880 | $1,700 | $1.93 | 45d | 1 | 0.79mi |
| 151 Chestnut Hill Ave Cranston, RI | 2.0 | 1.0 | 1114 | $2,795 | $2.51 | 46d | 1 | 0.85mi |
| 37 Sumner Ave Unit 2 Cranston, RI | 2.0 | 1.0 | 800 | $1,600 | $2.00 | 19d | 1 | 1.00mi |
| 20 Pavilion Ct Unit 22 Cranston, RI | 2.0 | 1.5 | 1400 | $2,500 | $1.79 | 45d | 1 | 1.02mi |
| 9 Custer Ave Johnston, RI | 2.0 | 1.0 | 832 | $2,200 | $2.64 | 45d | 1 | 1.05mi |
| 718 Dyer Ave Cranston, RI | 3.0 | 1.5 | 1250 | $1,900 | $1.52 | 19d | 1 | 1.07mi |
| 718 Dyer Ave Cranston, RI | 3.0 | 1.5 | 1233 | $1,900 | $1.54 | 25d | 1 | 1.07mi |
| 1303 Cranston St Unit 1 Cranston, RI | 3.0 | 1.0 | 1356 | $2,750 | $2.03 | 45d | 1 | 1.24mi |
| 1336 Cranston St Fl Rear Cranston, RI | 2.0 | 2.0 | 1000 | $2,095 | $2.10 | 12d | 1 | 1.24mi |
| 28 Cleveland Ave Unit 3 Cranston, RI | 2.0 | 1.0 | 1000 | $1,695 | $1.70 | 25d | 1 | 1.27mi |
| 166 Valley St Providence, RI | 2.0 | 1.0–2.0 | 733 | $2,670 | $3.64 | 4d | 7 | 1.33mi |
| 6 Royal Ave Unit 2F Cranston, RI | 1.0 | 1.0 | 900 | $1,900 | $2.11 | 45d | 1 | 1.34mi |
| 8 Anthony Ave Unit 1 Providence, RI | 3.0 | 2.0 | 1400 | $2,800 | $2.00 | 16d | 1 | 1.36mi |
| 8 Batcheller Ave Cranston, RI | 2.0 | 1.5 | 1500 | $3,000 | $2.00 | 6d | 1 | 1.39mi |
HOA detail condo
- Monthly dues
- $300 · $3,600/yr
- Assessments
- None detected in remarks — confirm with the listing agent.
Listing history 7 events
-
2026-06-21days on market $239,999 Active 11 DOM
-
2026-06-18days on market $239,999 Active 8 DOM
-
2026-06-17days on market $239,999 Active 7 DOM
-
2026-06-16days on market $239,999 Active 6 DOM
-
2026-06-15days on market $239,999 Active 5 DOM
-
2026-06-13remarks 699-char remark
-
2026-06-13$239,999 Active 3 DOM
ⓘ Source: listings_history table (triggers on properties + properties_extension) + one-shot
backfill from property_details.listing_events for pre-trigger history.
Tax reassessment forecast RI · Partial reset (capped growth)
- Current annual tax
- $2,927 · $244/mo
- Projected year-2 tax
- $3,419 · $285/mo
- Expected delta
- +$492/yr (+$41/mo · 16.8%)
ⓘ Screening estimate from a state-policy table — verify with the county assessor before closing.
Climate risk First Street
- Flood 1/10 Low FEMA zone X (unshaded) · 0% chance over 30 yrs
- Wildfire 1/10 Low
- Heat 6/10 Major 7 d/yr ≥96°F today · 16 d/yr by 30 yrs out
- Wind 6/10 Major 71% chance of damaging wind over 30 yrs
- Air quality 2/10 Low 1 unhealthy d/yr today · 2 by 30 yrs out
Nearby sold comps map
Loading sold comps map…
Walkable amenities ~0.75 mi
Loading nearby amenities…
Taxation est. · year 1
- Rental income
- $29,185
- − Mortgage interest
- −$13,444
- − Property taxes
- −$2,927
- − Insurance
- −$1,200
- − Repairs & maintenance
- −$2,335
- − Management
- −$2,335
- − HOA
- −$3,600
- − Depreciation
- −$6,982
- Taxable loss
- −$3,637
- Est. tax savings @ 24.0%
- +$873
- After-tax cash flow
- $1,099/yr
For passive investors: Depreciation is non-cash, so a rental often shows a tax loss while cash-flowing — sheltering income. Rental losses are passive: they offset passive income freely, and up to $25,000/yr can offset ordinary (W-2) income if you actively participate and your MAGI is under $100k (phasing out to $0 by $150k); unused losses carry forward. On sale, claimed depreciation is recaptured at up to 25%, and gains may owe capital-gains tax (a 1031 exchange can defer both). Figures are a year-1 estimate at your 24.0% rate — not tax advice; consult a CPA.
Schools (NCES district)
- District
- Providence
- NCES district ID
- 4400900
- Math proficiency
- 8% ▼ -4.00%
- Reading proficiency
- 16% ▼ -2.00%
- Median HH income
- $38,197
- Composite
- 10.12/100
- National rank
- #9803
- State rank
- #34 of 39 in RI
Livability — Providence
- Score
- 84/100
- State rank
- #2
- US rank
- #794
Category grades
Schools grade is shown separately in the Schools card above.
Census & demographics
- Census place
- Providence, RI
- County
- Providence County · 548,917 people
- City population
- 212,734
- Metro
- Providence-Warwick, RI-MA
- Population (ZIP)
- 46,014
- Household income
- $64,649
- Rent vs Own
- Severe rent burden
- 2000.0
Population outlook (Providence County) Hauer SSP2
- Today (2025)
- 653,469 people
- By 2030
- 660,819 · +1.1%
- By 2040
- 672,747 · +3.0%
- By 2050
- 683,741 · +4.6%
- By 2075
- 720,435 · +10.2%
- By 2100
- 741,582 · +13.5%
Race, ethnicity, and origin ACS 2023
- Neighborhood character
- Diverse neighborhood (Simpson 0.57)
- Race & ethnicity
- Hispanic / Latino 60% Two or more races 23% White 22% Black 12% Asian 2% Native American 2%
- Hispanic origin (detail)
- Puerto Rican 12% Dominican 23%
- Common ancestry
- Lithuanian 2% Russian 1% Romanian 1%
- Foreign-born
- 35% · Canada, Jamaica
- Languages at home
- 43% English-only · Spanish 50% Other Indo-European 2% Other Asian/Pacific 1%
Political lean MEDSL · Providence
- 2024 margin
- D (+14.4) · D 56.1% · R 41.7% · Other 2.2%
- 2008→2024 swing
- -20.0pp toward R · 2008: 34.4pp · 2024: 14.4pp
- All cycles
- 2024: D+14.4 2020: D+22.9 2016: D+21.2 2012: D+34.9 2008: D+34.4
Not yet ingested
- Civics
- —
Market trends
- HPI YoY
- ▼ -72.78%
- Current HPI
- 474.9956
- Rent YoY
- ▲ 3.68%
- Metro
- Providence-Warwick, RI-MA
- State GDP YoY
- ▲ 2.25%
- F500 in state
- 10
Industry mix (Fortune 500 HQ in RI)
| Industry | F500 HQs | Revenue |
|---|---|---|
| Healthcare | 1 | $373B |
|
||
| Food Distribution | 1 | $31B |
|
||
| Aerospace / Defense | 1 | $14B |
|
||
| Financial Services | 1 | $8B |
|
||
| Consumer Goods | 1 | $4B |
|
||
Price history
+92.0% since first listed4 events — show timeline
- 2026-06-10 Listed $239,999 RIS
- 2022-06-13 Sold (Public Records) $165,000 Public Records
- 2008-04-14 Sold (Public Records) $115,000 Public Records
- 2004-07-27 Sold (Public Records) $125,000 Public Records
Property tax history
-0.9%/yrLatest (2025): $2,927 · +18.8% YoY. Source: county tax records.
Cash-flow waterfall
monthlySold comps — $/sqft
last 12 mo · ≤1 miLoading sold comps…