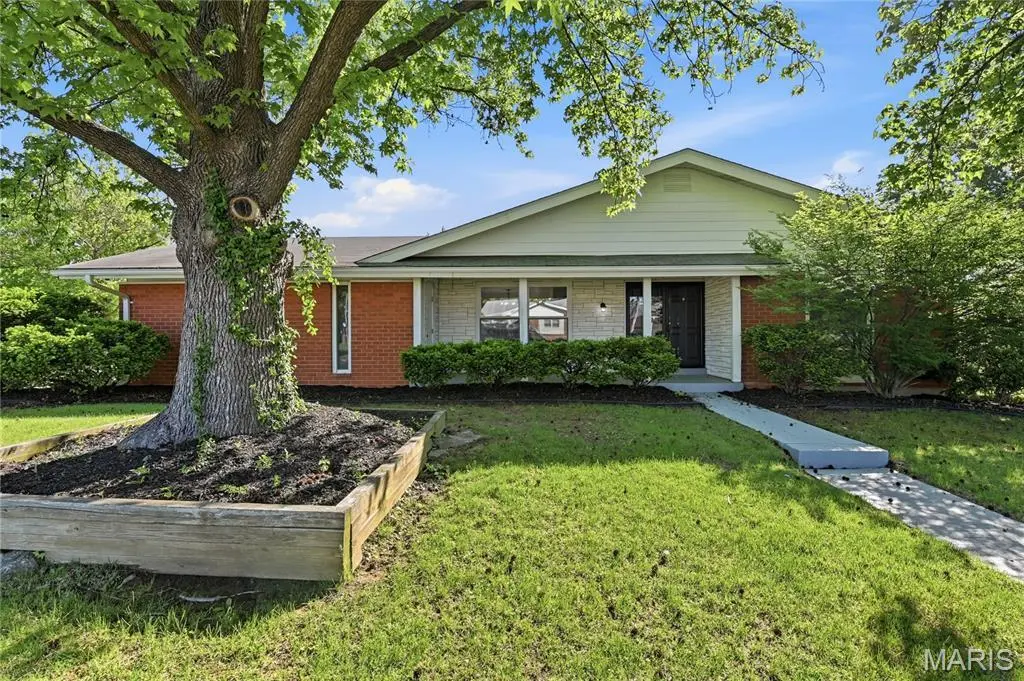
2723 Buckingham Dr · Old Jamestown, MO
Flood risk 1/10 · Minimal
- FEMA flood zone
- X (unshaded)
- Chance of flooding over 30 yrs
- 0.0%
- Est. flood insurance / yr
- $473 – $860
Fire risk 1/10 · Minimal
- Est. fire insurance / yr
- $1,054 – $1,958
Heat risk 5/10 · Moderate
- Hot days now (above 106°F)
- 7 days/yr
- Hot days in 30 yrs
- 21 days/yr
Wind risk 2/10 · Minimal
- Chance of severe wind over 30 yrs
- 1.0%
Air-quality risk 3/10 · Minor
- Unhealthy air days now
- 3 days/yr
- Unhealthy air days in 30 yrs
- 5 days/yr
Risk factors via First Street. Map © Google.
Why this score? — see what drove the D grade
The composite is a weighted blend of 9 inputs, each scored 0–100. Each bar is that input's sub-score; the figure is the points it added to the 100-point composite (weight × sub-score).
- Appreciation +10.0/10.0
- Cash flow +9.2/30.0
- ARV discount +6.1/15.0
- Rent growth +4.4/5.0
- Livability +3.3/5.0
- DSCR +2.6/10.0
- Condition / age +2.5/5.0
- 1% rule +2.3/10.0
- Schools +1.2/10.0
$250,000
🖨 Deal sheet 📄 Offer letter ✓ Due diligence
Listing remarks
Move-in ready, fully renovated all-brick ranch on a beautifully landscaped corner lot in Florissant's Wedgwood neighborhood. The brand-new kitchen features white shaker cabinets, quartz countertops, a stainless appliance suite, and an open peninsula flowing right into the family room and its cozy gas fireplace. Polished hardwoods and warm new LVP run throughout under fresh paint and all-new lighting. All three bathrooms have been refreshed — including a brand-new walk-in shower in the primary suite, plus an updated half-bath in the finished basement. Downstairs offers flexible second-living space with new carpet — bonus room, rec area, guest setup. New gas water heater, central
Key facts
- 0.36 acre lot
- 2 garage spots
- Built 1965
Property features AI
Finance
- Other: Living area approximately 2,480 total (1,380 above grade, 1,100 below grade)
- HOA & community: Wedgwood HOA with annual fee of $100 (covers common area maintenance); Community park and playground
Exterior
- Parking: Attached 2-car garage
- Utilities: Public water; Public sewer; 220 Volt electric (Ameren); Electricity, natural gas, sewer and water connected
- Home design: Single family residence; One level
- Construction: Brick veneer construction; Basement
- Exterior features: Covered patio; Rear porch; Screened porch; Corner lot, landscaped, level
Interior
- Kitchen: Dishwasher, Microwave, Range
- Bedrooms: Three bedrooms on the main level
- Bathrooms: Two full bathrooms; One half bathroom
- Heating & cooling: Forced air heating (natural gas); Central air conditioning
- Interior features: Dishwasher, Microwave, Range; Partially finished basement; Fireplace (1)
Neighborhood map
What this means for you Summary
Snapshot
- This is a 3-bed/2.0-bath single-family listed at $250k.
Deal economics
- At list price, monthly cash flow is $-189 ($-2k/yr) — negative.
- To cash-flow at today's rent, offer at most $217k (13.3% below list).
- To meet the 1% rule (rent ≥ 1% of price), the offer needs to be $183k (27.0% below list).
- Recommended offer: $183k (27.0% below list) — sets the bar for 1% rule.
Location & tenants
- Location reads 66/100 on livability (#247 in MO) — a middle-class / working-renter tenant base. Strengths: employment A+, housing A+, cost of living A; Watch: amenities F, commute F, health & safety F.
- Ferguson-Florissant R-II (suburban): math 7% / reading 20% proficiency, ranked #311 of 324 in MO (top 96%) — low school quality limits family demand, transient renter base, plan for 1-2y turnover; 70% free/reduced lunch — lower-income household profile, screen leases tightly.
- Zoned schools: Mccluer North High (math 5% / reading 28%, grade F, #487 of 521 statewide, top 93%, 1,136 students, 100% FRL) — zoned schools average 100% FRL vs 70% district-wide (30 pts higher); higher-poverty schools than district average — tighter screening recommended.
- Market conditions: Rents rising fast (+7.5%/yr); 218 active listings in the ZIP; 18 comparable units currently listed for rent nearby; rentals at typical pace (median 15d on market — plan ~3-4 weeks tenant-placement turnaround); 920 units permitted in St. Louis County in 2024 (250 in 5+ unit buildings).
- This rent runs 33% of the median local income ($67k/yr) — at the standard rent-burdened threshold; future hikes will face affordability resistance.
Forward outlook
- In year one you build about $27k of equity ($2k loan paydown + $25k appreciation (10.0% local appreciation)).
- By year 2, paydown + projected appreciation supports a ~$43k cash-out refi (75% LTV) — recoverable capital for the next deal without selling this one.
Negotiation context
- It's been on market 26 days — a 2% lower offer ($246k) is reasonable based on typical stale-listing flexibility.
- 2 sale attempts with the ask held roughly flat each time — persistent listings suggest the price (not the market) is what's stuck; bring a comps-based counter.
- Current owner paid $120k; list at $250k implies a 108% gain — meaningful room to come down on a strong offer.
Risks & watch-outs
- Climate carrying-cost: extreme-heat days projected 7→21/yr by 2055 (HVAC capex compounding) — expect insurance premiums to compound above CPI over the hold.
Questions for the listing agent
- What do current leases actually rent for vs. the listed asking? Can we see a recent rent roll and the last 12 months of T-12 income?
- Built in 1965 — when were the roof, HVAC, electrical panel, plumbing, and water heater last replaced?
- What does the HOA fee cover, when was the last increase, and are there any pending special assessments or reserve-fund shortfalls?
- Is there a deadline driving the sale (1031 exchange, divorce, estate, relocation)? That informs how much negotiation room exists.
- The area grade is low — what's the realistic commute time and amenity access for the typical tenant pool here? Any planned neighborhood developments (good or bad) we should know about?
- What's the average days-on-market for RENTAL listings here right now (not sales)? A rising rental-DOM trend means longer vacancies and softer asking-rent achievability than the comps imply.
- What's the recent tenant-quality profile in this submarket — average credit score on applications, eviction rate, late-payment / NSF rate, and stable-employment percentage? A property-management company in the area should have these aggregated.
- How much new for-sale + rental construction is in the pipeline within 1–3 miles? Heavy new supply typically softens prices + rents 12–24 months out; constrained supply supports both.
Investment metrics
- 1% rule
- 0.73% ✗
- Cap rate
- 5.39%
- Cash-on-cash
- -3.23%
- DSCR
- 0.86
- GRM
- 11.4
CMA / ARV
- ARV (median comp)
- $242,672
- List price
- $250,000
- Delta
- 3.02%
- Verdict
- FAIR
- Comps
- 20 within 1.0 mi
Show comp detail 12 sales within ~0.75 mi
| Address | Dist | Beds/Ba | Sqft | Sold | Price | $/sf | Match |
|---|---|---|---|---|---|---|---|
| 4 Cameo Ct | 0.32mi | 3/2.5 | 1,405 (+2%) | 0mo | $150,000 | $107 | 80 |
| 2560 Woodsage Dr | 0.43mi | 3/3.0 | 1,390 (+1%) | 1mo | $220,000 | $158 | 74 |
| 2940 Dover Dr | 0.50mi | 3/2.0 | 1,402 (+2%) | 1mo | $210,000 | $150 | 73 |
| 14741 Mondoubleau Ln | 0.58mi | 3/2.0 | 1,491 (+8%) | 2mo | $239,000 | $160 | 58 |
| 2945 Dover Dr | 0.53mi | 4/2.0 (+1) | 1,470 (+6%) | 2mo | $185,400 | $126 | 57 |
| 3914 Birkemeier Dr | 0.68mi | 3/2.0 | 1,315 (-5%) | 6mo | $222,000 | $169 | 56 |
| 2910 Wellington Dr | 0.47mi | 4/2.0 (+1) | 1,517 (+10%) | 1mo | $159,900 | $105 | 55 |
| 4028 Les Cherbourg Ln | 0.53mi | 3/2.0 | 1,537 (+11%) | 4mo | $250,000 | $163 | 53 |
| 9 Darwin Ct | 0.44mi | 3/3.0 | 1,540 (+12%) | 4mo | $235,000 | $153 | 53 |
| 7 Darwin Ct | 0.46mi | 4/2.0 (+1) | 1,560 (+13%) | 0mo | $200,000 | $128 | 52 |
| 4120 90th Ave | 0.64mi | 3/2.0 | 1,264 (-8%) | 6mo | $279,900 | $221 | 51 |
| 15550 Fox Plains Dr | 0.73mi | 3/2.0 | 1,178 (-15%) | 1mo | $249,000 | $211 | 41 |
Match score weights: distance 35% · size 25% · config 20% · recency 20%. Top-matched comps best support the ARV.
Projected returns pro-forma
10.0% appreciation · 7.51% rent growth · sell at horizon
- IRR
- 23.3%
- Equity multiple
- 2.90×
- Total profit
- $132,773
- Equity at exit
- $225,220
- IRR
- 21.8%
- Equity multiple
- 7.02×
- Total profit
- $421,422
- Equity at exit
- $485,695
Cash invested: $70,000 (down + closing). Projections, not guarantees.
Landlord ↔ Tenant lean methodology
- Overall (STATE)
- 81 Strongly Landlord-Friendly
- State Missouri
- 81 Strongly Landlord-Friendly · R+10
- County
- — inherits STATE
- City
- — inherits STATE
ZIP-level market 63033
- Home prices YoY
- 2.5%
- Rents YoY
- 7.5%
- Active inventory
- 218
- Price-to-rent
- 11.4×
Monthly cashflow live
- Estimated rent
- $1,825 high interval (Pro) →
- Mortgage (P&I)
- −$1,311
- Tax from tax record
- −$207 /mo · $2,489/yr
- Insurance
- −$104
- HOA
- −$8
- Vacancy / Maint / Mgmt
- −$383
- Net cashflow
- $-189
Break-even live
UW: 25.0% down · 7.5% · 30yr · 1.5% tax · 5.0% vac · 8.0% maint · 8.0% mgmt
Financing live
Cash to close
- Down payment
- $62,500
- Closing costs
- $7,500
- Reserves months
- —
- Total cash needed
- —
Loan-product check · same deal, 3 products live
Conventional
25% down · 7.5% · 30yr
- Down + closing
- —
- Monthly P&I
- —
- Monthly cashflow
- —
- DSCR
- —
- Eligible?
- —
Personal DTI + credit; lowest rate.
DSCR
20% down · 8.5% · 30yr
- Down + closing
- —
- Monthly P&I
- —
- Monthly cashflow
- —
- DSCR
- —
- Eligible?
- —
No personal income docs; deal must DSCR.
Hard money
10% down · 12.0% · 12mo
- Down + closing
- —
- Monthly P&I
- —
- Monthly cashflow
- —
- DSCR
- —
- Eligible?
- —
Short-term bridge; refi at stabilization.
Rent comps 18 comps
| Address | Beds | Baths | Sqft | Rent | $/sqft | DOM | Units | Dist |
|---|---|---|---|---|---|---|---|---|
| 3144 Sunswept Pk Ct Florissant, MO | 1.0–3.0 | 1.0–2.0 | 818 | $1,250 | $1.53 | 1d | 12 | 0.45mi |
| 13 Cricket Ct Florissant, MO | 4.0 | 3.0 | 1560 | $2,550 | $1.63 | 43d | 1 | 0.52mi |
| 1983 Greenheath Dr Florissant, MO | 3.0 | 2.0 | 1040 | $1,331 | $1.28 | 3d | 1 | 0.75mi |
| 15686 93rd Ave Florissant, MO | 3.0 | 2.0 | 1370 | $1,948 | $1.42 | 12d | 1 | 0.90mi |
| 330 Moule Dr Florissant, MO | 3.0 | 1.0 | 1014 | $1,575 | $1.55 | 43d | 1 | 0.97mi |
| 2942 Chance Dr Florissant, MO | 3.0 | 1.0 | 912 | $1,700 | $1.86 | 12d | 1 | 0.99mi |
| 775 Sherwood Dr Florissant, MO | 3.0 | 1.0 | 1023 | $1,690 | $1.65 | 43d | 1 | 1.03mi |
| 2990 Santiago Dr Florissant, MO | 2.0 | 2.0 | 984 | $1,200 | $1.22 | 43d | 1 | 1.04mi |
| 1785 Trotter Way Florissant, MO | 3.0 | 2.0 | 1297 | $1,806 | $1.39 | 7d | 1 | 1.05mi |
| 3 Cantabrian Ct Florissant, MO | 3.0 | 2.0 | 1436 | $1,881 | $1.31 | 14d | 1 | 1.06mi |
| 4112 Monsols Dr Florissant, MO | 3.0 | 2.0 | 1120 | $1,945 | $1.74 | 43d | 1 | 1.10mi |
| 2075 Cordoba Dr Florissant, MO | 3.0 | 2.0 | 1523 | $1,850 | $1.21 | 14d | 1 | 1.16mi |
| 2857 Dawnview Dr Florissant, MO | 3.0 | 1.0 | 890 | $1,325 | $1.49 | 7d | 1 | 1.21mi |
| 1600 Horseshoe Dr Florissant, MO | 3.0 | 2.0 | 1314 | $1,550 | $1.18 | 43d | 1 | 1.25mi |
| 3930 Belcroft Dr Florissant, MO | 3.0 | 3.0 | 1408 | $1,935 | $1.37 | 43d | 1 | 1.25mi |
| 1710 Kay Dr Florissant, MO | 3.0 | 1.0 | 960 | $1,500 | $1.56 | 2d | 1 | 1.28mi |
| 1740 Deborah Dr Florissant, MO | 3.0 | 2.5 | 1650 | $1,750 | $1.06 | 17d | 1 | 1.32mi |
| 1332 Langholm Dr Florissant, MO | 3.0 | 1.0 | 924 | $1,650 | $1.79 | 1d | 1 | 1.41mi |
HOA detail
- Monthly dues
- $8 · $96/yr
- Likely covers
- watergas
Listing history 9 events
-
2026-06-02statusdays on market $250,000 Pending 26 DOM
-
2026-06-01days on market $250,000 Active 25 DOM
-
2026-05-31days on market $250,000 Active 24 DOM
-
2026-05-12historical Active Under Contract 1222-char remark
-
2026-05-08$250,000 Active 1222-char remark
-
2026-05-07historical $250,000 1222-char remark
-
2002-08-06soldstatus $120,000
-
1997-10-06soldstatus $93,000
-
1994-03-07soldstatus
ⓘ Source: listings_history table (triggers on properties + properties_extension) + one-shot
backfill from property_details.listing_events for pre-trigger history.
Tax reassessment forecast MO · Resets to sale price
- Current annual tax
- $2,489 · $207/mo
- Projected year-2 tax
- $2,489 · $207/mo
- Expected delta
- $0/yr ($0/mo · 0.0%)
ⓘ Screening estimate from a state-policy table — verify with the county assessor before closing.
Climate risk First Street
- Flood 1/10 Low FEMA zone X (unshaded) · 0% chance over 30 yrs
- Wildfire 1/10 Low
- Heat 5/10 Major 7 d/yr ≥106°F today · 21 d/yr by 30 yrs out
- Wind 2/10 Low 100% chance of damaging wind over 30 yrs
- Air quality 3/10 Moderate 3 unhealthy d/yr today · 5 by 30 yrs out
Nearby sold comps map
Loading sold comps map…
Walkable amenities ~0.75 mi
Loading nearby amenities…
Taxation est. · year 1
- Rental income
- $21,904
- − Mortgage interest
- −$14,004
- − Property taxes
- −$2,489
- − Insurance
- −$1,250
- − Repairs & maintenance
- −$1,752
- − Management
- −$1,752
- − HOA
- −$96
- − Depreciation
- −$7,273
- Taxable loss
- −$6,712
- Est. tax savings @ 24.0%
- +$1,611
- After-tax cash flow
- $-652/yr
For passive investors: Depreciation is non-cash, so a rental often shows a tax loss while cash-flowing — sheltering income. Rental losses are passive: they offset passive income freely, and up to $25,000/yr can offset ordinary (W-2) income if you actively participate and your MAGI is under $100k (phasing out to $0 by $150k); unused losses carry forward. On sale, claimed depreciation is recaptured at up to 25%, and gains may owe capital-gains tax (a 1031 exchange can defer both). Figures are a year-1 estimate at your 24.0% rate — not tax advice; consult a CPA.
Schools (NCES district)
- District
- Ferguson-Florissant R-II
- NCES district ID
- 2912010
- Math proficiency
- 7% ▼ -9.00%
- Reading proficiency
- 20% ▼ -6.00%
- Median HH income
- $44,610
- Composite
- 11.96/100
- National rank
- #9666
- State rank
- #311 of 324 in MO
Livability — Old Jamestown
- Score
- 66/100
- State rank
- #247
- US rank
- #12156
Category grades
Schools grade is shown separately in the Schools card above.
Census & demographics
- Census place
- Old Jamestown, MO
- County
- Saint Louis County · 888,823 people
- City population
- 19,557
- Metro
- St. Louis, MO-IL
- Population (ZIP)
- 43,056
- Household income
- $66,776
- Rent vs Own
- Severe rent burden
- 1429.0
Population outlook (St. Louis County) Hauer SSP2
- Today (2025)
- 1,025,227 people
- By 2030
- 1,028,023 · +0.3%
- By 2040
- 1,020,940 · -0.4%
- By 2050
- 1,007,280 · -1.8%
- By 2075
- 987,277 · -3.7%
- By 2100
- 921,984 · -10.1%
Race, ethnicity, and origin ACS 2023
- Neighborhood character
- Predominantly Black (71%)
- Race & ethnicity
- Black 71% White 23% Two or more races 4% Hispanic / Latino 1%
- Common ancestry
- Romanian 1% Lithuanian 1% Italian 1%
- Foreign-born
- 3% · Canada, Vietnam
- Languages at home
- 95% English-only · Spanish 1% French/Haitian/Cajun 1%
Political lean MEDSL · St. Louis
- 2024 margin
- Strong D (+23.4) · D 60.8% · R 37.4% · Other 1.7%
- 2008→2024 swing
- +3.5pp toward D · 2008: 19.9pp · 2024: 23.4pp
- All cycles
- 2024: D+23.4 2020: D+24.0 2016: D+16.2 2012: D+13.7 2008: D+19.9
Not yet ingested
- Civics
- —
Market trends
- HPI YoY
- ▲ 13.78%
- Current HPI
- 570.6
- Rent YoY
- ▲ 7.51%
- Metro
- St. Louis, MO-IL
- State GDP YoY
- ▲ 1.84%
- F500 in state
- 20
Industry mix (Fortune 500 HQ in MO)
| Industry | F500 HQs | Revenue |
|---|---|---|
| Healthcare | 1 | $163B |
|
||
| Insurance | 1 | $21B |
|
||
| Industrial Technology | 1 | $17B |
|
||
| Retail | 1 | $16B |
|
||
| Industrial Distribution | 1 | $10B |
|
||
| Utilities | 1 | $9B |
|
||
Price history
+168.8% since first listed8 events — show timeline
- 2026-06-02 Pending — MARIS as Distributed by MLS Grid
- 2026-05-22 Relisted — MARIS as Distributed by MLS Grid
- 2026-05-12 Contingent — MARIS as Distributed by MLS Grid
- 2026-05-08 Listed $250,000 MARIS as Distributed by MLS Grid
- 2026-05-07 Coming Soon $250,000 MARIS as Distributed by MLS Grid
- 2002-08-06 Sold (Public Records) $120,000 Public Records
- 1997-10-06 Sold (Public Records) $93,000 Public Records
- 1994-03-07 Sold (Public Records) — Public Records
Property tax history
+2.6%/yrLatest (2022): $2,489 · +5.1% YoY. Source: county tax records.
Cash-flow waterfall
monthlySold comps — $/sqft
last 12 mo · ≤1 miLoading sold comps…