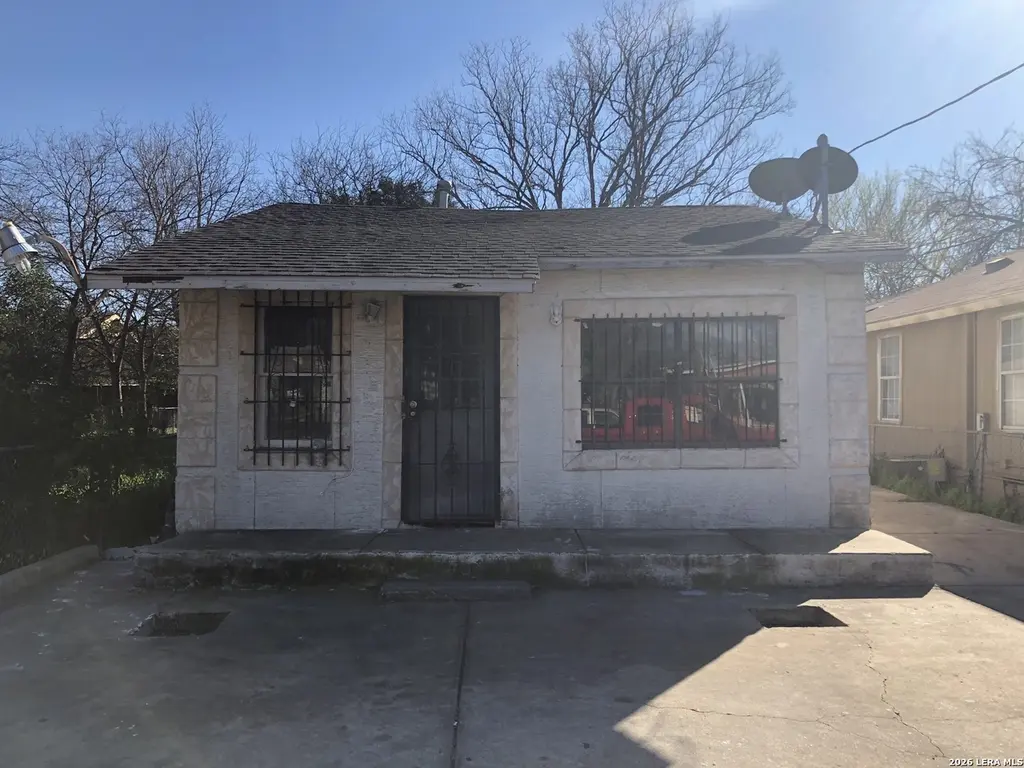
2412 Potosi St · San Antonio, TX
Flood risk 1/10 · Minimal
- FEMA flood zone
- X (unshaded)
- Chance of flooding over 30 yrs
- 0.0%
- Est. flood insurance / yr
- $507 – $1,088
Fire risk 1/10 · Minimal
- Est. fire insurance / yr
- $1,222 – $2,270
Heat risk 8/10 · Major
- Hot days now (above 109°F)
- 7 days/yr
- Hot days in 30 yrs
- 22 days/yr
Wind risk 7/10 · Major
- Chance of severe wind over 30 yrs
- 78.0%
Air-quality risk 2/10 · Minimal
- Unhealthy air days now
- 1 days/yr
- Unhealthy air days in 30 yrs
- 2 days/yr
Risk factors via First Street. Map © Google.
Why this score? — see what drove the A grade
The composite is a weighted blend of 9 inputs, each scored 0–100. Each bar is that input's sub-score; the figure is the points it added to the 100-point composite (weight × sub-score).
- Cash flow +30.0/30.0
- ARV discount +13.9/15.0
- 1% rule +10.0/10.0
- DSCR +10.0/10.0
- Appreciation +10.0/10.0
- Rent growth +4.4/5.0
- Livability +4.0/5.0
- Condition / age +2.5/5.0
- Schools +1.4/10.0
$85,000
🖨 Deal sheet 📄 Offer letter ✓ Due diligence
Listing remarks
This house could be a lovely little home with sweat equity. Owner Finance Available.
Key facts
- 3,528 sq ft lot
- Built 1947
- Listed 23 days
Property features AI
Finance
- Other: Subdivision: Greater Gardendale / CUPPLES/ZARZAMORA; Possession at closing/funding; For sale
- Financial info: Down payment resource not indicated
Exterior
- Utilities: Water system; Sewer system
- Home design: Siding exterior with one side masonry; Pre-owned; Approximate age: 79 years
- Construction: Composition roof
- Exterior features: City view
Interior
- Kitchen: Kitchen (8 x 8); Gas cooking
- Bedrooms: Master bedroom on lower level (11 x 11); Second bedroom (10 x 10)
- Flooring: Unstained concrete flooring
- Bathrooms: 1 full bathroom
- Heating & cooling: Natural gas heat; Other heating (see remarks)
- Interior features: Gas cooking; City garbage service; One living area
Neighborhood map
What this means for you Summary
Snapshot
- This is a 2-bed/1.0-bath single-family listed at $85k.
Deal economics
- At list price, monthly cash flow is $393 ($5k/yr) — positive.
- The deal already cash-flows at list — no discount required.
- Meets the 1% rule at list price ($1k rent vs $85k).
- Recommended offer: $84k (1.5% below list) — sets the bar for market timing.
- Cap rate 11.8% vs local median 3.8% in San Antonio — top-decile yield for the area; either an underpriced asset or a hidden risk that comps aren't pricing in. Stress-test before assuming the spread holds.
Location & tenants
- Location reads 80/100 on livability (#31 in TX, #1,616 nationally) — a professional / high-income tenant draw. Strengths: amenities A+, commute A+, cost of living A+; Watch: crime F.
- San Antonio ISD (urban): math 12% / reading 22% proficiency, ranked #805 of 826 in TX (top 98%) — low school quality limits family demand, transient renter base, plan for 1-2y turnover; 80% free/reduced lunch — lower-income household profile, screen leases tightly.
- Zoned schools: Sarah S King El (math 22% / reading 27%, grade F, #3,052 of 4,322 statewide, top 74%, 564 students, 98% FRL); Lanier H S (math 9% / reading 15%, grade F, #1,554 of 1,632 statewide, top 95%, 1,547 students, 97% FRL) — zoned schools average 97% FRL vs 80% district-wide (17 pts higher); higher-poverty schools than district average — tighter screening recommended.
- Market conditions: Rents rising fast (+7.7%/yr); 154 active listings in the ZIP; 17 comparable units currently listed for rent nearby; rentals at typical pace (median 15d on market — plan ~3-4 weeks tenant-placement turnaround); lower-income renter base — watch delinquency; 8,308 units permitted in Bexar County in 2024 (2,506 in 5+ unit buildings).
Forward outlook
- In year one you build about $9k of equity ($588 loan paydown + $8k appreciation (10.0% local appreciation)).
- Bexar County population projected at +50% by 2050 — long-run rental-demand tailwind backs the buy-and-hold thesis.
- At projected returns (10.0% appreciation + 7.7% rent growth), your $24k cash investment doubles in ~2 years — after that, you're playing with house money.
- By year 4, paydown + projected appreciation supports a ~$32k cash-out refi (75% LTV) — recoverable capital for the next deal without selling this one.
Negotiation context
- It's been on market 23 days — a 2% lower offer ($84k) is reasonable based on typical stale-listing flexibility.
- 2 sale attempts since 6y ago with the ask held roughly flat each time — persistent listings suggest the price (not the market) is what's stuck; bring a comps-based counter.
Risks & watch-outs
- Watch-outs: built in 1947 — expect roof / HVAC / electrical / plumbing capex.
- Climate carrying-cost: major wind risk, 78% chance of damaging wind over 30y; extreme-heat days projected 7→22/yr by 2055 (HVAC capex compounding) — expect insurance premiums to compound above CPI over the hold.
Questions for the listing agent
- Built in 1947 — when were the roof, HVAC, electrical panel, plumbing, and water heater last replaced?
- Is there a deadline driving the sale (1031 exchange, divorce, estate, relocation)? That informs how much negotiation room exists.
- Crime grade is F in this area — have there been break-ins, vandalism, or insurance claims at this property in the last 3 years? What carrier currently insures it and at what premium?
- What's the average days-on-market for RENTAL listings here right now (not sales)? A rising rental-DOM trend means longer vacancies and softer asking-rent achievability than the comps imply.
- What's the recent tenant-quality profile in this submarket — average credit score on applications, eviction rate, late-payment / NSF rate, and stable-employment percentage? A property-management company in the area should have these aggregated.
- How much new for-sale + rental construction is in the pipeline within 1–3 miles? Heavy new supply typically softens prices + rents 12–24 months out; constrained supply supports both.
Investment metrics
- 1% rule
- 1.52% ✓
- Cap rate
- 11.85%
- Cash-on-cash
- 19.83%
- DSCR
- 1.88
- GRM
- 5.5
CMA / ARV
- ARV (on-the-fly)
- $98,988
- Comps found
- 11
Show comp detail 11 sales within ~0.75 mi
| Address | Dist | Beds/Ba | Sqft | Sold | Price | $/sf | Match |
|---|---|---|---|---|---|---|---|
| 2719 Chihuahua | 0.23mi | 2/1.0 | 824 (-6%) | 1mo | $85,000 | $103 | 79 |
| 2714 Tampico | 0.17mi | 3/1.0 (+1) | 833 (-5%) | 1mo | $124,900 | $150 | 78 |
| 1515 Elvira | 0.46mi | 2/1.0 | 876 (0%) | 9mo | $98,900 | $113 | 71 |
| 3537 S Laredo St | 0.08mi | 3/1.0 (+1) | 987 (+13%) | 4mo | $104,999 | $106 | 67 |
| 231 Lansing Ln | 0.74mi | 2/1.0 | 864 (-1%) | 1mo | $69,000 | $80 | 63 |
| 1122 Elvira St | 0.69mi | 2/2.0 | 890 (+2%) | 2mo | $164,900 | $185 | 60 |
| 605 SW 19th St | 0.59mi | 2/1.0 | 816 (-7%) | 8mo | $74,900 | $92 | 54 |
| 3001 Chihuahua | 0.21mi | 3/2.0 (+1) | 920 (+5%) | 23mo | $189,000 | $205 | 54 |
| 3033 Chihuahua St | 0.27mi | 2/1.0 | 1,005 (+15%) | 14mo | $172,500 | $172 | 51 |
| 2206 Colima | 0.71mi | 2/2.0 | 923 (+5%) | 6mo | $125,000 | $135 | 49 |
| 1811 Paso Del Sur St | 0.41mi | 3/1.0 (+1) | 989 (+13%) | 17mo | $59,000 | $60 | 41 |
Match score weights: distance 35% · size 25% · config 20% · recency 20%. Top-matched comps best support the ARV.
Projected returns pro-forma
10.0% appreciation · 7.73% rent growth · sell at horizon
- IRR
- 41.7%
- Equity multiple
- 4.27×
- Total profit
- $77,830
- Equity at exit
- $76,575
- IRR
- 38.0%
- Equity multiple
- 10.47×
- Total profit
- $225,382
- Equity at exit
- $165,136
Cash invested: $23,800 (down + closing). Projections, not guarantees.
Landlord ↔ Tenant lean methodology
- Overall (STATE)
- 87 Strongly Landlord-Friendly
- State Texas
- 87 Strongly Landlord-Friendly · R+5
- County
- — inherits STATE
- City
- — inherits STATE
ZIP-level market 78207
- Home prices YoY
- 15.2%
- Rents YoY
- 7.7%
- Active inventory
- 154
- Price-to-rent
- 5.5×
Monthly cashflow live
- Estimated rent
- $1,292 high interval (Pro) →
- Mortgage (P&I)
- −$446
- Tax from tax record
- −$146 /mo · $1,757/yr
- Insurance
- −$35
- HOA
- −$0
- Vacancy / Maint / Mgmt
- −$271
- Net cashflow
- $393
Break-even live
UW: 25.0% down · 7.5% · 30yr · 1.5% tax · 5.0% vac · 8.0% maint · 8.0% mgmt
Financing live
Cash to close
- Down payment
- $21,250
- Closing costs
- $2,550
- Reserves months
- —
- Total cash needed
- —
Loan-product check · same deal, 3 products live
Conventional
25% down · 7.5% · 30yr
- Down + closing
- —
- Monthly P&I
- —
- Monthly cashflow
- —
- DSCR
- —
- Eligible?
- —
Personal DTI + credit; lowest rate.
DSCR
20% down · 8.5% · 30yr
- Down + closing
- —
- Monthly P&I
- —
- Monthly cashflow
- —
- DSCR
- —
- Eligible?
- —
No personal income docs; deal must DSCR.
Hard money
10% down · 12.0% · 12mo
- Down + closing
- —
- Monthly P&I
- —
- Monthly cashflow
- —
- DSCR
- —
- Eligible?
- —
Short-term bridge; refi at stabilization.
Rent comps 17 comps
| Address | Beds | Baths | Sqft | Rent | $/sqft | DOM | Units | Dist |
|---|---|---|---|---|---|---|---|---|
| 2311 Potosi St San Antonio, TX | 3.0 | 1.0 | 864 | $1,600 | $1.85 | 43d | 1 | 0.11mi |
| 1823 San Carlos St San Antonio, TX | 3.0 | 2.0 | 1090 | $1,099 | $1.01 | 2d | 1 | 0.21mi |
| 2812 Vera Cruz San Antonio, TX | 1.0 | 2.0 | 1060 | $1,200 | $1.13 | 4d | 1 | 0.34mi |
| 2721 Colima St San Antonio, TX | 2.0 | 1.0 | 700 | $1,250 | $1.79 | 14d | 1 | 0.44mi |
| 843 Brady Blvd San Antonio, TX | 3.0 | 2.0 | 864 | $1,650 | $1.91 | 23d | 1 | 0.80mi |
| 214 Aztec St San Antonio, TX | 3.0 | 2.0 | 973 | $1,275 | $1.31 | 14d | 1 | 0.83mi |
| 2003 S Zarzamora St San Antonio, TX | 1.0–4.0 | 1.0–2.0 | 1028 | $1,120 | $1.09 | 23d | 1 | 0.85mi |
| 1938 S Zarzamora St Unit 610 San Antonio, TX | 1.0 | 1.0 | 744 | $915 | $1.23 | 3d | 1 | 0.85mi |
| 1938 S Zarzamora St Unit 710 San Antonio, TX | 2.0 | 2.0 | 955 | $1,102 | $1.15 | 3d | 1 | 0.85mi |
| 319 Noria St San Antonio, TX | 3.0 | 1.0 | 1002 | $1,100 | $1.10 | 23d | 1 | 1.00mi |
| 2406 S Laredo St San Antonio, TX | 3.0 | 1.0 | 944 | $1,200 | $1.27 | 14d | 1 | 1.15mi |
| 234 Gould St Unit 102 San Antonio, TX | 2.0 | 1.5 | 948 | $1,195 | $1.26 | 4d | 1 | 1.29mi |
| 2619 W Houston St San Antonio, TX | 3.0 | 1.0 | 776 | $1,800 | $2.32 | 43d | 1 | 1.32mi |
| 509 S Trinity St San Antonio, TX | 3.0 | 1.0 | 921 | $1,300 | $1.41 | 4d | 1 | 1.33mi |
| 626 Kirk Pl San Antonio, TX | 2.0 | 1.0 | 912 | $1,100 | $1.21 | 20d | 1 | 1.38mi |
| 1711 W Cesar E Chavez Blvd Unit 1 San Antonio, TX | 3.0 | 1.0 | 800 | $1,275 | $1.59 | 43d | 1 | 1.46mi |
| 3103 Neptune St San Antonio, TX | 3.0 | 2.0 | 1008 | $1,350 | $1.34 | 43d | 1 | 1.46mi |
Listing history 20 events
-
2026-06-18days on market $85,000 Active 23 DOM
-
2026-06-17days on market $85,000 Active 22 DOM
-
2026-06-16days on market $85,000 Active 21 DOM
-
2026-06-15days on market $85,000 Active 20 DOM
-
2026-06-13days on market $85,000 Active 18 DOM
-
2026-06-09days on market $85,000 Active 14 DOM
-
2026-06-08days on market $85,000 Active 13 DOM
-
2026-06-07statusdays on market $85,000 Active 12 DOM
-
2026-06-04days on market $85,000 New 9 DOM
-
2026-06-03days on market $85,000 New 8 DOM
-
2026-06-02days on market $85,000 New 7 DOM
-
2026-06-01days on market $85,000 New 6 DOM
-
2026-05-31days on market $85,000 New 5 DOM
-
2026-05-26$85,000 New
-
2020-04-24historical
-
2020-03-22price $55,000
-
2020-02-26$58,000 New
-
2007-04-19soldstatus
-
1999-08-03soldstatus
-
1998-08-03soldstatus
ⓘ Source: listings_history table (triggers on properties + properties_extension) + one-shot
backfill from property_details.listing_events for pre-trigger history.
Tax reassessment forecast TX · Resets to sale price
- Current annual tax
- $1,757 · $146/mo
- Projected year-2 tax
- $1,757 · $146/mo
- Expected delta
- $0/yr ($0/mo · 0.0%)
ⓘ Screening estimate from a state-policy table — verify with the county assessor before closing.
Climate risk First Street
- Flood 1/10 Low FEMA zone X (unshaded) · 0% chance over 30 yrs
- Wildfire 1/10 Low
- Heat 8/10 Severe 7 d/yr ≥109°F today · 22 d/yr by 30 yrs out
- Wind 7/10 Severe 78% chance of damaging wind over 30 yrs
- Air quality 2/10 Low 1 unhealthy d/yr today · 2 by 30 yrs out
Nearby sold comps map
Loading sold comps map…
Walkable amenities ~0.75 mi
Loading nearby amenities…
Taxation est. · year 1
- Rental income
- $15,507
- − Mortgage interest
- −$4,761
- − Property taxes
- −$1,757
- − Insurance
- −$425
- − Repairs & maintenance
- −$1,241
- − Management
- −$1,241
- − Depreciation
- −$2,473
- Taxable income
- $3,610
- Est. tax owed @ 24.0%
- −$866
- After-tax cash flow
- $3,853/yr
For passive investors: Depreciation is non-cash, so a rental often shows a tax loss while cash-flowing — sheltering income. Rental losses are passive: they offset passive income freely, and up to $25,000/yr can offset ordinary (W-2) income if you actively participate and your MAGI is under $100k (phasing out to $0 by $150k); unused losses carry forward. On sale, claimed depreciation is recaptured at up to 25%, and gains may owe capital-gains tax (a 1031 exchange can defer both). Figures are a year-1 estimate at your 24.0% rate — not tax advice; consult a CPA.
Schools (NCES district)
- District
- San Antonio ISD
- NCES district ID
- 4838730
- Math proficiency
- 12% ▼ -21.00%
- Reading proficiency
- 22% ▼ -7.00%
- Median HH income
- $30,952
- Composite
- 13.57/100
- National rank
- #9512
- State rank
- #805 of 826 in TX
Livability — San Antonio
- Score
- 80/100
- State rank
- #31
- US rank
- #1616
Category grades
Schools grade is shown separately in the Schools card above.
Census & demographics
- Census place
- San Antonio, TX
- County
- Bexar County · 1,990,555 people
- City population
- 1,806,925
- Metro
- San Antonio-New Braunfels, TX
- Population (ZIP)
- 55,474
- Household income
- $32,472
- Rent vs Own
- Severe rent burden
- 2789.0
Population outlook (Bexar County) Hauer SSP2
- Today (2025)
- 2,336,851 people
- By 2030
- 2,560,728 · +9.6%
- By 2040
- 3,020,569 · +29.3%
- By 2050
- 3,493,522 · +49.5%
- By 2075
- 4,668,459 · +99.8%
- By 2100
- 5,533,242 · +136.8%
Race, ethnicity, and origin ACS 2023
- Neighborhood character
- Predominantly Hispanic (88%)
- Race & ethnicity
- Hispanic / Latino 88% Two or more races 41% White 6% Black 5% Native American 2%
- Hispanic origin (detail)
- Mexican 79%
- Foreign-born
- 19% · Canada
- Languages at home
- 39% English-only · Spanish 60%
Political lean MEDSL · Bexar
- 2024 margin
- Lean D (+9.8) · D 54.3% · R 44.6% · Other 1.1%
- 2008→2024 swing
- +4.2pp toward D · 2008: 5.6pp · 2024: 9.8pp
- All cycles
- 2024: D+9.8 2020: D+18.2 2016: D+13.5 2012: D+4.6 2008: D+5.6
Not yet ingested
- Civics
- —
Market trends
- HPI YoY
- ▲ 34.92%
- Current HPI
- 264.7559
- Rent YoY
- ▲ 7.73%
- Metro
- San Antonio-New Braunfels, TX
- State GDP YoY
- ▲ 3.95%
- F500 in state
- 110
Industry mix (Fortune 500 HQ in TX)
| Industry | F500 HQs | Revenue |
|---|---|---|
| Energy | 16 | $1,198B |
|
||
| Technology | 5 | $198B |
|
||
| Engineering / Construction | 4 | $72B |
|
||
| Energy Services | 3 | $60B |
|
||
| Utilities | 3 | $41B |
|
||
| Healthcare | 2 | $330B |
|
||
Price history
+46.6% since first listed7 events — show timeline
- 2026-05-26 Listed $85,000 LERA
- 2020-04-24 Listing Removed — LERA
- 2020-03-22 Price Changed $55,000 LERA
- 2020-02-26 Listed $58,000 LERA
- 2007-04-19 Sold (Public Records) — Public Records
- 1999-08-03 Sold (Public Records) — Public Records
- 1998-08-03 Sold (Public Records) — Public Records
Property tax history
+6.0%/yrLatest (2025): $1,757 · -2.7% YoY. Source: county tax records.
Cash-flow waterfall
monthlySold comps — $/sqft
last 12 mo · ≤1 miLoading sold comps…