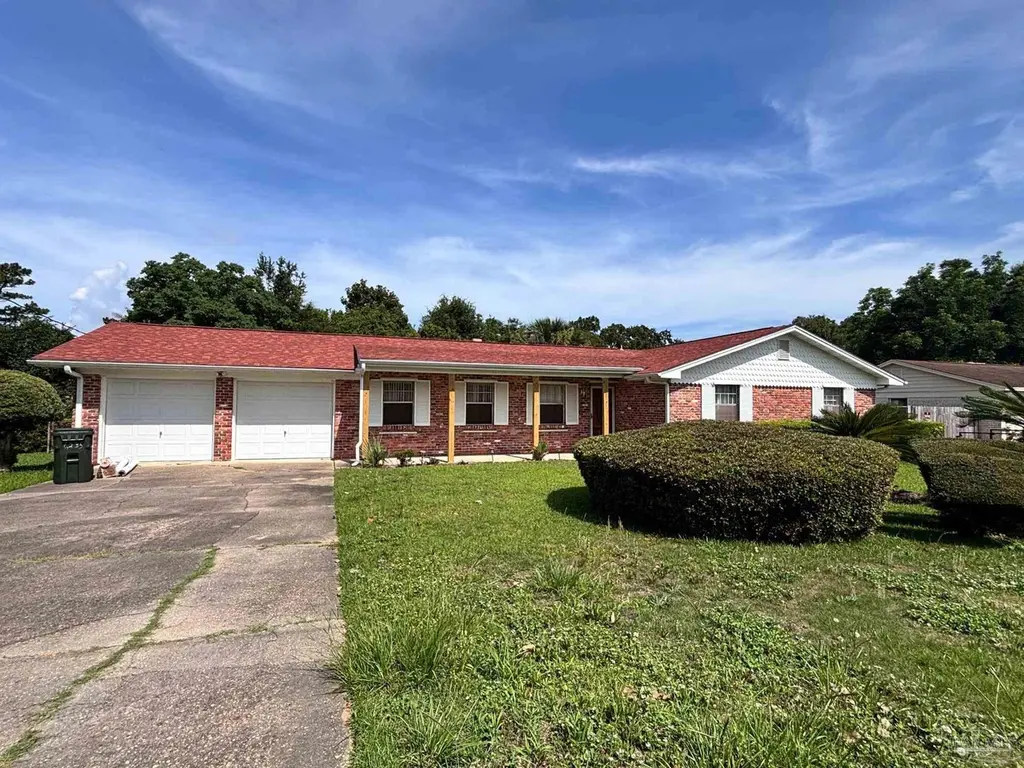
6235 Confederate Dr · Brent, FL
Flood risk 1/10 · Minimal
- FEMA flood zone
- X (unshaded)
- Chance of flooding over 30 yrs
- 0.0%
- Est. flood insurance / yr
- $507 – $1,088
Fire risk 1/10 · Minimal
- Est. fire insurance / yr
- $947 – $1,759
Heat risk 10/10 · Severe
- Hot days now (above 106°F)
- 7 days/yr
- Hot days in 30 yrs
- 22 days/yr
Wind risk 9/10 · Severe
- Chance of severe wind over 30 yrs
- 99.0%
Air-quality risk 1/10 · Minimal
- Unhealthy air days now
- 0 days/yr
- Unhealthy air days in 30 yrs
- 0 days/yr
Risk factors via First Street. Map © Google.
Why this score? — see what drove the D+ grade
The composite is a weighted blend of 9 inputs, each scored 0–100. Each bar is that input's sub-score; the figure is the points it added to the 100-point composite (weight × sub-score).
- ARV discount +14.8/15.0
- Cash flow +13.5/30.0
- DSCR +4.1/10.0
- 1% rule +3.7/10.0
- Schools +3.6/10.0
- Livability +3.5/5.0
- Rent growth +3.3/5.0
- Condition / age +2.5/5.0
- Appreciation +0.0/10.0
$225,000
🖨 Deal sheet 📄 Offer letter ✓ Due diligence
Listing remarks
Welcome to this inviting 4-bed, 2-bath home nestled on over a quarter-acre lot, offering plenty of room to relax, entertain, and grow. Step inside to find a functional layout featuring a cozy living room, a dedicated dining room, and a comfortable family room—perfect for hosting gatherings or enjoying quiet evenings by the fireplace. The home boasts a bright and expansive Florida room that adds versatile living space year-round. While the kitchen is compact and ready for your personal touch, the overall potential of this home shines through. With a little updating, it could truly become your dream space.
Key facts
- Cozy living room
- Florida room
- 0.31 acre lot
Tags
Property features AI
Exterior
- Home design: Single-family residence
Neighborhood map
What this means for you Summary
Snapshot
- This is a 4-bed/2.0-bath single-family listed at $225k.
Deal economics
- At list price, monthly cash flow is $7 ($80/yr) — positive.
- The deal already cash-flows at list — no discount required.
- To meet the 1% rule (rent ≥ 1% of price), the offer needs to be $196k (13.0% below list).
- Recommended offer: $196k (13.0% below list) — sets the bar for 1% rule.
Location & tenants
- Location reads 69/100 on livability (#484 in FL) — a middle-class / working-renter tenant base. Strengths: cost of living A+, housing A+, health & safety A+; Watch: crime D, amenities F, commute F.
- Escambia (suburban): math 40% / reading 45% proficiency, ranked #56 of 73 in FL (top 77%) — families likely to look elsewhere, expect single-tenant / working-renter base with shorter leases.
- Market conditions: Rents rising (+3.4%/yr); 240 active listings in the ZIP; 11 comparable units currently listed for rent nearby; rentals at typical pace (median 23d on market — plan ~3-4 weeks tenant-placement turnaround); 1,479 units permitted in Escambia County in 2024 (0 in 5+ unit buildings).
- This rent runs 33% of the median local income ($71k/yr) — at the standard rent-burdened threshold; future hikes will face affordability resistance.
Forward outlook
- Local home prices are declining (-3.0%/yr); year-one equity from $2k of loan paydown is wiped out by about $7k of value loss. Plan a longer hold.
- Escambia County population projected at +13% by 2050 — modest demand growth; plan on rents tracking national, not racing it.
Negotiation context
- It's been on market 320 days — a 12% lower offer ($198k) is reasonable based on typical stale-listing flexibility.
- 2 sale attempts; this cycle's ask has dropped $45k (17%) from the opening price — seller is motivated, your offer sets the floor, not the list.
- Current owner paid $90k; list at $225k implies a 151% gain — meaningful room to come down on a strong offer.
Risks & watch-outs
- Climate carrying-cost: severe wind risk, 99% chance of damaging wind over 30y; extreme-heat days projected 7→22/yr by 2055 (HVAC capex compounding) — expect insurance premiums to compound above CPI over the hold.
Questions for the listing agent
- It's been on market 320 days. Have you received any prior offers? Is the seller open to a 13% concession, seller financing, or rate buy-down credit?
- Built in 1970 — when were the roof, HVAC, electrical panel, plumbing, and water heater last replaced?
- Why hasn't it sold? Are there any deal-killer items the seller is aware of (foundation, flood, title, zoning, code violations)?
- Is there a deadline driving the sale (1031 exchange, divorce, estate, relocation)? That informs how much negotiation room exists.
- Crime grade is D in this area — have there been break-ins, vandalism, or insurance claims at this property in the last 3 years? What carrier currently insures it and at what premium?
- The area grade is low — what's the realistic commute time and amenity access for the typical tenant pool here? Any planned neighborhood developments (good or bad) we should know about?
- What's the average days-on-market for RENTAL listings here right now (not sales)? A rising rental-DOM trend means longer vacancies and softer asking-rent achievability than the comps imply.
- What's the recent tenant-quality profile in this submarket — average credit score on applications, eviction rate, late-payment / NSF rate, and stable-employment percentage? A property-management company in the area should have these aggregated.
- How much new for-sale + rental construction is in the pipeline within 1–3 miles? Heavy new supply typically softens prices + rents 12–24 months out; constrained supply supports both.
Investment metrics
- 1% rule
- 0.87% ✗
- Cap rate
- 6.33%
- Cash-on-cash
- 0.13%
- DSCR
- 1.01
- GRM
- 9.6
CMA / ARV
- ARV (on-the-fly)
- $268,710
- Comps found
- 12
Show comp detail 12 sales within ~0.75 mi
| Address | Dist | Beds/Ba | Sqft | Sold | Price | $/sf | Match |
|---|---|---|---|---|---|---|---|
| 110 Gettysburg Dr | 0.17mi | 3/2.0 (-1) | 1,636 (+3%) | 7mo | $237,900 | $145 | 76 |
| 6227 Vicksburg Dr | 0.15mi | 3/2.0 (-1) | 1,740 (+9%) | 1mo | $199,900 | $115 | 71 |
| 117 Monarch Ln | 0.58mi | 3/2.0 (-1) | 1,624 (+2%) | 2mo | $310,000 | $191 | 63 |
| 441 Shiloh Dr | 0.51mi | 3/2.0 (-1) | 1,517 (-5%) | 2mo | $205,000 | $135 | 62 |
| 359 Tree Swallow Dr | 0.58mi | 3/2.0 (-1) | 1,607 (+1%) | 6mo | $295,000 | $184 | 61 |
| 6043 Songbird Dr | 0.31mi | 3/2.0 (-1) | 1,711 (+8%) | 8mo | $295,000 | $172 | 61 |
| 176 Creekview Dr | 0.72mi | 3/2.0 (-1) | 1,538 (-3%) | 8mo | $260,000 | $169 | 50 |
| 400 Hilburn Ln | 0.71mi | 3/2.0 (-1) | 1,515 (-5%) | 7mo | $264,000 | $174 | 48 |
| 6356 Parakeet Trl | 0.49mi | 3/2.0 (-1) | 1,395 (-12%) | 5mo | $275,000 | $197 | 47 |
| 355 Cardinal Cove Ct | 0.57mi | 3/2.0 (-1) | 1,742 (+10%) | 8mo | $265,000 | $152 | 46 |
| 7116 Dale St | 0.52mi | 3/2.0 (-1) | 1,375 (-14%) | 3mo | $210,000 | $153 | 46 |
| 189 Overlook Dr | 0.62mi | 3/1.5 (-1) | 1,352 (-15%) | 4mo | $113,000 | $84 | 36 |
Match score weights: distance 35% · size 25% · config 20% · recency 20%. Top-matched comps best support the ARV.
Projected returns pro-forma
-3.0% appreciation · 3.39% rent growth · sell at horizon
- IRR
- -15.7%
- Equity multiple
- 0.44×
- Total profit
- $-35,243
- Equity at exit
- $33,548
- IRR
- -6.5%
- Equity multiple
- 0.57×
- Total profit
- $-26,872
- Equity at exit
- $19,454
Cash invested: $63,000 (down + closing). Projections, not guarantees.
Landlord ↔ Tenant lean methodology
- Overall (STATE)
- 87 Strongly Landlord-Friendly
- State Florida
- 87 Strongly Landlord-Friendly · R+3
- County
- — inherits STATE
- City
- — inherits STATE
ZIP-level market 32503
- Rents YoY
- 3.4%
- Active inventory
- 240
- Price-to-rent
- 9.6×
Monthly cashflow live
- Estimated rent
- $1,956 high interval (Pro) →
- Mortgage (P&I)
- −$1,180
- Tax from tax record
- −$265 /mo · $3,182/yr
- Insurance
- −$94
- HOA
- −$0
- Vacancy / Maint / Mgmt
- −$411
- Net cashflow
- $7
Break-even live
UW: 25.0% down · 7.5% · 30yr · 1.5% tax · 5.0% vac · 8.0% maint · 8.0% mgmt
Financing live
Cash to close
- Down payment
- $56,250
- Closing costs
- $6,750
- Reserves months
- —
- Total cash needed
- —
Loan-product check · same deal, 3 products live
Conventional
25% down · 7.5% · 30yr
- Down + closing
- —
- Monthly P&I
- —
- Monthly cashflow
- —
- DSCR
- —
- Eligible?
- —
Personal DTI + credit; lowest rate.
DSCR
20% down · 8.5% · 30yr
- Down + closing
- —
- Monthly P&I
- —
- Monthly cashflow
- —
- DSCR
- —
- Eligible?
- —
No personal income docs; deal must DSCR.
Hard money
10% down · 12.0% · 12mo
- Down + closing
- —
- Monthly P&I
- —
- Monthly cashflow
- —
- DSCR
- —
- Eligible?
- —
Short-term bridge; refi at stabilization.
Rent comps 11 comps
| Address | Beds | Baths | Sqft | Rent | $/sqft | DOM | Units | Dist |
|---|---|---|---|---|---|---|---|---|
| 118 Czar Ln Pensacola, FL | 4.0 | 2.0 | 1477 | $1,795 | $1.22 | 23d | 1 | 0.48mi |
| 204 Tree Swallow Dr Pensacola, FL | 3.0 | 2.0 | 1500 | $2,000 | $1.33 | 23d | 1 | 0.51mi |
| 147 Creekview Dr Pensacola, FL | 3.0 | 2.0 | 1188 | $1,700 | $1.43 | 13d | 1 | 0.82mi |
| 400 Schubert Dr Pensacola, FL | 3.0 | 2.5 | 1600 | $2,100 | $1.31 | 23d | 1 | 0.86mi |
| 7812 Oak Forest Dr Pensacola, FL | 3.0 | 1.5 | 1166 | $1,750 | $1.50 | 23d | 1 | 1.11mi |
| 6115 N Davis Hwy Pensacola, FL | 1.0–3.0 | 1.0–2.0 | 1112 | $1,825 | $1.64 | 13d | 10 | 1.12mi |
| 1040 E Olive Rd Pensacola, FL | 1.0–3.0 | 1.0–2.0 | 897 | $1,644 | $1.83 | 23d | 7 | 1.22mi |
| 6016 Sewell St Pensacola, FL | 3.0 | 1.5 | 1377 | $1,650 | $1.20 | 23d | 1 | 1.27mi |
| 7840 Lilac Ln Pensacola, FL | 1.0–3.0 | 1.0–2.0 | 1025 | $1,904 | $1.86 | 13d | 16 | 1.34mi |
| 7101 Joy St Unit I5 Pensacola, FL | 3.0 | 2.0 | 1183 | $1,950 | $1.65 | 23d | 1 | 1.44mi |
| 8440 Chisholm Rd Unit B Pensacola, FL | 3.0 | 2.0 | 1112 | $1,525 | $1.37 | 23d | 1 | 1.49mi |
Listing history 24 events
-
2026-06-18days on market $225,000 Active 320 DOM
-
2026-06-17days on market $225,000 Active 319 DOM
-
2026-06-16days on market $225,000 Active 318 DOM
-
2026-06-15days on market $225,000 Active 317 DOM
-
2026-06-14pricedays on market $225,000 Active 315 DOM
-
2026-06-10days on market $229,500 Active 312 DOM
-
2026-06-09days on market $229,500 Active 311 DOM
-
2026-06-08days on market $229,500 Active 310 DOM
-
2026-06-07days on market $229,500 Active 309 DOM
-
2026-06-03days on market $229,500 Active 305 DOM
-
2026-06-02days on market $229,500 Active 304 DOM
-
2026-06-01days on market $229,500 Active 303 DOM
-
2026-06-01status $229,500 Active 302 DOM
-
2026-04-13status Pending
-
2026-03-26historical Contingent
-
2026-03-20status Active
-
2026-03-17historical Contingent
-
2026-01-22price $229,500
-
2025-10-31price $249,900
-
2025-05-15$269,900 Active
-
1999-08-18soldstatus $89,500
-
1973-01-01soldstatus $33,200
-
1972-01-01soldstatus $32,400
-
1971-01-01soldstatus $27,900
ⓘ Source: listings_history table (triggers on properties + properties_extension) + one-shot
backfill from property_details.listing_events for pre-trigger history.
Tax reassessment forecast FL · Resets to sale price
- Current annual tax
- $3,182 · $265/mo
- Projected year-2 tax
- $3,182 · $265/mo
- Expected delta
- $0/yr ($0/mo · 0.0%)
ⓘ Screening estimate from a state-policy table — verify with the county assessor before closing.
Climate risk First Street
- Flood 1/10 Low FEMA zone X (unshaded) · 0% chance over 30 yrs
- Wildfire 1/10 Low
- Heat 10/10 Extreme 7 d/yr ≥106°F today · 22 d/yr by 30 yrs out
- Wind 9/10 Extreme 99% chance of damaging wind over 30 yrs
- Air quality 1/10 Low 0 unhealthy d/yr today · 0 by 30 yrs out
Nearby sold comps map
Loading sold comps map…
Walkable amenities ~0.75 mi
Loading nearby amenities…
Taxation est. · year 1
- Rental income
- $23,477
- − Mortgage interest
- −$12,603
- − Property taxes
- −$3,182
- − Insurance
- −$1,125
- − Repairs & maintenance
- −$1,878
- − Management
- −$1,878
- − Depreciation
- −$6,545
- Taxable loss
- −$3,736
- Est. tax savings @ 24.0%
- +$897
- After-tax cash flow
- $977/yr
For passive investors: Depreciation is non-cash, so a rental often shows a tax loss while cash-flowing — sheltering income. Rental losses are passive: they offset passive income freely, and up to $25,000/yr can offset ordinary (W-2) income if you actively participate and your MAGI is under $100k (phasing out to $0 by $150k); unused losses carry forward. On sale, claimed depreciation is recaptured at up to 25%, and gains may owe capital-gains tax (a 1031 exchange can defer both). Figures are a year-1 estimate at your 24.0% rate — not tax advice; consult a CPA.
Schools (NCES district)
- District
- Escambia
- NCES district ID
- 1200510
- Math proficiency
- 40% ▼ -9.00%
- Reading proficiency
- 45% ▼ -4.00%
- Median HH income
- $44,649
- Composite
- 36.04/100
- National rank
- #4773
- State rank
- #56 of 73 in FL
Livability — Brent
- Score
- 69/100
- State rank
- #484
- US rank
- #8921
Category grades
Schools grade is shown separately in the Schools card above.
Census & demographics
- Census place
- Brent, FL
- County
- Escambia County · 301,722 people
- City population
- 237,636
- Metro
- Pensacola-Ferry Pass-Brent, FL
- Population (ZIP)
- 33,559
- Household income
- $71,411
- Rent vs Own
- Severe rent burden
- 948.0
Population outlook (Escambia County) Hauer SSP2
- Today (2025)
- 334,637 people
- By 2030
- 345,779 · +3.3%
- By 2040
- 364,828 · +9.0%
- By 2050
- 378,514 · +13.1%
- By 2075
- 403,220 · +20.5%
- By 2100
- 386,125 · +15.4%
Race, ethnicity, and origin ACS 2023
- Neighborhood character
- Predominantly White (68%)
- Race & ethnicity
- White 68% Black 20% Two or more races 6% Hispanic / Latino 5% Asian 2%
- Common ancestry
- Lithuanian 3% Italian 2% Romanian 2%
- Foreign-born
- 5% · Canada, China
- Languages at home
- 93% English-only · Spanish 3% Arabic 1% Tagalog/Filipino 1%
Political lean MEDSL · Escambia
- 2024 margin
- R (+19.5) · D 39.7% · R 59.2% · Other 1.1%
- 2008→2024 swing
- -0.2pp no change · 2008: -19.3pp · 2024: -19.5pp
- All cycles
- 2024: R+19.5 2020: R+15.1 2016: R+20.6 2012: R+20.6 2008: R+19.3
Not yet ingested
- Civics
- —
Market trends
- HPI YoY
- ▼ -300.02%
- Current HPI
- 294.4873
- Rent YoY
- ▲ 3.39%
- Metro
- Pensacola-Ferry Pass-Brent, FL
- State GDP YoY
- ▲ 3.28%
- F500 in state
- 36
Industry mix (Fortune 500 HQ in FL)
| Industry | F500 HQs | Revenue |
|---|---|---|
| Industrial Technology | 2 | $29B |
|
||
| Insurance | 2 | $17B |
|
||
| Retail | 1 | $60B |
|
||
| Technology Distribution | 1 | $58B |
|
||
| Homebuilding | 1 | $35B |
|
||
| Technology Manufacturing | 1 | $35B |
|
||
Price history
+722.6% since first listed11 events — show timeline
- 2026-04-13 Pending — PARMLS
- 2026-03-26 Contingent — PARMLS
- 2026-03-20 Relisted — PARMLS
- 2026-03-17 Contingent — PARMLS
- 2026-01-22 Price Changed $229,500 PARMLS
- 2025-10-31 Price Changed $249,900 PARMLS
- 2025-05-15 Listed $269,900 PARMLS
- 1999-08-18 Sold (Public Records) $89,500 Public Records
- 1973-01-01 Sold (Public Records) $33,200 Public Records
- 1972-01-01 Sold (Public Records) $32,400 Public Records
- 1971-01-01 Sold (Public Records) $27,900 Public Records
Property tax history
+17.0%/yrLatest (2025): $3,182 · +413.7% YoY. Source: county tax records.
Cash-flow waterfall
monthlySold comps — $/sqft
last 12 mo · ≤1 miLoading sold comps…