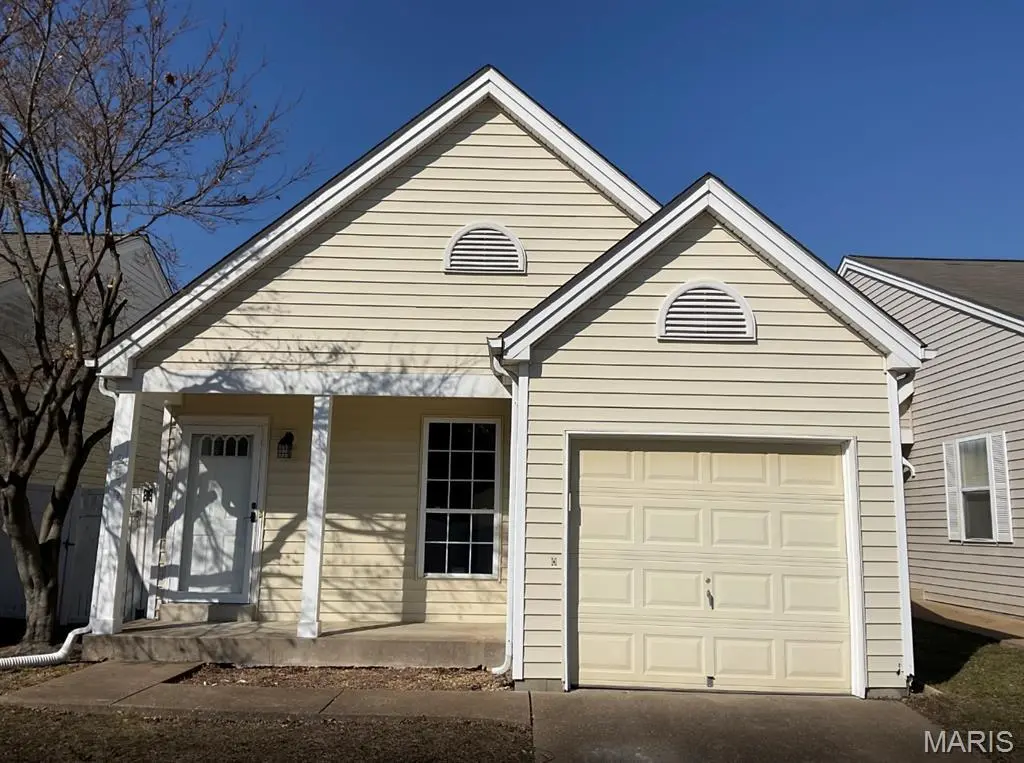
2659 Liberty Gardens Dr · Florissant, MO
Flood risk 1/10 · Minimal
- FEMA flood zone
- X (unshaded)
- Chance of flooding over 30 yrs
- 0.0%
- Est. flood insurance / yr
- $473 – $860
Fire risk 1/10 · Minimal
- Est. fire insurance / yr
- $1,054 – $1,958
Heat risk 5/10 · Moderate
- Hot days now (above 106°F)
- 7 days/yr
- Hot days in 30 yrs
- 21 days/yr
Wind risk 2/10 · Minimal
- Chance of severe wind over 30 yrs
- 1.0%
Air-quality risk 3/10 · Minor
- Unhealthy air days now
- 3 days/yr
- Unhealthy air days in 30 yrs
- 5 days/yr
Risk factors via First Street. Map © Google.
Why this score? — see what drove the D grade
The composite is a weighted blend of 9 inputs, each scored 0–100. Each bar is that input's sub-score; the figure is the points it added to the 100-point composite (weight × sub-score).
- Cash flow +13.7/30.0
- ARV discount +7.9/15.0
- DSCR +4.1/10.0
- 1% rule +3.7/10.0
- Livability +3.7/5.0
- Rent growth +3.6/5.0
- Condition / age +2.5/5.0
- Schools +1.7/10.0
- Appreciation +0.0/10.0
$166,000
🖨 Deal sheet 📄 Offer letter ✓ Due diligence
Listing remarks MLS
Honey, stop the car!!! Welcome home to this charming 2-bedroom, 3-bath ranch in Florissant. This home features an open floor plan with vaulted ceilings in the main living area and high ceilings throughout, creating a comfortable living space and ample room for entertaining. The main-floor laundry room is conveniently located near the bedrooms, and the primary suite includes a private ensuite bathroom and bay windows overlooking the fully fenced backyard. The kitchen is equipped with stainless steel appliances, a pantry for extra storage, and a breakfast bar perfect for casual dining or gathering with guests. Step outside to enjoy the fenced backyard and patio—ideal for relaxing or entertaining on warm days. Perfect starter home, or for those looking to downsize! Schedule your showing today to see all this home has to offer!
Key facts
- 3,484 sq ft lot
- Garage
- Built 1993
Neighborhood map
What this means for you Summary
Snapshot
- This is a 2-bed/2.0-bath single-family listed at $166k.
Deal economics
- At list price, monthly cash flow is $12 ($147/yr) — positive.
- The deal already cash-flows at list — no discount required.
- To meet the 1% rule (rent ≥ 1% of price), the offer needs to be $145k (12.6% below list).
- Recommended offer: $145k (12.6% below list) — sets the bar for 1% rule.
Location & tenants
- Location reads 73/100 on livability (#82 in MO) — a middle-class / working-renter tenant base. Strengths: cost of living A+, housing A+, health & safety B+; Watch: crime C-, amenities D+, schools D.
- Hazelwood (suburban): math 11% / reading 26% proficiency, ranked #306 of 324 in MO (top 94%) — low school quality limits family demand, transient renter base, plan for 1-2y turnover.
- Market conditions: Rents rising fast (+4.3%/yr); 271 active listings in the ZIP; 19 comparable units currently listed for rent nearby; rentals leasing fast (median 7d on market — plan ~1-2 weeks tenant-placement turnaround); 920 units permitted in St. Louis County in 2024 (250 in 5+ unit buildings).
Forward outlook
- Local home prices are declining (-3.0%/yr); year-one equity from $1k of loan paydown is wiped out by about $5k of value loss. Plan a longer hold.
Negotiation context
- It's been on market 93 days — a 9% lower offer ($151k) is reasonable based on typical stale-listing flexibility.
- Current owner paid $95k; list at $166k implies a 75% gain — meaningful room to come down on a strong offer.
Risks & watch-outs
- Climate carrying-cost: extreme-heat days projected 7→21/yr by 2055 (HVAC capex compounding) — expect insurance premiums to compound above CPI over the hold.
Questions for the listing agent
- It's been on market 93 days. Have you received any prior offers? Is the seller open to a 13% concession, seller financing, or rate buy-down credit?
- What does the HOA fee cover, when was the last increase, and are there any pending special assessments or reserve-fund shortfalls?
- Why hasn't it sold? Are there any deal-killer items the seller is aware of (foundation, flood, title, zoning, code violations)?
- Is there a deadline driving the sale (1031 exchange, divorce, estate, relocation)? That informs how much negotiation room exists.
- Schools are D-rated, which usually means shorter tenancies and higher turnover. Who's the typical renter profile here, and what's been the actual vacancy rate?
- The area grade is low — what's the realistic commute time and amenity access for the typical tenant pool here? Any planned neighborhood developments (good or bad) we should know about?
- What's the average days-on-market for RENTAL listings here right now (not sales)? A rising rental-DOM trend means longer vacancies and softer asking-rent achievability than the comps imply.
- What's the recent tenant-quality profile in this submarket — average credit score on applications, eviction rate, late-payment / NSF rate, and stable-employment percentage? A property-management company in the area should have these aggregated.
- How much new for-sale + rental construction is in the pipeline within 1–3 miles? Heavy new supply typically softens prices + rents 12–24 months out; constrained supply supports both.
Investment metrics
- 1% rule
- 0.87% ✗
- Cap rate
- 6.38%
- Cash-on-cash
- 0.32%
- DSCR
- 1.01
- GRM
- 9.5
CMA / ARV
- ARV (median comp)
- $167,429
- List price
- $166,000
- Delta
- -0.85%
- Verdict
- FAIR
- Comps
- 20 within 1.0 mi
Show comp detail 12 sales within ~0.75 mi
| Address | Dist | Beds/Ba | Sqft | Sold | Price | $/sf | Match |
|---|---|---|---|---|---|---|---|
| 2565 Morningside Dr | 0.42mi | 3/2.5 (+1) | 925 (+3%) | 5mo | $150,000 | $162 | 64 |
| 1577 Boardwalk Ave | 0.42mi | 3/1.5 (+1) | 962 (+7%) | 4mo | $179,900 | $187 | 58 |
| 3175 Chicory Creek Ln | 0.50mi | 2/1.0 | 837 (-7%) | 5mo | $139,900 | $167 | 57 |
| 733 Mediterranean Dr | 0.51mi | 3/1.0 (+1) | 950 (+6%) | 3mo | $219,900 | $231 | 55 |
| 3035 Matlock Dr | 0.56mi | 3/2.0 (+1) | 950 (+6%) | 6mo | $182,000 | $192 | 54 |
| 2465 Grants Pkwy | 0.45mi | 3/2.0 (+1) | 995 (+11%) | 2mo | $129,900 | $131 | 54 |
| 1398 Brenthaven Ln | 0.36mi | 3/2.0 (+1) | 1,025 (+14%) | 1mo | $185,000 | $180 | 53 |
| 680 Central Pkwy | 0.65mi | 3/1.5 (+1) | 936 (+4%) | 3mo | $99,900 | $107 | 53 |
| 500 Jana Dr | 0.65mi | 3/1.5 (+1) | 973 (+9%) | 6mo | $179,900 | $185 | 43 |
| 2328 Urbandale Dr | 0.64mi | 3/2.0 (+1) | 1,025 (+14%) | 1mo | $140,400 | $137 | 40 |
| 2295 Love Ln | 0.66mi | 3/1.5 (+1) | 1,025 (+14%) | 4mo | $30,000 | $29 | 35 |
| 670 Starlet Dr | 0.69mi | 3/1.0 (+1) | 1,025 (+14%) | 3mo | $185,000 | $180 | 33 |
Match score weights: distance 35% · size 25% · config 20% · recency 20%. Top-matched comps best support the ARV.
Projected returns pro-forma
-3.0% appreciation · 4.27% rent growth · sell at horizon
- IRR
- -14.4%
- Equity multiple
- 0.48×
- Total profit
- $-24,230
- Equity at exit
- $24,751
- IRR
- -3.7%
- Equity multiple
- 0.74×
- Total profit
- $-12,136
- Equity at exit
- $14,353
Cash invested: $46,480 (down + closing). Projections, not guarantees.
Landlord ↔ Tenant lean methodology
- Overall (STATE)
- 81 Strongly Landlord-Friendly
- State Missouri
- 81 Strongly Landlord-Friendly · R+10
- County
- — inherits STATE
- City
- — inherits STATE
ZIP-level market 63031
- Rents YoY
- 4.3%
- Active inventory
- 271
- Price-to-rent
- 9.5×
Monthly cashflow live
- Estimated rent
- $1,451 high interval (Pro) →
- Mortgage (P&I)
- −$871
- Tax from tax record
- −$162 /mo · $1,946/yr
- Insurance
- −$69
- HOA
- −$32
- Vacancy / Maint / Mgmt
- −$305
- Net cashflow
- $12
Break-even live
UW: 25.0% down · 7.5% · 30yr · 1.5% tax · 5.0% vac · 8.0% maint · 8.0% mgmt
Financing live
Cash to close
- Down payment
- $41,500
- Closing costs
- $4,980
- Reserves months
- —
- Total cash needed
- —
Loan-product check · same deal, 3 products live
Conventional
25% down · 7.5% · 30yr
- Down + closing
- —
- Monthly P&I
- —
- Monthly cashflow
- —
- DSCR
- —
- Eligible?
- —
Personal DTI + credit; lowest rate.
DSCR
20% down · 8.5% · 30yr
- Down + closing
- —
- Monthly P&I
- —
- Monthly cashflow
- —
- DSCR
- —
- Eligible?
- —
No personal income docs; deal must DSCR.
Hard money
10% down · 12.0% · 12mo
- Down + closing
- —
- Monthly P&I
- —
- Monthly cashflow
- —
- DSCR
- —
- Eligible?
- —
Short-term bridge; refi at stabilization.
Rent comps 19 comps
| Address | Beds | Baths | Sqft | Rent | $/sqft | DOM | Units | Dist |
|---|---|---|---|---|---|---|---|---|
| 2857 Dawnview Dr Florissant, MO | 3.0 | 1.0 | 890 | $1,325 | $1.49 | 7d | 1 | 0.12mi |
| 840 Dawnview Ct Florissant, MO | 3.0 | 1.5 | 750 | $900 | $1.20 | 23d | 1 | 0.27mi |
| 2942 Chance Dr Florissant, MO | 3.0 | 1.0 | 912 | $1,700 | $1.86 | 12d | 1 | 0.33mi |
| 775 Sherwood Dr Florissant, MO | 3.0 | 1.0 | 1023 | $1,690 | $1.65 | 43d | 1 | 0.37mi |
| 3015 Matlock Dr Florissant, MO | 3.0 | 1.0 | 950 | $1,475 | $1.55 | 43d | 1 | 0.55mi |
| 2160 Splendor Dr Florissant, MO | 3.0 | 2.0 | 1100 | $1,800 | $1.64 | 2d | 1 | 0.76mi |
| 1332 Langholm Dr Florissant, MO | 3.0 | 1.0 | 924 | $1,650 | $1.79 | 1d | 1 | 0.78mi |
| 1095 Humes Ln Florissant, MO | 3.0 | 1.5 | 1100 | $1,650 | $1.50 | 4d | 1 | 0.80mi |
| 330 Moule Dr Florissant, MO | 3.0 | 1.0 | 1014 | $1,575 | $1.55 | 43d | 1 | 0.94mi |
| 1902 High Sun Dr Unit 1 Florissant, MO | 1.0 | 1.0 | 795 | $1,035 | $1.30 | 17d | 1 | 1.00mi |
| 1983 Greenheath Dr Florissant, MO | 3.0 | 2.0 | 1040 | $1,331 | $1.28 | 2d | 1 | 1.01mi |
| 1545 Swan Dr Florissant, MO | 3.0 | 1.0 | 1064 | $1,590 | $1.49 | 7d | 1 | 1.26mi |
| 1540 Aspen Dr Florissant, MO | 3.0 | 2.0 | 912 | $1,395 | $1.53 | 7d | 1 | 1.29mi |
| 1315 Bobolink Dr Florissant, MO | 3.0 | 2.0 | 1025 | $1,700 | $1.66 | 12d | 1 | 1.29mi |
| 470 Hundley Dr Florissant, MO | 3.0 | 2.0 | 962 | $1,595 | $1.66 | 43d | 1 | 1.32mi |
| 855 Daniel Boone Dr Florissant, MO | 3.0 | 1.0 | 964 | $1,400 | $1.45 | 43d | 1 | 1.32mi |
| 765 Babler Dr Florissant, MO | 3.0 | 2.0 | 888 | $1,700 | $1.91 | 7d | 1 | 1.40mi |
| 1710 Kay Dr Florissant, MO | 3.0 | 1.0 | 960 | $1,500 | $1.56 | 1d | 1 | 1.40mi |
| 4 Sharon Ct Florissant, MO | 3.0 | 2.0 | 1108 | $1,800 | $1.62 | 2d | 1 | 1.49mi |
HOA detail
- Monthly dues
- $32 · $384/yr
Listing history 22 events
-
2026-06-18days on market $166,000 Active 93 DOM
-
2026-06-17days on market $166,000 Active 92 DOM
-
2026-06-16days on market $166,000 Active 91 DOM
-
2026-06-15days on market $166,000 Active 90 DOM
-
2026-06-13days on market $166,000 Active 88 DOM
-
2026-06-13days on market $166,000 Active 87 DOM
-
2026-06-09days on market $166,000 Active 84 DOM
-
2026-06-08days on market $166,000 Active 83 DOM
-
2026-06-07days on market $166,000 Active 82 DOM
-
2026-06-05days on market $166,000 Active 79 DOM
-
2026-06-03days on market $166,000 Active 78 DOM
-
2026-06-02days on market $166,000 Active 77 DOM
-
2026-06-01days on market $166,000 Active 76 DOM
-
2026-05-31days on market $166,000 Active 75 DOM
-
2026-05-18price $166,000 841-char remark
Show marketing remark (841 chars)
Honey, stop the car!!! Welcome home to this charming 2-bedroom, 3-bath ranch in Florissant. This home features an open floor plan with vaulted ceilings in the main living area and high ceilings throughout, creating a comfortable living space and ample room for entertaining. The main-floor laundry room is conveniently located near the bedrooms, and the primary suite includes a private ensuite bathroom and bay windows overlooking the fully fenced backyard. The kitchen is equipped with stainless steel appliances, a pantry for extra storage, and a breakfast bar perfect for casual dining or gathering with guests. Step outside to enjoy the fenced backyard and patio—ideal for relaxing or entertaining on warm days. Perfect starter home, or for those looking to downsize! Schedule your showing today to see all this home has to offer!
-
2026-04-18price $169,000 841-char remark
Show marketing remark (841 chars)
Honey, stop the car!!! Welcome home to this charming 2-bedroom, 3-bath ranch in Florissant. This home features an open floor plan with vaulted ceilings in the main living area and high ceilings throughout, creating a comfortable living space and ample room for entertaining. The main-floor laundry room is conveniently located near the bedrooms, and the primary suite includes a private ensuite bathroom and bay windows overlooking the fully fenced backyard. The kitchen is equipped with stainless steel appliances, a pantry for extra storage, and a breakfast bar perfect for casual dining or gathering with guests. Step outside to enjoy the fenced backyard and patio—ideal for relaxing or entertaining on warm days. Perfect starter home, or for those looking to downsize! Schedule your showing today to see all this home has to offer!
-
2026-04-09price $172,000 841-char remark
Show marketing remark (841 chars)
Honey, stop the car!!! Welcome home to this charming 2-bedroom, 3-bath ranch in Florissant. This home features an open floor plan with vaulted ceilings in the main living area and high ceilings throughout, creating a comfortable living space and ample room for entertaining. The main-floor laundry room is conveniently located near the bedrooms, and the primary suite includes a private ensuite bathroom and bay windows overlooking the fully fenced backyard. The kitchen is equipped with stainless steel appliances, a pantry for extra storage, and a breakfast bar perfect for casual dining or gathering with guests. Step outside to enjoy the fenced backyard and patio—ideal for relaxing or entertaining on warm days. Perfect starter home, or for those looking to downsize! Schedule your showing today to see all this home has to offer!
-
2026-03-18$176,000 Active 841-char remark
Show marketing remark (841 chars)
Honey, stop the car!!! Welcome home to this charming 2-bedroom, 3-bath ranch in Florissant. This home features an open floor plan with vaulted ceilings in the main living area and high ceilings throughout, creating a comfortable living space and ample room for entertaining. The main-floor laundry room is conveniently located near the bedrooms, and the primary suite includes a private ensuite bathroom and bay windows overlooking the fully fenced backyard. The kitchen is equipped with stainless steel appliances, a pantry for extra storage, and a breakfast bar perfect for casual dining or gathering with guests. Step outside to enjoy the fenced backyard and patio—ideal for relaxing or entertaining on warm days. Perfect starter home, or for those looking to downsize! Schedule your showing today to see all this home has to offer!
-
2026-03-16historical $176,000 841-char remark
Show marketing remark (841 chars)
Honey, stop the car!!! Welcome home to this charming 2-bedroom, 3-bath ranch in Florissant. This home features an open floor plan with vaulted ceilings in the main living area and high ceilings throughout, creating a comfortable living space and ample room for entertaining. The main-floor laundry room is conveniently located near the bedrooms, and the primary suite includes a private ensuite bathroom and bay windows overlooking the fully fenced backyard. The kitchen is equipped with stainless steel appliances, a pantry for extra storage, and a breakfast bar perfect for casual dining or gathering with guests. Step outside to enjoy the fenced backyard and patio—ideal for relaxing or entertaining on warm days. Perfect starter home, or for those looking to downsize! Schedule your showing today to see all this home has to offer!
-
2002-08-12soldstatus $95,000
-
1997-01-10soldstatus $77,300
-
1993-10-15soldstatus
ⓘ Source: listings_history table (triggers on properties + properties_extension) + one-shot
backfill from property_details.listing_events for pre-trigger history.
Tax reassessment forecast MO · Resets to sale price
- Current annual tax
- $1,946 · $162/mo
- Projected year-2 tax
- $1,946 · $162/mo
- Expected delta
- $0/yr ($0/mo · 0.0%)
ⓘ Screening estimate from a state-policy table — verify with the county assessor before closing.
Climate risk First Street
- Flood 1/10 Low FEMA zone X (unshaded) · 0% chance over 30 yrs
- Wildfire 1/10 Low
- Heat 5/10 Major 7 d/yr ≥106°F today · 21 d/yr by 30 yrs out
- Wind 2/10 Low 100% chance of damaging wind over 30 yrs
- Air quality 3/10 Moderate 3 unhealthy d/yr today · 5 by 30 yrs out
Nearby sold comps map
Loading sold comps map…
Walkable amenities ~0.75 mi
Loading nearby amenities…
Taxation est. · year 1
- Rental income
- $17,409
- − Mortgage interest
- −$9,299
- − Property taxes
- −$1,946
- − Insurance
- −$830
- − Repairs & maintenance
- −$1,393
- − Management
- −$1,393
- − HOA
- −$384
- − Depreciation
- −$4,829
- Taxable loss
- −$2,664
- Est. tax savings @ 24.0%
- +$639
- After-tax cash flow
- $786/yr
For passive investors: Depreciation is non-cash, so a rental often shows a tax loss while cash-flowing — sheltering income. Rental losses are passive: they offset passive income freely, and up to $25,000/yr can offset ordinary (W-2) income if you actively participate and your MAGI is under $100k (phasing out to $0 by $150k); unused losses carry forward. On sale, claimed depreciation is recaptured at up to 25%, and gains may owe capital-gains tax (a 1031 exchange can defer both). Figures are a year-1 estimate at your 24.0% rate — not tax advice; consult a CPA.
Schools (NCES district)
- District
- Hazelwood
- NCES district ID
- 2913830
- Math proficiency
- 11% ▼ -13.00%
- Reading proficiency
- 26% ▼ -6.00%
- Median HH income
- $51,621
- Composite
- 16.77/100
- National rank
- #9156
- State rank
- #306 of 324 in MO
Livability — Florissant
- Score
- 73/100
- State rank
- #82
- US rank
- #5406
Category grades
Schools grade is shown separately in the Schools card above.
Census & demographics
- County
- Saint Louis County · 888,823 people
- City population
- 69,104
- Metro
- St. Louis, MO-IL
- Population (ZIP)
- 50,196
- Household income
- $70,811
- Rent vs Own
- Severe rent burden
- 1279.0
Population outlook (St. Louis County) Hauer SSP2
- Today (2025)
- 1,025,227 people
- By 2030
- 1,028,023 · +0.3%
- By 2040
- 1,020,940 · -0.4%
- By 2050
- 1,007,280 · -1.8%
- By 2075
- 987,277 · -3.7%
- By 2100
- 921,984 · -10.1%
Race, ethnicity, and origin ACS 2023
- Neighborhood character
- Diverse neighborhood (Simpson 0.58)
- Race & ethnicity
- White 49% Black 41% Two or more races 7% Hispanic / Latino 2%
- Common ancestry
- Romanian 3% Lithuanian 3% Swedish 1%
- Foreign-born
- 5% · Canada, Jamaica
- Languages at home
- 94% English-only · Spanish 2% Arabic 1%
Political lean MEDSL · St. Louis
- 2024 margin
- Strong D (+23.4) · D 60.8% · R 37.4% · Other 1.7%
- 2008→2024 swing
- +3.5pp toward D · 2008: 19.9pp · 2024: 23.4pp
- All cycles
- 2024: D+23.4 2020: D+24.0 2016: D+16.2 2012: D+13.7 2008: D+19.9
Not yet ingested
- Civics
- —
Market trends
- HPI YoY
- ▼ -223.57%
- Current HPI
- 202.7192
- Rent YoY
- ▲ 4.27%
- Metro
- St. Louis, MO-IL
- State GDP YoY
- ▲ 1.84%
- F500 in state
- 20
Industry mix (Fortune 500 HQ in MO)
| Industry | F500 HQs | Revenue |
|---|---|---|
| Healthcare | 1 | $163B |
|
||
| Insurance | 1 | $21B |
|
||
| Industrial Technology | 1 | $17B |
|
||
| Retail | 1 | $16B |
|
||
| Industrial Distribution | 1 | $10B |
|
||
| Utilities | 1 | $9B |
|
||
Price history
+114.7% since first listed8 events — show timeline
- 2026-05-18 Price Changed $166,000 MARIS as Distributed by MLS Grid
- 2026-04-18 Price Changed $169,000 MARIS as Distributed by MLS Grid
- 2026-04-09 Price Changed $172,000 MARIS as Distributed by MLS Grid
- 2026-03-18 Listed $176,000 MARIS as Distributed by MLS Grid
- 2026-03-16 Coming Soon $176,000 MARIS as Distributed by MLS Grid
- 2002-08-12 Sold (Public Records) $95,000 Public Records
- 1997-01-10 Sold (Public Records) $77,300 Public Records
- 1993-10-15 Sold (Public Records) — Public Records
Property tax history
+5.1%/yrLatest (2022): $1,946 · +1.4% YoY. Source: county tax records.
Cash-flow waterfall
monthlySold comps — $/sqft
last 12 mo · ≤1 miLoading sold comps…