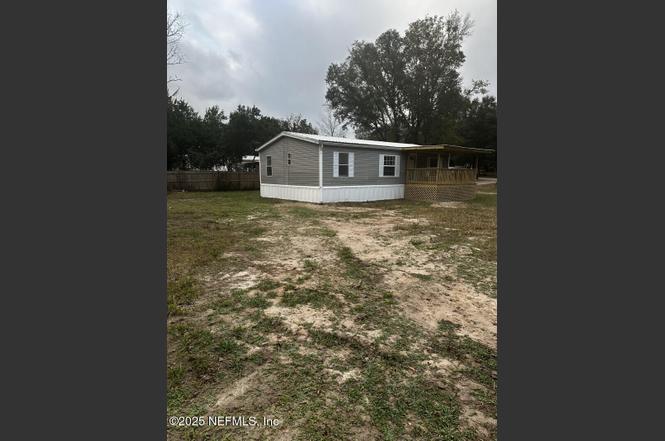
566 Dennis Ave · Lakeside, FL
Flood risk 1/10 · Minimal
- FEMA flood zone
- X (unshaded)
- Chance of flooding over 30 yrs
- 0.0%
- Est. flood insurance / yr
- $507 – $1,088
Fire risk 3/10 · Minor
- Est. fire insurance / yr
- $947 – $1,759
Heat risk 8/10 · Major
- Hot days now (above 107°F)
- 7 days/yr
- Hot days in 30 yrs
- 18 days/yr
Wind risk 9/10 · Severe
- Chance of severe wind over 30 yrs
- 99.0%
Air-quality risk 3/10 · Minor
- Unhealthy air days now
- 3 days/yr
- Unhealthy air days in 30 yrs
- 3 days/yr
Risk factors via First Street. Map © Google.
Why this score? — see what drove the C- grade
The composite is a weighted blend of 9 inputs, each scored 0–100. Each bar is that input's sub-score; the figure is the points it added to the 100-point composite (weight × sub-score).
- Cash flow +19.6/30.0
- ARV discount +7.5/15.0
- DSCR +6.2/10.0
- Schools +5.1/10.0
- 1% rule +4.1/10.0
- Rent growth +3.4/5.0
- Livability +3.4/5.0
- Condition / age +2.5/5.0
- Appreciation +0.0/10.0
$189,000
🖨 Deal sheet 📄 Offer letter ✓ Due diligence
Listing remarks MLS
Nice lot with mobile home. Mobile home has no value. Value is in the land. Package deal is available. Deal can be purchased for $250,000 for the following 4 properties: 565 Dennis Ave, 22-04-25-020825-000-00, 566 Dennis Ave, 22-04-25-020833-001-00, 570 Dennis Ave, 22-04-25-020833-002-00, 853 Fern Ave, 22-04-25-020825-001-00
Key facts
- New metal roof
- Large front porch
- New exterior doors
Tags
Neighborhood map
What this means for you Summary
Snapshot
- This is a 3-bed/2.0-bath manufactured listed at $189k.
Deal economics
- At list price, monthly cash flow is $218 ($3k/yr) — positive.
- The deal already cash-flows at list — no discount required.
- To meet the 1% rule (rent ≥ 1% of price), the offer needs to be $171k (9.4% below list).
- Recommended offer: $171k (9.4% below list) — sets the bar for 1% rule.
- Cap rate 7.7% vs local median 4.7% in Lakeside — top-decile yield for the area; either an underpriced asset or a hidden risk that comps aren't pricing in. Stress-test before assuming the spread holds.
Location & tenants
- Location reads 68/100 on livability (#505 in FL) — a middle-class / working-renter tenant base. Strengths: cost of living A+, housing A+, schools B; Watch: amenities F, commute F, health & safety F.
- Clay (suburban): math 58% / reading 59% proficiency, ranked #14 of 73 in FL (top 19%) — acceptable for families but not a draw, mixed tenant base, ~2y average lease.
- Market conditions: Rents rising (+3.7%/yr); 217 active listings in the ZIP; 14 comparable units currently listed for rent nearby; rentals at typical pace (median 15d on market — plan ~3-4 weeks tenant-placement turnaround); solid renter incomes; 1,876 units permitted in Clay County in 2024 (14 in 5+ unit buildings).
Forward outlook
- Local home prices are declining (-3.0%/yr); year-one equity from $1k of loan paydown is wiped out by about $6k of value loss. Plan a longer hold.
- Clay County population projected at +19% by 2050 — long-run rental-demand tailwind backs the buy-and-hold thesis.
Negotiation context
- It's been on market 96 days — a 9% lower offer ($172k) is reasonable based on typical stale-listing flexibility.
- 2 sale attempts since 4y ago; this cycle's ask has dropped $11k (5%) from the opening price — seller is motivated, your offer sets the floor, not the list.
Risks & watch-outs
- Climate carrying-cost: severe wind risk, 99% chance of damaging wind over 30y; extreme-heat days projected 7→18/yr by 2055 (HVAC capex compounding) — expect insurance premiums to compound above CPI over the hold.
Questions for the listing agent
- It's been on market 96 days. Have you received any prior offers? Is the seller open to a 9% concession, seller financing, or rate buy-down credit?
- Why hasn't it sold? Are there any deal-killer items the seller is aware of (foundation, flood, title, zoning, code violations)?
- Is there a deadline driving the sale (1031 exchange, divorce, estate, relocation)? That informs how much negotiation room exists.
- Schools are B-rated — typically a magnet for longer-tenancy family renters. What's the average tenant stay here, and is there a school-zone premium baked into asking?
- What's the average days-on-market for RENTAL listings here right now (not sales)? A rising rental-DOM trend means longer vacancies and softer asking-rent achievability than the comps imply.
- What's the recent tenant-quality profile in this submarket — average credit score on applications, eviction rate, late-payment / NSF rate, and stable-employment percentage? A property-management company in the area should have these aggregated.
- How much new for-sale + rental construction is in the pipeline within 1–3 miles? Heavy new supply typically softens prices + rents 12–24 months out; constrained supply supports both.
Investment metrics
- 1% rule
- 0.91% ✗
- Cap rate
- 7.68%
- Cash-on-cash
- 4.95%
- DSCR
- 1.22
- GRM
- 9.2
CMA / ARV
No comps found within radius.
Projected returns pro-forma
-3.0% appreciation · 3.73% rent growth · sell at horizon
- IRR
- -7.9%
- Equity multiple
- 0.71×
- Total profit
- $-15,548
- Equity at exit
- $28,181
- IRR
- 2.4%
- Equity multiple
- 1.18×
- Total profit
- $9,302
- Equity at exit
- $16,341
Cash invested: $52,920 (down + closing). Projections, not guarantees.
Landlord ↔ Tenant lean methodology
- Overall (STATE)
- 87 Strongly Landlord-Friendly
- State Florida
- 87 Strongly Landlord-Friendly · R+3
- County
- — inherits STATE
- City
- — inherits STATE
ZIP-level market 32065
- Home prices YoY
- -25.6%
- Rents YoY
- 3.7%
- Active inventory
- 217
- Price-to-rent
- 9.2×
Monthly cashflow live
- Estimated rent
- $1,712 high interval (Pro) →
- Mortgage (P&I)
- −$991
- Tax from tax record
- −$65 /mo · $778/yr
- Insurance
- −$79
- HOA
- −$0
- Vacancy / Maint / Mgmt
- −$360
- Net cashflow
- $218
Break-even live
UW: 25.0% down · 7.5% · 30yr · 1.5% tax · 5.0% vac · 8.0% maint · 8.0% mgmt
Financing live
Cash to close
- Down payment
- $47,250
- Closing costs
- $5,670
- Reserves months
- —
- Total cash needed
- —
Loan-product check · same deal, 3 products live
Conventional
25% down · 7.5% · 30yr
- Down + closing
- —
- Monthly P&I
- —
- Monthly cashflow
- —
- DSCR
- —
- Eligible?
- —
Personal DTI + credit; lowest rate.
DSCR
20% down · 8.5% · 30yr
- Down + closing
- —
- Monthly P&I
- —
- Monthly cashflow
- —
- DSCR
- —
- Eligible?
- —
No personal income docs; deal must DSCR.
Hard money
10% down · 12.0% · 12mo
- Down + closing
- —
- Monthly P&I
- —
- Monthly cashflow
- —
- DSCR
- —
- Eligible?
- —
Short-term bridge; refi at stabilization.
Rent comps 14 comps
| Address | Beds | Baths | Sqft | Rent | $/sqft | DOM | Units | Dist |
|---|---|---|---|---|---|---|---|---|
| 1255 Tahoe Ct Orange Park, FL | 3.0 | 2.0 | 1305 | $1,916 | $1.47 | 7d | 1 | 0.49mi |
| 409 Jefferson Ave Orange Park, FL | 1.0–2.0 | 1.0–2.0 | 720 | $1,370 | $1.90 | 2d | 2 | 0.78mi |
| 1270 Ticonderoga Trl Unit C Orange Park, FL | 2.0 | 2.0 | 922 | $1,300 | $1.41 | 23d | 1 | 1.12mi |
| 1281 Independence Dr Orange Park, FL | 3.0 | 2.0 | 1087 | $1,695 | $1.56 | 23d | 1 | 1.12mi |
| 1324 Jefferson Ave Orange Park, FL | 2.0 | 2.0 | 926 | $1,245 | $1.34 | 23d | 1 | 1.15mi |
| 1324 Jefferson Ave Orange Park, FL | 2.0 | 2.0 | 922 | $1,245 | $1.35 | 2d | 1 | 1.15mi |
| 1330 Jefferson Ave Orange Park, FL | 2.0 | 2.0 | 922 | $1,250 | $1.36 | 16d | 1 | 1.17mi |
| 1248 Ticonderoga Trl Unit C Orange Park, FL | 2.0 | 2.0 | 922 | $1,195 | $1.30 | 7d | 1 | 1.19mi |
| 1333 Jefferson Ave Unit D Orange Park, FL | 2.0 | 2.0 | 922 | $1,325 | $1.44 | 23d | 1 | 1.21mi |
| 25 Knight Boxx Rd Orange Park, FL | 1.0–3.0 | 1.0–2.0 | 1109 | $1,863 | $1.68 | 2d | 18 | 1.28mi |
| 2804 Canyon Ct Orange Park, FL | 3.0 | 2.0 | 1367 | $1,824 | $1.33 | 14d | 1 | 1.31mi |
| 2897 Gatling Blvd Orange Park, FL | 3.0 | 2.0 | 1338 | $1,650 | $1.23 | 7d | 1 | 1.37mi |
| 49 College Dr Orange Park, FL | 2.0 | 2.0 | 784 | $1,150 | $1.47 | 7d | 8 | 1.42mi |
| 1504 Pawnee St Orange Park, FL | 3.0 | 2.0 | 1338 | $1,795 | $1.34 | 20d | 1 | 1.43mi |
Listing history 8 events
-
2026-03-16status Pending
-
2025-12-29price $189,000
-
2025-12-10$199,900 Active
-
2022-08-02soldstatus $240,000
-
2022-07-28soldstatus $60,000 Sold 330-char remark
Show marketing remark (330 chars)
Nice lot with mobile home. Mobile home has no value. Value is in the land. Package deal is available. Deal can be purchased for $250,000 for the following 4 properties: 565 Dennis Ave, 22-04-25-020825-000-00, 566 Dennis Ave, 22-04-25-020833-001-00, 570 Dennis Ave, 22-04-25-020833-002-00, 853 Fern Ave, 22-04-25-020825-001-00
-
2022-05-15status Pending 330-char remark
Show marketing remark (330 chars)
Nice lot with mobile home. Mobile home has no value. Value is in the land. Package deal is available. Deal can be purchased for $250,000 for the following 4 properties: 565 Dennis Ave, 22-04-25-020825-000-00, 566 Dennis Ave, 22-04-25-020833-001-00, 570 Dennis Ave, 22-04-25-020833-002-00, 853 Fern Ave, 22-04-25-020825-001-00
-
2022-05-06historical Active - Contingent 330-char remark
Show marketing remark (330 chars)
Nice lot with mobile home. Mobile home has no value. Value is in the land. Package deal is available. Deal can be purchased for $250,000 for the following 4 properties: 565 Dennis Ave, 22-04-25-020825-000-00, 566 Dennis Ave, 22-04-25-020833-001-00, 570 Dennis Ave, 22-04-25-020833-002-00, 853 Fern Ave, 22-04-25-020825-001-00
-
2022-03-16$60,000 Active 330-char remark
Show marketing remark (330 chars)
Nice lot with mobile home. Mobile home has no value. Value is in the land. Package deal is available. Deal can be purchased for $250,000 for the following 4 properties: 565 Dennis Ave, 22-04-25-020825-000-00, 566 Dennis Ave, 22-04-25-020833-001-00, 570 Dennis Ave, 22-04-25-020833-002-00, 853 Fern Ave, 22-04-25-020825-001-00
ⓘ Source: listings_history table (triggers on properties + properties_extension) + one-shot
backfill from property_details.listing_events for pre-trigger history.
Tax reassessment forecast FL · Resets to sale price
- Current annual tax
- $778 · $65/mo
- Projected year-2 tax
- $1,569 · $131/mo
- Expected delta
- +$791/yr (+$66/mo · 101.7%)
ⓘ Screening estimate from a state-policy table — verify with the county assessor before closing.
Climate risk First Street
- Flood 1/10 Low FEMA zone X (unshaded) · 0% chance over 30 yrs
- Wildfire 3/10 Moderate
- Heat 8/10 Severe 7 d/yr ≥107°F today · 18 d/yr by 30 yrs out
- Wind 9/10 Extreme 99% chance of damaging wind over 30 yrs
- Air quality 3/10 Moderate 3 unhealthy d/yr today · 3 by 30 yrs out
Nearby sold comps map
Loading sold comps map…
Walkable amenities ~0.75 mi
Loading nearby amenities…
Taxation est. · year 1
- Rental income
- $20,549
- − Mortgage interest
- −$10,587
- − Property taxes
- −$778
- − Insurance
- −$945
- − Repairs & maintenance
- −$1,644
- − Management
- −$1,644
- − Depreciation
- −$5,498
- Taxable loss
- −$547
- Est. tax savings @ 24.0%
- +$131
- After-tax cash flow
- $2,748/yr
For passive investors: Depreciation is non-cash, so a rental often shows a tax loss while cash-flowing — sheltering income. Rental losses are passive: they offset passive income freely, and up to $25,000/yr can offset ordinary (W-2) income if you actively participate and your MAGI is under $100k (phasing out to $0 by $150k); unused losses carry forward. On sale, claimed depreciation is recaptured at up to 25%, and gains may owe capital-gains tax (a 1031 exchange can defer both). Figures are a year-1 estimate at your 24.0% rate — not tax advice; consult a CPA.
Schools (NCES district)
- District
- Clay
- NCES district ID
- 1200300
- Math proficiency
- 58% ▼ -8.00%
- Reading proficiency
- 59% ▼ -3.00%
- Median HH income
- $59,379
- Composite
- 50.73/100
- National rank
- #1815
- State rank
- #14 of 73 in FL
Livability — Lakeside
- Score
- 68/100
- State rank
- #505
- US rank
- #9341
Category grades
Schools grade is shown separately in the Schools card above.
Census & demographics
- Census place
- Lakeside, FL
- County
- Clay County · 208,450 people
- Metro
- Jacksonville, FL
- Population (ZIP)
- 41,578
- Household income
- $97,455
- Rent vs Own
- Severe rent burden
- 1129.0
Population outlook (Clay County) Hauer SSP2
- Today (2025)
- 230,495 people
- By 2030
- 242,427 · +5.2%
- By 2040
- 262,244 · +13.8%
- By 2050
- 275,148 · +19.4%
- By 2075
- 295,397 · +28.2%
- By 2100
- 287,592 · +24.8%
Race, ethnicity, and origin ACS 2023
- Neighborhood character
- Diverse neighborhood (Simpson 0.67)
- Race & ethnicity
- White 51% Black 20% Hispanic / Latino 15% Two or more races 15% Asian 6%
- Hispanic origin (detail)
- Mexican 3% Puerto Rican 5% Cuban 3%
- Common ancestry
- Lithuanian 4% Romanian 2% Portuguese 2%
- Foreign-born
- 8% · Canada, China
- Languages at home
- 88% English-only · Spanish 7% Tagalog/Filipino 3% Other Asian/Pacific 1%
Political lean MEDSL · Clay
- 2024 margin
- Solid R (+39.3) · D 29.9% · R 69.2%
- 2008→2024 swing
- +3.6pp toward D · 2008: -42.8pp · 2024: -39.3pp
- All cycles
- 2024: R+39.3 2020: R+37.1 2016: R+44.3 2012: R+45.8 2008: R+42.8
Not yet ingested
- Civics
- —
Market trends
- HPI YoY
- ▼ -95.13%
- Current HPI
- 276.5987
- Rent YoY
- ▲ 3.73%
- Metro
- Jacksonville, FL
- State GDP YoY
- ▲ 3.28%
- F500 in state
- 36
Industry mix (Fortune 500 HQ in FL)
| Industry | F500 HQs | Revenue |
|---|---|---|
| Industrial Technology | 2 | $29B |
|
||
| Insurance | 2 | $17B |
|
||
| Retail | 1 | $60B |
|
||
| Technology Distribution | 1 | $58B |
|
||
| Homebuilding | 1 | $35B |
|
||
| Technology Manufacturing | 1 | $35B |
|
||
Price history
+215.0% since first listed8 events — show timeline
- 2026-03-16 Pending — realMLS
- 2025-12-29 Price Changed $189,000 realMLS
- 2025-12-10 Listed $199,900 realMLS
- 2022-08-02 Sold (Public Records) $240,000 Public Records
- 2022-07-28 Sold (MLS) $60,000 realMLS
- 2022-05-15 Pending — realMLS
- 2022-05-06 Contingent — realMLS
- 2022-03-16 Listed $60,000 realMLS
Property tax history
+2.7%/yrLatest (2025): $778 · +1.6% YoY. Source: county tax records.
Cash-flow waterfall
monthlySold comps — $/sqft
last 12 mo · ≤1 miLoading sold comps…