 🌊 Lakefront
4711 Walnut Rd Lot G11 · Buckeye Lake, OH
Flood risk 5/10 · Moderate
- FEMA flood zone
- X (shaded)
- Chance of flooding over 30 yrs
- 0.47%
- Est. flood insurance / yr
- $473 – $860
Fire risk 1/10 · Minimal
- Est. fire insurance / yr
- $713 – $1,323
Heat risk 3/10 · Minor
- Hot days now (above 98°F)
- 7 days/yr
- Hot days in 30 yrs
- 18 days/yr
Wind risk 2/10 · Minimal
- Chance of severe wind over 30 yrs
- 1.0%
Air-quality risk 2/10 · Minimal
- Unhealthy air days now
- 0 days/yr
- Unhealthy air days in 30 yrs
- 1 days/yr
Risk factors via First Street. Map © Google.
Why this score? — see what drove the B+ grade
The composite is a weighted blend of 9 inputs, each scored 0–100. Each bar is that input's sub-score; the figure is the points it added to the 100-point composite (weight × sub-score).
- Cash flow +30.0/30.0
- 1% rule +10.0/10.0
- DSCR +10.0/10.0
- ARV discount +7.5/15.0
- Appreciation +7.1/10.0
- Schools +4.0/10.0
- Livability +3.3/5.0
- Rent growth +2.5/5.0
- Condition / age +2.5/5.0
$62,000
🖨 Deal sheet 📄 Offer letter ✓ Due diligence
Listing remarks MLS
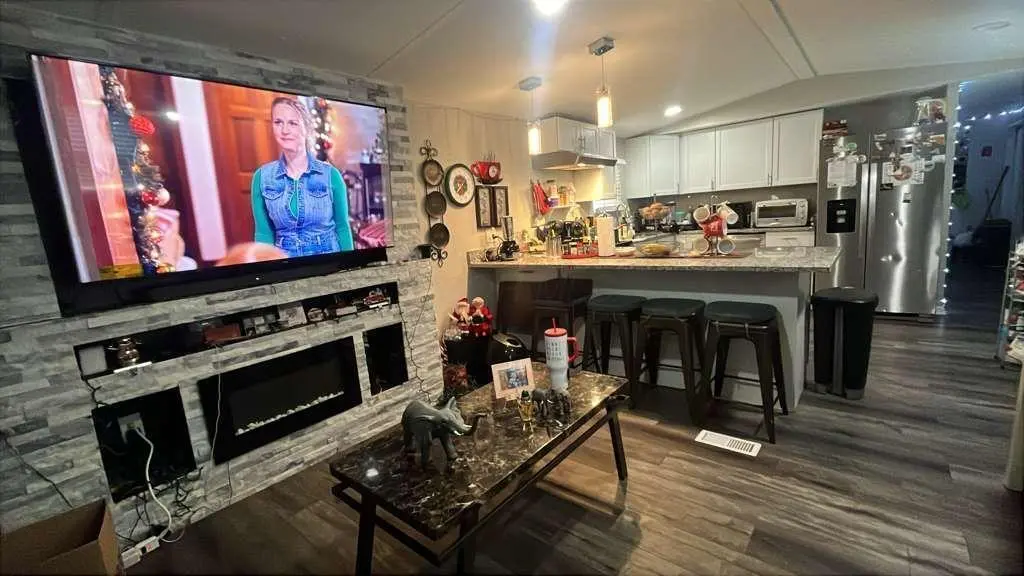
Welcome to LAKE LIFE!! This cozy manufactured home has been completely remodeled in 2024. This unit has 3 bed and 2 full bathrooms. The main bedroom has its own private bathroom. Nothing to do but to move in. Also, the rehab is amazing and the Seller did not skimp on materials chosen or the design of the home. The kitchen countertops are finished with granite, the fireplace has a stone facade. You have to come and check this out for yourself.
Key facts
- Completely remodeled
- Private bathroom
- Granite countertops
Tags
Neighborhood map
What this means for you Summary
Snapshot
- This is a 3-bed/2.0-bath manufactured listed at $62k.
Deal economics
- At list price, monthly cash flow is $780 ($9k/yr) — positive.
- The deal already cash-flows at list — no discount required.
- Meets the 1% rule at list price ($2k rent vs $62k).
- Recommended offer: $58k (6.0% below list) — sets the bar for market timing.
- Cap rate 21.4% vs local median 1.1% in Buckeye Lake — top-decile yield for the area; either an underpriced asset or a hidden risk that comps aren't pricing in. Stress-test before assuming the spread holds.
Location & tenants
- Location reads 66/100 on livability (#671 in OH) — a middle-class / working-renter tenant base. Strengths: crime A+, cost of living A+, housing A+; Watch: employment C-, schools F, amenities F.
- Lakewood Local (rural): math 44% / reading 49% proficiency, ranked #481 of 656 in OH (top 73%) — families likely to look elsewhere, expect single-tenant / working-renter base with shorter leases.
- Market conditions: 31 active listings in the ZIP; 2 comparable units currently listed for rent nearby; solid renter incomes; 159 units permitted in Licking County in 2024 (0 in 5+ unit buildings).
- This rent runs 30% of the median local income ($83k/yr) — at the standard rent-burdened threshold; future hikes will face affordability resistance.
Forward outlook
- In year one you build about $3k of equity ($429 loan paydown + $3k appreciation (4.1% local appreciation)).
- At projected returns (4.1% appreciation + 3.0% rent growth), your $17k cash investment doubles in ~2 years — after that, you're playing with house money.
Negotiation context
- It's been on market 63 days — a 6% lower offer ($58k) is reasonable based on typical stale-listing flexibility.
Risks & watch-outs
- Watch-outs: HOA is 24% of rent.
- Climate carrying-cost: moderate flood risk — expect insurance premiums to compound above CPI over the hold.
Questions for the listing agent
- It's been on market 63 days. Have you received any prior offers? Is the seller open to a 6% concession, seller financing, or rate buy-down credit?
- What does the HOA fee cover, when was the last increase, and are there any pending special assessments or reserve-fund shortfalls?
- Why hasn't it sold? Are there any deal-killer items the seller is aware of (foundation, flood, title, zoning, code violations)?
- Is there a deadline driving the sale (1031 exchange, divorce, estate, relocation)? That informs how much negotiation room exists.
- Schools are F-rated, which usually means shorter tenancies and higher turnover. Who's the typical renter profile here, and what's been the actual vacancy rate?
- This sits on a lake — are riparian / water-frontage rights deeded with the parcel? Any dock permits, shoreline easements, or HOA water-use restrictions?
- What's the documented flood / surge / shoreline-erosion history here (FEMA AND non-FEMA — e.g., storm surge, creek backup, septic-field saturation)?
- Any water-quality or seasonal algae-bloom issues that affect tenant satisfaction or short-term-rental demand?
- What's the average days-on-market for RENTAL listings here right now (not sales)? A rising rental-DOM trend means longer vacancies and softer asking-rent achievability than the comps imply.
- What's the recent tenant-quality profile in this submarket — average credit score on applications, eviction rate, late-payment / NSF rate, and stable-employment percentage? A property-management company in the area should have these aggregated.
- How much new for-sale + rental construction is in the pipeline within 1–3 miles? Heavy new supply typically softens prices + rents 12–24 months out; constrained supply supports both.
Investment metrics
- 1% rule
- 3.37% ✓
- Cap rate
- 21.39%
- Cash-on-cash
- 53.91%
- DSCR
- 3.40
- GRM
- 2.5
CMA / ARV
- ARV (median comp)
- $147,567
- List price
- $62,000
- Delta
- -57.99%
- Verdict
- UNDERPRICED
- Comps
- 20 within 1.0 mi
Projected returns pro-forma
4.12% appreciation · 3.0% rent growth · sell at horizon
- IRR
- 60.4%
- Equity multiple
- 4.52×
- Total profit
- $61,188
- Equity at exit
- $31,857
- IRR
- 59.0%
- Equity multiple
- 9.31×
- Total profit
- $144,230
- Equity at exit
- $52,443
Cash invested: $17,360 (down + closing). Projections, not guarantees.
Landlord ↔ Tenant lean methodology
- Overall (STATE)
- 73 Landlord-Friendly
- State Ohio
- 73 Landlord-Friendly · R+6
- County
- — inherits STATE
- City
- — inherits STATE
ZIP-level market 43008
- Home prices YoY
- 1.4%
- Active inventory
- 31
- Price-to-rent
- 2.5×
Monthly cashflow live
- Estimated rent
- $2,091 medium interval (Pro) →
- Mortgage (P&I)
- −$325
- Tax from tax record
- −$26 /mo · $314/yr
- Insurance
- −$26
- HOA
- −$495
- Vacancy / Maint / Mgmt
- −$439
- Net cashflow
- $780
Break-even live
UW: 25.0% down · 7.5% · 30yr · 1.5% tax · 5.0% vac · 8.0% maint · 8.0% mgmt
Financing live
Cash to close
- Down payment
- $15,500
- Closing costs
- $1,860
- Reserves months
- —
- Total cash needed
- —
Loan-product check · same deal, 3 products live
Conventional
25% down · 7.5% · 30yr
- Down + closing
- —
- Monthly P&I
- —
- Monthly cashflow
- —
- DSCR
- —
- Eligible?
- —
Personal DTI + credit; lowest rate.
DSCR
20% down · 8.5% · 30yr
- Down + closing
- —
- Monthly P&I
- —
- Monthly cashflow
- —
- DSCR
- —
- Eligible?
- —
No personal income docs; deal must DSCR.
Hard money
10% down · 12.0% · 12mo
- Down + closing
- —
- Monthly P&I
- —
- Monthly cashflow
- —
- DSCR
- —
- Eligible?
- —
Short-term bridge; refi at stabilization.
Rent comps 2 comps
| Address | Beds | Baths | Sqft | Rent | $/sqft | DOM | Units | Dist |
|---|---|---|---|---|---|---|---|---|
| 5118 Walnut Rd Apt B Buckeye Lake, OH | 2.0 | 2.0 | 1040 | $2,000 | $1.92 | 43d | 1 | 0.41mi |
| 4956 Island Dr NE Thornville, OH | 2.0 | 1.0 | 680 | $2,295 | $3.38 | 1d | 1 | 0.75mi |
HOA detail
- Monthly dues
- $495 · $5,940/yr
Listing history 15 events
-
2026-06-18days on market $62,000 Active 63 DOM
-
2026-06-17days on market $62,000 Active 62 DOM
-
2026-06-16days on market $62,000 Active 61 DOM
-
2026-06-15days on market $62,000 Active 60 DOM
-
2026-06-13days on market $62,000 Active 58 DOM
-
2026-06-13days on market $62,000 Active 57 DOM
-
2026-06-09days on market $62,000 Active 54 DOM
-
2026-06-08days on market $62,000 Active 53 DOM
-
2026-06-07days on market $62,000 Active 52 DOM
-
2026-06-05pricedays on market $62,000 Active 49 DOM
-
2026-06-03days on market $65,000 Active 48 DOM
-
2026-06-02days on market $65,000 Active 47 DOM
-
2026-06-01days on market $65,000 Active 46 DOM
-
2026-05-31days on market $65,000 Active 45 DOM
-
2026-04-16$65,000 Active 446-char remark
Show marketing remark (446 chars)
Welcome to LAKE LIFE!! This cozy manufactured home has been completely remodeled in 2024. This unit has 3 bed and 2 full bathrooms. The main bedroom has its own private bathroom. Nothing to do but to move in. Also, the rehab is amazing and the Seller did not skimp on materials chosen or the design of the home. The kitchen countertops are finished with granite, the fireplace has a stone facade. You have to come and check this out for yourself.
ⓘ Source: listings_history table (triggers on properties + properties_extension) + one-shot
backfill from property_details.listing_events for pre-trigger history.
Tax reassessment forecast OH · Partial reset (capped growth)
- Current annual tax
- $314 · $26/mo
- Projected year-2 tax
- $640 · $53/mo
- Expected delta
- +$327/yr (+$27/mo · 104.2%)
ⓘ Screening estimate from a state-policy table — verify with the county assessor before closing.
Climate risk First Street
- Flood 5/10 Major FEMA zone X (shaded) · 47% chance over 30 yrs
- Wildfire 1/10 Low
- Heat 3/10 Moderate 7 d/yr ≥98°F today · 18 d/yr by 30 yrs out
- Wind 2/10 Low 100% chance of damaging wind over 30 yrs
- Air quality 2/10 Low 0 unhealthy d/yr today · 1 by 30 yrs out
Nearby sold comps map
Loading sold comps map…
Walkable amenities ~0.75 mi
Loading nearby amenities…
Taxation est. · year 1
- Rental income
- $25,094
- − Mortgage interest
- −$3,473
- − Property taxes
- −$314
- − Insurance
- −$310
- − Repairs & maintenance
- −$2,008
- − Management
- −$2,008
- − HOA
- −$5,940
- − Depreciation
- −$1,804
- Taxable income
- $9,239
- Est. tax owed @ 24.0%
- −$2,217
- After-tax cash flow
- $7,142/yr
For passive investors: Depreciation is non-cash, so a rental often shows a tax loss while cash-flowing — sheltering income. Rental losses are passive: they offset passive income freely, and up to $25,000/yr can offset ordinary (W-2) income if you actively participate and your MAGI is under $100k (phasing out to $0 by $150k); unused losses carry forward. On sale, claimed depreciation is recaptured at up to 25%, and gains may owe capital-gains tax (a 1031 exchange can defer both). Figures are a year-1 estimate at your 24.0% rate — not tax advice; consult a CPA.
Schools (NCES district)
- District
- Lakewood Local
- NCES district ID
- 3904799
- Math proficiency
- 44% ▼ -15.00%
- Reading proficiency
- 49% ▼ -10.00%
- Median HH income
- $51,143
- Composite
- 39.98/100
- National rank
- #3834
- State rank
- #481 of 656 in OH
Livability — Buckeye Lake
- Score
- 66/100
- State rank
- #671
- US rank
- #11844
Category grades
Schools grade is shown separately in the Schools card above.
Census & demographics
- Census place
- Buckeye Lake, OH
- County
- Licking · 160,960 people
- City population
- 2,419
- Metro
- Columbus, OH
- Population (ZIP)
- 2,419
- Household income
- $82,750
- Rent vs Own
Population outlook (Licking County) Hauer SSP2
- Today (2025)
- 178,210 people
- By 2030
- 180,917 · +1.5%
- By 2040
- 183,885 · +3.2%
- By 2050
- 182,985 · +2.7%
- By 2075
- 178,377 · +0.1%
- By 2100
- 161,075 · -9.6%
Race, ethnicity, and origin ACS 2023
- Neighborhood character
- Predominantly White (91%)
- Race & ethnicity
- White 91% Two or more races 6% Hispanic / Latino 5%
- Hispanic origin (detail)
- Mexican 2%
- Common ancestry
- Italian 6% Iranian 4% Lithuanian 2%
- Foreign-born
- 2% · Canada
- Languages at home
- 98% English-only · Spanish 2%
Political lean MEDSL · Licking
- 2024 margin
- Solid R (+30.0) · D 34.5% · R 64.6%
- 2008→2024 swing
- -14.2pp toward R · 2008: -15.8pp · 2024: -30.0pp
- All cycles
- 2024: R+30.0 2020: R+28.1 2016: R+28.9 2012: R+14.7 2008: R+15.8
Not yet ingested
- Civics
- —
Market trends
- HPI YoY
- ▲ 4.12%
- Current HPI
- 293.8256
- Rent YoY
- —
- Metro
- —
- State GDP YoY
- ▲ 1.98%
- F500 in state
- 48
Industry mix (Fortune 500 HQ in OH)
| Industry | F500 HQs | Revenue |
|---|---|---|
| Insurance | 3 | $145B |
|
||
| Industrial Machinery | 3 | $49B |
|
||
| Financial Services | 3 | $24B |
|
||
| Consumer Goods | 2 | $93B |
|
||
| Aerospace / Defense | 2 | $47B |
|
||
| Utilities | 2 | $33B |
|
||
Price history
1 event — show timeline
- 2026-04-16 Listed $65,000 CBRMLS
Cash-flow waterfall
monthlySold comps — $/sqft
last 12 mo · ≤1 miLoading sold comps…