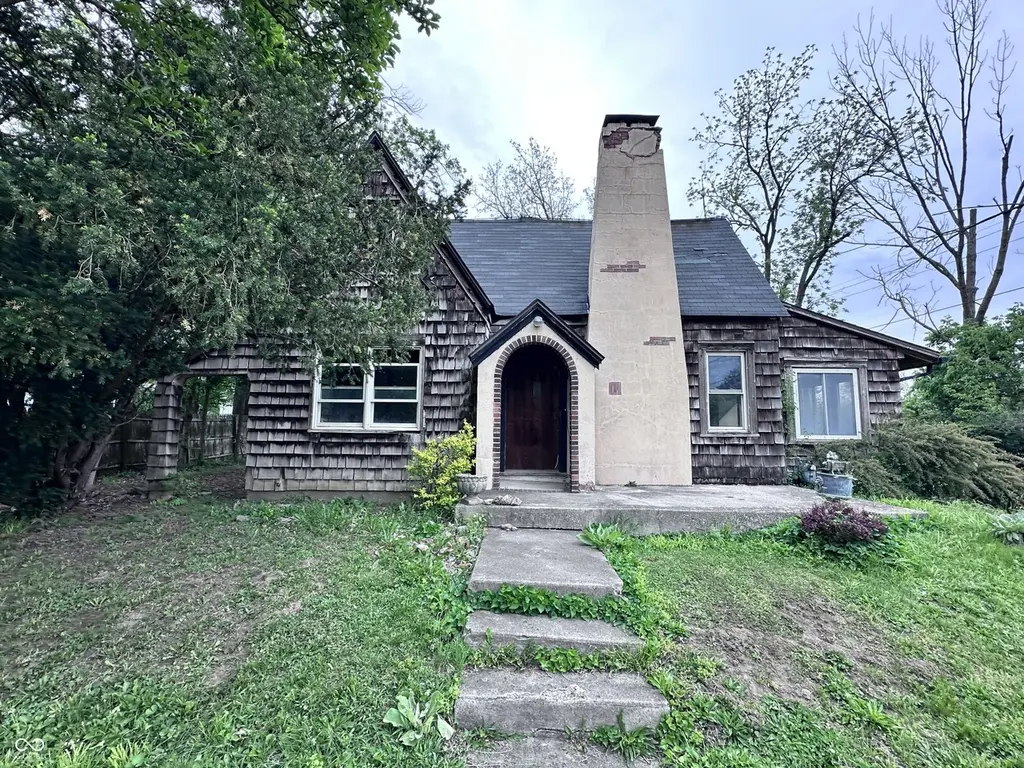
735 E Washington St · Greencastle, IN
Flood risk 1/10 · Minimal
- FEMA flood zone
- X (unshaded)
- Chance of flooding over 30 yrs
- 0.0%
- Est. flood insurance / yr
- $473 – $860
Fire risk 3/10 · Minor
- Est. fire insurance / yr
- $717 – $1,331
Heat risk 3/10 · Minor
- Hot days now (above 103°F)
- 7 days/yr
- Hot days in 30 yrs
- 18 days/yr
Wind risk 2/10 · Minimal
- Chance of severe wind over 30 yrs
- 1.0%
Air-quality risk 2/10 · Minimal
- Unhealthy air days now
- 1 days/yr
- Unhealthy air days in 30 yrs
- 2 days/yr
Risk factors via First Street. Map © Google.
Why this score? — see what drove the C grade
The composite is a weighted blend of 9 inputs, each scored 0–100. Each bar is that input's sub-score; the figure is the points it added to the 100-point composite (weight × sub-score).
- Cash flow +18.3/30.0
- ARV discount +15.0/15.0
- DSCR +5.7/10.0
- 1% rule +4.2/10.0
- Livability +3.7/5.0
- Schools +3.4/10.0
- Rent growth +2.5/5.0
- Condition / age +2.5/5.0
- Appreciation +0.0/10.0
$145,000
🖨 Deal sheet 📄 Offer letter ✓ Due diligence
Listing remarks
Opportunity awaits with this 2-bedroom, 1-bath home situated on a nearly half-acre lot in a highly visible and convenient Greencastle location. With frontage on both Washington Street and Franklin Street and located next to Dairy Castle, this property offers excellent potential for renovation, investment, or future redevelopment. The main level features a traditional layout with a formal living room with hardwood floors and fireplace, a formal dining room with hardwood flooring, kitchen, mud room, sitting room, full bathroom, and two main-level bedrooms. Upstairs, you'll find an additional bedroom along with a walk-in attic space that could provide extra storage or the opportunity to finish
Key facts
- Half-acre lot
- Formal dining room
- Hardwood floors
Tags
Property features AI
Finance
- Other: Lot size approximately 0.4 acre (about 1/4–1/2 acre)
Exterior
- Parking: Detached garage (1 car); Concrete and gravel parking surfaces
- Utilities: Public water; Municipal sewer connected
- Home design: Single family residence; One and one-half story; Property faces south; Residential property in fixer condition; Has a view
- Construction: Cedar exterior; Block foundation
- Exterior features: Covered patio/porch; Storage shed; Partial privacy fence; Mature trees; City lot with sidewalks, street lights and storm sewer
Interior
- Kitchen: Electric oven; Refrigerator
- Bedrooms: Three bedrooms total — two on the main level, one on the upper level
- Flooring: Hardwood floors
- Bathrooms: One full bathroom with a tub
- Heating & cooling: Forced air heating (natural gas); Central air conditioning
- Interior features: Hardwood floors; Woodwork stained/painted; Living room (formal)
- Laundry & utility: Washer and dryer included; Laundry located in the basement
Neighborhood map
What this means for you Summary
Snapshot
- This is a 2-bed/1.0-bath single-family listed at $145k.
Deal economics
- At list price, monthly cash flow is $133 ($2k/yr) — positive.
- The deal already cash-flows at list — no discount required.
- To meet the 1% rule (rent ≥ 1% of price), the offer needs to be $133k (8.4% below list).
- Recommended offer: $133k (8.4% below list) — sets the bar for 1% rule.
- Cap rate 7.4% vs local median 4.3% in Greencastle — top-decile yield for the area; either an underpriced asset or a hidden risk that comps aren't pricing in. Stress-test before assuming the spread holds.
Location & tenants
- Location reads 73/100 on livability (#108 in IN) — a middle-class / working-renter tenant base. Strengths: cost of living A+, housing A+; Watch: employment C-, amenities F, commute F.
- Greencastle Community School Corporation (town): math 38% / reading 42% proficiency, ranked #145 of 301 in IN (top 48%) — families likely to look elsewhere, expect single-tenant / working-renter base with shorter leases.
- Zoned schools: Deer Meadow Primary School (315 students, 56% FRL); Greencastle High School (math 42% / reading 67%, grade C-, #79 of 369 statewide, top 26%, 498 students, 49% FRL).
- Zoned-school proficiency averages 54% at this address vs 40% district-wide (+14 pts) — the actual schools serving this property are materially stronger than the Greencastle Community School Corporation average implies; a family-tenant draw the district grade alone would hide.
- Market conditions: 97 active listings in the ZIP; 166 units permitted in Putnam County in 2024 (0 in 5+ unit buildings).
Forward outlook
- Local home prices are declining (-3.0%/yr); year-one equity from $1k of loan paydown is wiped out by about $4k of value loss. Plan a longer hold.
- Putnam County population projected to shrink 8% by 2050 — rents likely to lag national; underwrite the cash flow, not the appreciation.
Negotiation context
- It's been on market 41 days — a 3% lower offer ($141k) is reasonable based on typical stale-listing flexibility.
Risks & watch-outs
- Watch-outs: built in 1935 — expect roof / HVAC / electrical / plumbing capex.
Questions for the listing agent
- It's been on market 41 days. Have you received any prior offers? Is the seller open to a 8% concession, seller financing, or rate buy-down credit?
- Built in 1935 — when were the roof, HVAC, electrical panel, plumbing, and water heater last replaced?
- Is there a deadline driving the sale (1031 exchange, divorce, estate, relocation)? That informs how much negotiation room exists.
- What's the average days-on-market for RENTAL listings here right now (not sales)? A rising rental-DOM trend means longer vacancies and softer asking-rent achievability than the comps imply.
- What's the recent tenant-quality profile in this submarket — average credit score on applications, eviction rate, late-payment / NSF rate, and stable-employment percentage? A property-management company in the area should have these aggregated.
- How much new for-sale + rental construction is in the pipeline within 1–3 miles? Heavy new supply typically softens prices + rents 12–24 months out; constrained supply supports both.
Investment metrics
- 1% rule
- 0.92% ✗
- Cap rate
- 7.39%
- Cash-on-cash
- 3.92%
- DSCR
- 1.17
- GRM
- 9.1
CMA / ARV
- ARV (median comp)
- $232,324
- List price
- $145,000
- Delta
- -37.59%
- Verdict
- UNDERPRICED
- Comps
- 20 within 1.0 mi
Show comp detail 12 sales within ~0.75 mi
| Address | Dist | Beds/Ba | Sqft | Sold | Price | $/sf | Match |
|---|---|---|---|---|---|---|---|
| 331 Greewood Ave | 0.46mi | 3/1.0 (+1) | 2,120 (+3%) | 4mo | $160,000 | $75 | 65 |
| 846 Indianapolis Rd | 0.40mi | 2/1.0 | 1,872 (-9%) | 2mo | $197,000 | $105 | 64 |
| 9 E Liberty St | 0.71mi | 2/1.0 | 2,142 (+4%) | 4mo | $85,000 | $40 | 57 |
| 403 E Hanna St | 0.53mi | 3/2.5 (+1) | 2,152 (+4%) | 2mo | $275,000 | $128 | 55 |
| 201 E Franklin St | 0.62mi | 3/1.0 (+1) | 2,172 (+5%) | 3mo | $135,000 | $62 | 55 |
| 4 Kentwood Dr | 0.41mi | 2/1.0 | 1,832 (-11%) | 10mo | $130,000 | $71 | 54 |
| 606 Anderson St | 0.32mi | 3/1.0 (+1) | 2,306 (+12%) | 8mo | $198,000 | $86 | 54 |
| 222 Hillsdale Ave | 0.49mi | 3/2.0 (+1) | 2,180 (+6%) | 6mo | $275,000 | $126 | 53 |
| 713 Terrace Ln | 0.25mi | 3/2.5 (+1) | 1,769 (-14%) | 7mo | $250,000 | $141 | 48 |
| 607 E Seminary St | 0.37mi | 3/1.5 (+1) | 2,295 (+11%) | 11mo | $205,000 | $89 | 48 |
| 413 E Washington St | 0.47mi | 3/2.0 (+1) | 2,320 (+13%) | 1mo | $210,000 | $91 | 47 |
| 1000 Meadow Ln | 0.58mi | 3/2.0 (+1) | 1,810 (-12%) | 4mo | $170,000 | $94 | 40 |
Match score weights: distance 35% · size 25% · config 20% · recency 20%. Top-matched comps best support the ARV.
Projected returns pro-forma
-3.0% appreciation · 3.0% rent growth · sell at horizon
- IRR
- -10.2%
- Equity multiple
- 0.63×
- Total profit
- $-15,080
- Equity at exit
- $21,620
- IRR
- -0.9%
- Equity multiple
- 0.94×
- Total profit
- $-2,385
- Equity at exit
- $12,537
Cash invested: $40,600 (down + closing). Projections, not guarantees.
Landlord ↔ Tenant lean methodology
- Overall (STATE)
- 90 Strongly Landlord-Friendly
- State Indiana
- 90 Strongly Landlord-Friendly · R+11
- County
- — inherits STATE
- City
- — inherits STATE
ZIP-level market 46135
- Home prices YoY
- -20.8%
- Active inventory
- 97
- Price-to-rent
- 9.1×
Monthly cashflow live
- Estimated rent
- $1,328 medium interval (Pro) →
- Mortgage (P&I)
- −$760
- Tax from tax record
- −$96 /mo · $1,151/yr
- Insurance
- −$60
- HOA
- −$0
- Vacancy / Maint / Mgmt
- −$279
- Net cashflow
- $133
Break-even live
UW: 25.0% down · 7.5% · 30yr · 1.5% tax · 5.0% vac · 8.0% maint · 8.0% mgmt
Financing live
Cash to close
- Down payment
- $36,250
- Closing costs
- $4,350
- Reserves months
- —
- Total cash needed
- —
Loan-product check · same deal, 3 products live
Conventional
25% down · 7.5% · 30yr
- Down + closing
- —
- Monthly P&I
- —
- Monthly cashflow
- —
- DSCR
- —
- Eligible?
- —
Personal DTI + credit; lowest rate.
DSCR
20% down · 8.5% · 30yr
- Down + closing
- —
- Monthly P&I
- —
- Monthly cashflow
- —
- DSCR
- —
- Eligible?
- —
No personal income docs; deal must DSCR.
Hard money
10% down · 12.0% · 12mo
- Down + closing
- —
- Monthly P&I
- —
- Monthly cashflow
- —
- DSCR
- —
- Eligible?
- —
Short-term bridge; refi at stabilization.
Listing history 16 events
-
2026-06-18days on market $145,000 Active 41 DOM
-
2026-06-17days on market $145,000 Active 40 DOM
-
2026-06-16days on market $145,000 Active 39 DOM
-
2026-06-15days on market $145,000 Active 38 DOM
-
2026-06-13days on market $145,000 Active 36 DOM
-
2026-06-12days on market $145,000 Active 35 DOM
-
2026-06-09days on market $145,000 Active 32 DOM
-
2026-06-08days on market $145,000 Active 31 DOM
-
2026-06-07days on market $145,000 Active 30 DOM
-
2026-06-05days on market $145,000 Active 28 DOM
-
2026-06-04days on market $145,000 Active 26 DOM
-
2026-06-02days on market $145,000 Active 25 DOM
-
2026-06-01days on market $145,000 Active 24 DOM
-
2026-05-31days on market $145,000 Active 23 DOM
-
2026-05-31days on market $145,000 Active 22 DOM
-
2026-05-08$145,000 Active 1426-char remark
ⓘ Source: listings_history table (triggers on properties + properties_extension) + one-shot
backfill from property_details.listing_events for pre-trigger history.
Tax reassessment forecast IN · Partial reset (capped growth)
- Current annual tax
- $1,151 · $96/mo
- Projected year-2 tax
- $1,192 · $99/mo
- Expected delta
- +$41/yr (+$3/mo · 3.5%)
ⓘ Screening estimate from a state-policy table — verify with the county assessor before closing.
Climate risk First Street
- Flood 1/10 Low FEMA zone X (unshaded) · 0% chance over 30 yrs
- Wildfire 3/10 Moderate
- Heat 3/10 Moderate 7 d/yr ≥103°F today · 18 d/yr by 30 yrs out
- Wind 2/10 Low 100% chance of damaging wind over 30 yrs
- Air quality 2/10 Low 1 unhealthy d/yr today · 2 by 30 yrs out
Nearby sold comps map
Loading sold comps map…
Walkable amenities ~0.75 mi
Loading nearby amenities…
Taxation est. · year 1
- Rental income
- $15,940
- − Mortgage interest
- −$8,122
- − Property taxes
- −$1,151
- − Insurance
- −$725
- − Repairs & maintenance
- −$1,275
- − Management
- −$1,275
- − Depreciation
- −$4,218
- Taxable loss
- −$827
- Est. tax savings @ 24.0%
- +$198
- After-tax cash flow
- $1,790/yr
For passive investors: Depreciation is non-cash, so a rental often shows a tax loss while cash-flowing — sheltering income. Rental losses are passive: they offset passive income freely, and up to $25,000/yr can offset ordinary (W-2) income if you actively participate and your MAGI is under $100k (phasing out to $0 by $150k); unused losses carry forward. On sale, claimed depreciation is recaptured at up to 25%, and gains may owe capital-gains tax (a 1031 exchange can defer both). Figures are a year-1 estimate at your 24.0% rate — not tax advice; consult a CPA.
Schools (NCES district)
- District
- Greencastle Community School Corporation
- NCES district ID
- 1803990
- Math proficiency
- 38% ▼ -5.00%
- Reading proficiency
- 42% ▼ -6.00%
- Median HH income
- $46,694
- Composite
- 34.17/100
- National rank
- #5276
- State rank
- #145 of 301 in IN
Livability — Greencastle
- Score
- 73/100
- State rank
- #108
- US rank
- #5665
Category grades
Schools grade is shown separately in the Schools card above.
Census & demographics
- Census place
- Greencastle, IN
- Population (ZIP)
- 19,639
Population outlook (Putnam County) Hauer SSP2
- Today (2025)
- 37,226 people
- By 2030
- 36,723 · -1.4%
- By 2040
- 35,407 · -4.9%
- By 2050
- 34,177 · -8.2%
- By 2075
- 32,038 · -13.9%
- By 2100
- 28,380 · -23.8%
Race, ethnicity, and origin ACS 2023
- Neighborhood character
- Predominantly White (86%)
- Race & ethnicity
- White 86% Black 6% Two or more races 4% Hispanic / Latino 3% Asian 2%
- Common ancestry
- Italian 2% Slovak 2% Lithuanian 1%
- Foreign-born
- 4% · China, Canada
- Languages at home
- 96% English-only · Spanish 1% French/Haitian/Cajun 1% Other Indo-European 1%
Political lean MEDSL · Putnam
- 2024 margin
- Solid R (+52.0) · D 23.1% · R 75.1% · Other 1.8%
- 2008→2024 swing
- -40.0pp toward R · 2008: -12.0pp · 2024: -52.0pp
- All cycles
- 2024: R+52.0 2020: R+50.2 2016: R+49.6 2012: R+32.6 2008: R+12.0
Not yet ingested
- Civics
- —
Market trends
- HPI YoY
- ▼ -58.66%
- Current HPI
- 222.8815
- Rent YoY
- —
- Metro
- —
- State GDP YoY
- ▲ 2.90%
- F500 in state
- 18
Industry mix (Fortune 500 HQ in IN)
| Industry | F500 HQs | Revenue |
|---|---|---|
| Industrial Machinery | 2 | $37B |
|
||
| Healthcare | 1 | $177B |
|
||
| Pharmaceuticals | 1 | $45B |
|
||
| Metals / Steel | 1 | $18B |
|
||
| Agriculture | 1 | $17B |
|
||
| Packaging | 1 | $12B |
|
||
Price history
1 event — show timeline
- 2026-05-08 Listed $145,000 MIBOR as Distributed by MLS Grid
Property tax history
+3.5%/yrLatest (2024): $1,151 · +19.8% YoY. Source: county tax records.
Cash-flow waterfall
monthlySold comps — $/sqft
last 12 mo · ≤1 miLoading sold comps…