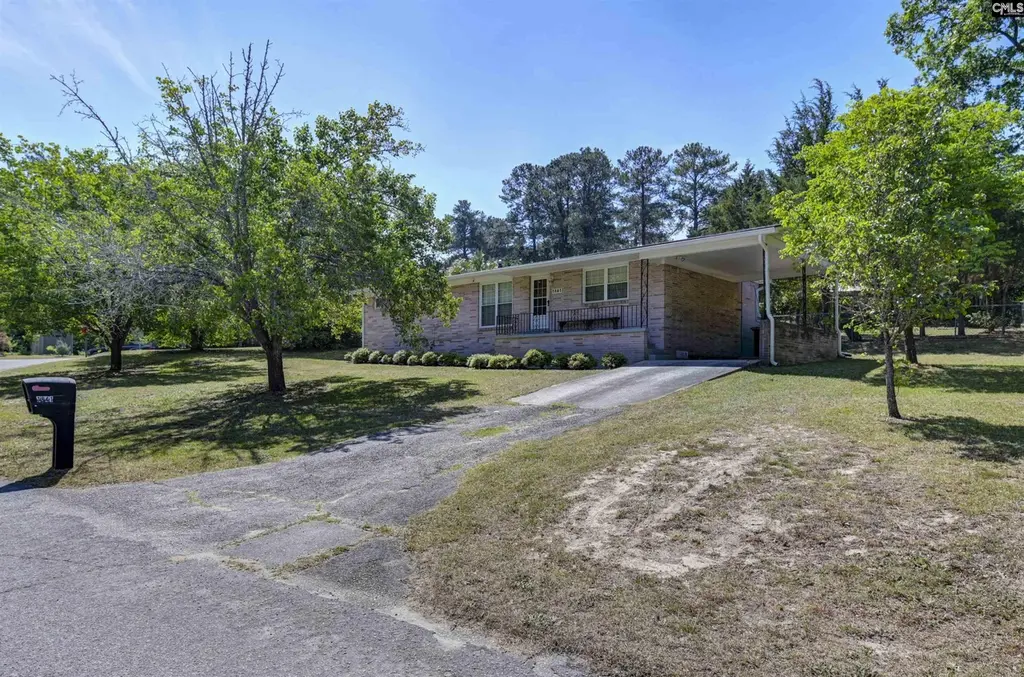
1841 Winsor Hills Dr · Columbia, SC
Flood risk 1/10 · Minimal
- FEMA flood zone
- X (unshaded)
- Chance of flooding over 30 yrs
- 0.0%
- Est. flood insurance / yr
- $507 – $1,088
Fire risk 1/10 · Minimal
- Est. fire insurance / yr
- $783 – $1,453
Heat risk 6/10 · Moderate
- Hot days now (above 108°F)
- 7 days/yr
- Hot days in 30 yrs
- 16 days/yr
Wind risk 6/10 · Moderate
- Chance of severe wind over 30 yrs
- 69.0%
Air-quality risk 3/10 · Minor
- Unhealthy air days now
- 2 days/yr
- Unhealthy air days in 30 yrs
- 2 days/yr
Risk factors via First Street. Map © Google.
Why this score? — see what drove the D grade
The composite is a weighted blend of 9 inputs, each scored 0–100. Each bar is that input's sub-score; the figure is the points it added to the 100-point composite (weight × sub-score).
- Cash flow +13.8/30.0
- ARV discount +7.5/15.0
- DSCR +4.2/10.0
- Livability +3.9/5.0
- Rent growth +3.7/5.0
- 1% rule +2.8/10.0
- Schools +2.6/10.0
- Condition / age +2.5/5.0
- Appreciation +0.0/10.0
$205,000
🖨 Deal sheet 📄 Offer letter ✓ Due diligence
Listing remarks
Welcome to this quaint 3 bedroom, 2-bath home that offers the perfect blend of comfort and functionality. The living room is large and cozy and flows into the kitchen or the formal dining room. The kitchen has been updated with quartz countertops and offers plenty of room for the cook of the house. Out back enjoy the large patio great for relaxing or gilling and enjoying evenings. The large storage shed offers plenty of space for tools or seasonal items. There are hardwood floors under the carpet. Disclaimer: CMLS has not reviewed and, therefore, does not endorse vendors who may appear in listings.
Key facts
- 0.54 acre lot
- 3 parking spots
- Built 1957
Property features AI
Exterior
- Parking: Carport attached; Three parking spaces
- Utilities: Public sewer; Public water; Attic fan (energy feature)
- Home design: Single-story house
- Construction: Brick exterior above foundation; Crawlspace foundation
- Exterior features: Covered front porch; Patio; Shed; Full gutters; Rear chain-link fence; Paved road access; Public water
Interior
- Kitchen: Quartz countertops; Painted cabinets; Vinyl flooring; Dishwasher; Disposal; Free-standing range
- Bedrooms: Master bedroom on main level with private bath, tub/shower, walk-in closet, and carpeted floors; Bedroom 2 on main level with shared bath and private closet; Bedroom 3 on main level with shared bath and private closet
- Flooring: Carpet in bedrooms, living room, and formal dining; Vinyl flooring in kitchen
- Bathrooms: Two full bathrooms (including the master bath)
- Heating & cooling: Central heating; Central cooling
- Interior features: Attic access; Ceiling fans in living room and kitchen; Disposal; Electric water heater; Free-standing range
- Laundry & utility: Main-level laundry in a closet (common, heated space)
Neighborhood map
What this means for you Summary
Snapshot
- This is a 3-bed/2.0-bath single-family listed at $205k.
Deal economics
- At list price, monthly cash flow is $20 ($241/yr) — positive.
- The deal already cash-flows at list — no discount required.
- To meet the 1% rule (rent ≥ 1% of price), the offer needs to be $160k (22.0% below list).
- Recommended offer: $160k (22.0% below list) — sets the bar for 1% rule.
- Cap rate 6.4% vs local median 5.0% in Columbia — meaningfully above typical; check what's discounted (condition, days-on-market, listing class) to confirm the premium yield is real.
Location & tenants
- Location reads 78/100 on livability (#18 in SC, #2,436 nationally) — a middle-class / working-renter tenant base. Strengths: amenities A+, commute A+, cost of living A+; Watch: employment D, crime F.
- Richland 01 (urban): math 26% / reading 36% proficiency, ranked #54 of 80 in SC (top 68%) — families likely to look elsewhere, expect single-tenant / working-renter base with shorter leases; 64% free/reduced lunch — lower-income household profile, screen leases tightly.
- Zoned schools: Bradley Elementary (math 22% / reading 32%, grade F, #421 of 597 statewide, top 73%, 437 students, 100% FRL); W.J. Keenan High (math 54% / reading 77%, grade B, #83 of 196 statewide, top 43%, 725 students, 100% FRL) — zoned schools average 100% FRL vs 64% district-wide (36 pts higher); higher-poverty schools than district average — tighter screening recommended.
- Zoned-school proficiency averages 46% at this address vs 31% district-wide (+15 pts) — the actual schools serving this property are materially stronger than the Richland 01 average implies; a family-tenant draw the district grade alone would hide.
- Market conditions: Rents rising fast (+4.7%/yr); 116 active listings in the ZIP; 18 comparable units currently listed for rent nearby; rentals at typical pace (median 24d on market — plan ~3-4 weeks tenant-placement turnaround); 3,472 units permitted in Richland County in 2024 (1,096 in 5+ unit buildings).
Forward outlook
- Local home prices are declining (-3.0%/yr); year-one equity from $1k of loan paydown is wiped out by about $6k of value loss. Plan a longer hold.
- Richland County population projected at +30% by 2050 — long-run rental-demand tailwind backs the buy-and-hold thesis.
Negotiation context
- It's been on market 52 days — a 3% lower offer ($199k) is reasonable based on typical stale-listing flexibility.
- 2 sale attempts since 6y ago with the ask held roughly flat each time — persistent listings suggest the price (not the market) is what's stuck; bring a comps-based counter.
- Current owner paid $120k; list at $205k implies a 70% gain — meaningful room to come down on a strong offer.
Risks & watch-outs
- Watch-outs: built in 1957 — expect roof / HVAC / electrical / plumbing capex.
- Climate carrying-cost: major wind risk, 69% chance of damaging wind over 30y; extreme-heat days projected 7→16/yr by 2055 (HVAC capex compounding) — expect insurance premiums to compound above CPI over the hold.
Questions for the listing agent
- It's been on market 52 days. Have you received any prior offers? Is the seller open to a 22% concession, seller financing, or rate buy-down credit?
- Built in 1957 — when were the roof, HVAC, electrical panel, plumbing, and water heater last replaced?
- Is there a deadline driving the sale (1031 exchange, divorce, estate, relocation)? That informs how much negotiation room exists.
- Schools are D-rated, which usually means shorter tenancies and higher turnover. Who's the typical renter profile here, and what's been the actual vacancy rate?
- Crime grade is F in this area — have there been break-ins, vandalism, or insurance claims at this property in the last 3 years? What carrier currently insures it and at what premium?
- The area grade is low — what's the realistic commute time and amenity access for the typical tenant pool here? Any planned neighborhood developments (good or bad) we should know about?
- What's the average days-on-market for RENTAL listings here right now (not sales)? A rising rental-DOM trend means longer vacancies and softer asking-rent achievability than the comps imply.
- What's the recent tenant-quality profile in this submarket — average credit score on applications, eviction rate, late-payment / NSF rate, and stable-employment percentage? A property-management company in the area should have these aggregated.
- How much new for-sale + rental construction is in the pipeline within 1–3 miles? Heavy new supply typically softens prices + rents 12–24 months out; constrained supply supports both.
Investment metrics
- 1% rule
- 0.78% ✗
- Cap rate
- 6.41%
- Cash-on-cash
- 0.42%
- DSCR
- 1.02
- GRM
- 10.7
CMA / ARV
No comps found within radius.
Projected returns pro-forma
-3.0% appreciation · 4.73% rent growth · sell at horizon
- IRR
- -14.0%
- Equity multiple
- 0.49×
- Total profit
- $-29,190
- Equity at exit
- $30,566
- IRR
- -2.9%
- Equity multiple
- 0.79×
- Total profit
- $-12,071
- Equity at exit
- $17,725
Cash invested: $57,400 (down + closing). Projections, not guarantees.
Landlord ↔ Tenant lean methodology
- Overall (STATE)
- 90 Strongly Landlord-Friendly
- State South Carolina
- 90 Strongly Landlord-Friendly · R+6
- County
- — inherits STATE
- City
- — inherits STATE
ZIP-level market 29204
- Home prices YoY
- -34.9%
- Rents YoY
- 4.7%
- Active inventory
- 116
- Price-to-rent
- 10.7×
Monthly cashflow live
- Estimated rent
- $1,599 high interval (Pro) →
- Mortgage (P&I)
- −$1,075
- Tax from tax record
- −$82 /mo · $990/yr
- Insurance
- −$85
- HOA
- −$0
- Vacancy / Maint / Mgmt
- −$336
- Net cashflow
- $20
Break-even live
UW: 25.0% down · 7.5% · 30yr · 1.5% tax · 5.0% vac · 8.0% maint · 8.0% mgmt
Financing live
Cash to close
- Down payment
- $51,250
- Closing costs
- $6,150
- Reserves months
- —
- Total cash needed
- —
Loan-product check · same deal, 3 products live
Conventional
25% down · 7.5% · 30yr
- Down + closing
- —
- Monthly P&I
- —
- Monthly cashflow
- —
- DSCR
- —
- Eligible?
- —
Personal DTI + credit; lowest rate.
DSCR
20% down · 8.5% · 30yr
- Down + closing
- —
- Monthly P&I
- —
- Monthly cashflow
- —
- DSCR
- —
- Eligible?
- —
No personal income docs; deal must DSCR.
Hard money
10% down · 12.0% · 12mo
- Down + closing
- —
- Monthly P&I
- —
- Monthly cashflow
- —
- DSCR
- —
- Eligible?
- —
Short-term bridge; refi at stabilization.
Rent comps 18 comps
| Address | Beds | Baths | Sqft | Rent | $/sqft | DOM | Units | Dist |
|---|---|---|---|---|---|---|---|---|
| 3117 Quitman St Columbia, SC | 3.0 | 2.0 | 1500 | $1,750 | $1.17 | 23d | 1 | 0.16mi |
| 3431 Covenant Rd Columbia, SC | 1.0–3.0 | 1.0–1.5 | 950 | $1,100 | $1.16 | 23d | 1 | 0.38mi |
| 4443 Bethel Church Rd #27 Columbia, SC | 3.0 | 2.5 | 1660 | $1,645 | $0.99 | 23d | 1 | 0.49mi |
| 4215 Bethel Church Rd Columbia, SC | 1.0–3.0 | 1.0–2.0 | 962 | $1,395 | $1.45 | 23d | 1 | 0.60mi |
| 1115 Carter St Columbia, SC | 1.0–2.0 | 1.0 | 854 | $1,405 | $1.65 | 23d | 1 | 0.60mi |
| 151 Renaissance Way Columbia, SC | 3.0 | 2.0 | 1200 | $1,400 | $1.17 | 23d | 1 | 0.61mi |
| 4214 Bethel Church Rd Columbia, SC | 2.0–3.0 | 1.0–2.0 | 1068 | $1,429 | $1.34 | 11d | 9 | 0.71mi |
| 1800 Cherry Laurel Dr Unit 18005 Columbia, SC | 2.0 | 1.0 | 960 | $895 | $0.93 | 23d | 1 | 0.95mi |
| 1821 Atascadero Dr Columbia, SC | 3.0 | 2.0 | 1520 | $2,000 | $1.32 | 23d | 1 | 0.95mi |
| 3145 Bronx Rd Columbia, SC | 3.0 | 1.5 | 1207 | $1,511 | $1.25 | 23d | 1 | 0.98mi |
| 2834 Keats St Columbia, SC | 3.0 | 2.0 | 921 | $2,250 | $2.44 | 14d | 1 | 1.05mi |
| 1931 Chaney St Columbia, SC | 2.0 | 1.0 | 1034 | $1,600 | $1.55 | 23d | 1 | 1.07mi |
| 5437 Ransom Dr Columbia, SC | 3.0 | 1.0 | 1056 | $1,531 | $1.45 | 23d | 1 | 1.08mi |
| 2928 English Ave Unit NA Columbia, SC | 3.0 | 1.0 | 1320 | $1,590 | $1.20 | 11d | 1 | 1.19mi |
| 3015 English Ave Columbia, SC | 2.0 | 1.0 | 981 | $1,250 | $1.27 | 11d | 1 | 1.20mi |
| 3040 Girardeau Ave Columbia, SC | 3.0 | 1.5 | 1400 | $2,150 | $1.54 | 23d | 1 | 1.33mi |
| 3040 Girardeau Ave Columbia, SC | 3.0 | 1.5 | 1400 | $2,150 | $1.54 | 14d | 1 | 1.33mi |
| 2050 N Beltline Blvd Columbia, SC | 1.0–2.0 | 1.0–1.5 | 831 | $1,042 | $1.25 | 14d | 6 | 1.35mi |
Listing history 12 events
-
2026-06-08statusdays on market $205,000 Pending 52 DOM
-
2026-06-07days on market $205,000 Active - Contingent 51 DOM
-
2026-06-03days on market $205,000 Active - Contingent 47 DOM
-
2026-06-03days on market $205,000 Active - Contingent 46 DOM
-
2026-06-01days on market $205,000 Active - Contingent 45 DOM
-
2026-05-31days on market $205,000 Active - Contingent 44 DOM
-
2026-05-11price $205,000
-
2026-04-17$210,000 Active
-
2020-07-14soldstatus $120,500
-
2020-05-26historical
-
2020-05-22price $125,000
-
2020-04-22$135,000 Active
ⓘ Source: listings_history table (triggers on properties + properties_extension) + one-shot
backfill from property_details.listing_events for pre-trigger history.
Tax reassessment forecast SC · Resets to sale price
- Current annual tax
- $990 · $82/mo
- Projected year-2 tax
- $1,168 · $97/mo
- Expected delta
- +$178/yr (+$15/mo · 18.0%)
ⓘ Screening estimate from a state-policy table — verify with the county assessor before closing.
Climate risk First Street
- Flood 1/10 Low FEMA zone X (unshaded) · 0% chance over 30 yrs
- Wildfire 1/10 Low
- Heat 6/10 Major 7 d/yr ≥108°F today · 16 d/yr by 30 yrs out
- Wind 6/10 Major 69% chance of damaging wind over 30 yrs
- Air quality 3/10 Moderate 2 unhealthy d/yr today · 2 by 30 yrs out
Nearby sold comps map
Loading sold comps map…
Walkable amenities ~0.75 mi
Loading nearby amenities…
Taxation est. · year 1
- Rental income
- $19,186
- − Mortgage interest
- −$11,483
- − Property taxes
- −$990
- − Insurance
- −$1,025
- − Repairs & maintenance
- −$1,535
- − Management
- −$1,535
- − Depreciation
- −$5,964
- Taxable loss
- −$3,346
- Est. tax savings @ 24.0%
- +$803
- After-tax cash flow
- $1,044/yr
For passive investors: Depreciation is non-cash, so a rental often shows a tax loss while cash-flowing — sheltering income. Rental losses are passive: they offset passive income freely, and up to $25,000/yr can offset ordinary (W-2) income if you actively participate and your MAGI is under $100k (phasing out to $0 by $150k); unused losses carry forward. On sale, claimed depreciation is recaptured at up to 25%, and gains may owe capital-gains tax (a 1031 exchange can defer both). Figures are a year-1 estimate at your 24.0% rate — not tax advice; consult a CPA.
Schools (NCES district)
- District
- Richland 01
- NCES district ID
- 4503360
- Math proficiency
- 26% ▼ -7.00%
- Reading proficiency
- 36% ▼ -5.00%
- Median HH income
- $38,931
- Composite
- 25.94/100
- National rank
- #7335
- State rank
- #54 of 80 in SC
Livability — Columbia
- Score
- 78/100
- State rank
- #18
- US rank
- #2436
Category grades
Schools grade is shown separately in the Schools card above.
Census & demographics
- Census place
- Columbia, SC
- County
- Richland County · 389,530 people
- City population
- 335,994
- Metro
- Columbia, SC
- Population (ZIP)
- 18,159
- Household income
- $50,189
- Rent vs Own
- Severe rent burden
- 1045.0
Population outlook (Richland County) Hauer SSP2
- Today (2025)
- 459,667 people
- By 2030
- 487,524 · +6.1%
- By 2040
- 542,035 · +17.9%
- By 2050
- 595,371 · +29.5%
- By 2075
- 732,998 · +59.5%
- By 2100
- 820,415 · +78.5%
Race, ethnicity, and origin ACS 2023
- Neighborhood character
- Diverse neighborhood (Simpson 0.57)
- Race & ethnicity
- Black 48% White 44% Two or more races 3% Asian 3% Hispanic / Latino 2%
- Common ancestry
- Serbian 2% Slovak 2% Italian 1%
- Foreign-born
- 3% · Canada
- Languages at home
- 93% English-only · Spanish 2% Tagalog/Filipino 1% Arabic 1%
Political lean MEDSL · Richland
- 2024 margin
- Solid D (+34.6) · D 66.4% · R 31.8% · Other 1.8%
- 2008→2024 swing
- +5.7pp toward D · 2008: 28.9pp · 2024: 34.6pp
- All cycles
- 2024: D+34.6 2020: D+38.3 2016: D+32.9 2012: D+33.3 2008: D+28.9
Not yet ingested
- Civics
- —
Market trends
- HPI YoY
- ▼ -104.76%
- Current HPI
- 195.2246
- Rent YoY
- ▲ 4.73%
- Metro
- Columbia, SC
- State GDP YoY
- ▲ 4.51%
- F500 in state
- 2
Industry mix (Fortune 500 HQ in SC)
| Industry | F500 HQs | Revenue |
|---|---|---|
| Packaging | 1 | $7B |
|
||
Price history
+51.9% since first listed6 events — show timeline
- 2026-05-11 Price Changed $205,000 Consolidated MLS
- 2026-04-17 Listed $210,000 Consolidated MLS
- 2020-07-14 Sold (Public Records) $120,500 Public Records
- 2020-05-26 Delisted — Consolidated MLS
- 2020-05-22 Price Changed $125,000 Consolidated MLS
- 2020-04-22 Listed $135,000 Consolidated MLS
Property tax history
+9.3%/yrLatest (2025): $990 · +3.7% YoY. Source: county tax records.
Cash-flow waterfall
monthlySold comps — $/sqft
last 12 mo · ≤1 miLoading sold comps…