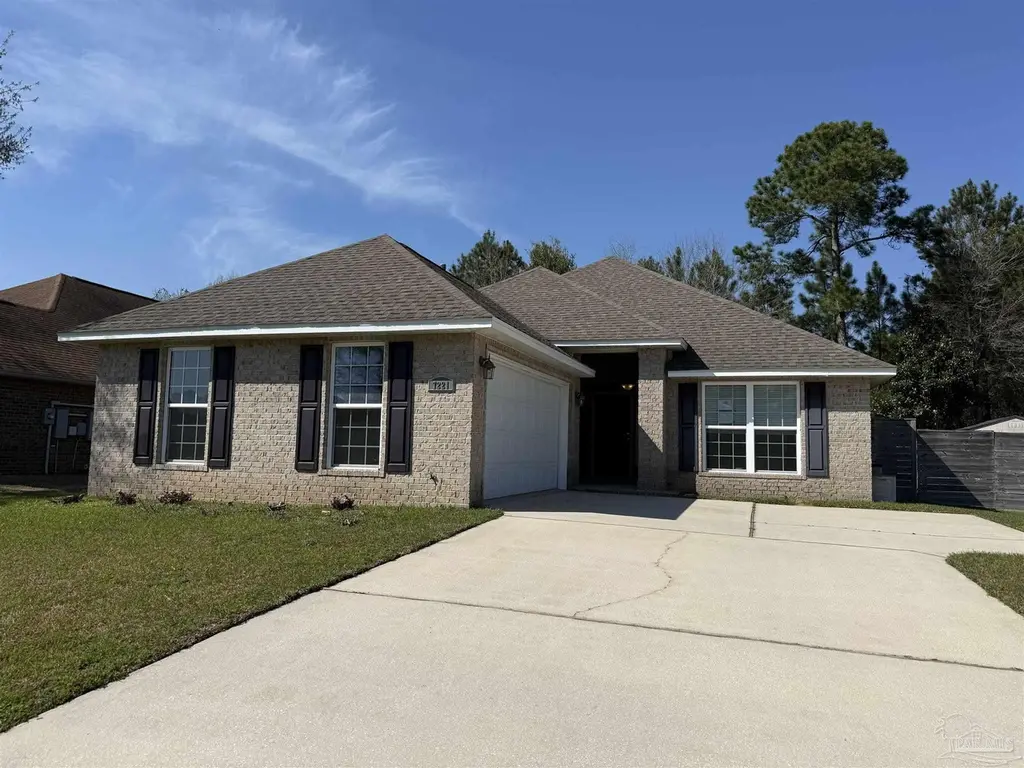
7221 Farmers Rd · Bellview, FL
Flood risk 1/10 · Minimal
- FEMA flood zone
- X (unshaded)
- Chance of flooding over 30 yrs
- 0.0%
- Est. flood insurance / yr
- $507 – $1,088
Fire risk 3/10 · Minor
- Est. fire insurance / yr
- $947 – $1,759
Heat risk 10/10 · Severe
- Hot days now (above 105°F)
- 7 days/yr
- Hot days in 30 yrs
- 24 days/yr
Wind risk 9/10 · Severe
- Chance of severe wind over 30 yrs
- 99.0%
Air-quality risk 1/10 · Minimal
- Unhealthy air days now
- 0 days/yr
- Unhealthy air days in 30 yrs
- 0 days/yr
Risk factors via First Street. Map © Google.
Why this score? — see what drove the D- grade
The composite is a weighted blend of 9 inputs, each scored 0–100. Each bar is that input's sub-score; the figure is the points it added to the 100-point composite (weight × sub-score).
- ARV discount +13.0/15.0
- Cash flow +8.5/30.0
- Rent growth +3.6/5.0
- Schools +3.6/10.0
- Livability +3.4/5.0
- Condition / age +2.5/5.0
- 1% rule +2.4/10.0
- DSCR +2.3/10.0
- Appreciation +0.0/10.0
$305,000
🖨 Deal sheet (PDF) 📄 Offer letter ✓ Due diligence
Listing remarks MLS
Welcome to 7221 Farmers Rd in Pensacola! This well-maintained home is in good condition and offers a comfortable layout with plenty of space to enjoy. Situated on a generous lot, the property provides both privacy and room to relax or entertain. Conveniently located near shopping, dining, and everyday amenities, this home is move-in ready and perfect for a variety of buyers. Don’t miss your opportunity to own a solid home in a great location—schedule your showing today to make this your Next Home!
Key facts
- Move-in ready
- Generous lot
- Great location
Tags
Neighborhood map
What this means for you Summary
Snapshot
- This is a 3-bed/3.0-bath single-family listed at $305k.
Deal economics
- At list price, monthly cash flow is $-269 ($-3k/yr) — negative.
- To cash-flow at today's rent, offer at most $257k (15.6% below list).
- To meet the 1% rule (rent ≥ 1% of price), the offer needs to be $227k (25.7% below list).
- Recommended offer: $227k (25.7% below list) — sets the bar for 1% rule.
Location & tenants
- Location reads 67/100 on livability (#561 in FL) — a middle-class / working-renter tenant base. Strengths: cost of living A+, housing A+; Watch: schools D+, amenities F, commute F.
- Escambia (suburban): math 40% / reading 45% proficiency, ranked #56 of 73 in FL (top 77%) — families likely to look elsewhere, expect single-tenant / working-renter base with shorter leases.
- Market conditions: Rents rising fast (+4.4%/yr); 417 active listings in the ZIP; 3 comparable units currently listed for rent nearby; rentals at typical pace (median 22d on market — plan ~3-4 weeks tenant-placement turnaround); solid renter incomes; 1,479 units permitted in Escambia County in 2024 (0 in 5+ unit buildings).
- This rent runs 36% of the median local income ($75k/yr) — at the standard rent-burdened threshold; future hikes will face affordability resistance.
Forward outlook
- Local home prices are declining (-3.0%/yr); year-one equity from $2k of loan paydown is wiped out by about $9k of value loss. Plan a longer hold.
- Escambia County population projected at +13% by 2050 — modest demand growth; plan on rents tracking national, not racing it.
Negotiation context
- It's been on market 64 days — a 6% lower offer ($287k) is reasonable based on typical stale-listing flexibility.
- 3 sale attempts since 12y ago; this cycle's ask has dropped $30k (9%) from the opening price — seller is motivated, your offer sets the floor, not the list.
Risks & watch-outs
- Climate carrying-cost: severe wind risk, 99% chance of damaging wind over 30y; extreme-heat days projected 7→24/yr by 2055 (HVAC capex compounding) — expect insurance premiums to compound above CPI over the hold.
Questions for the listing agent
- What do current leases actually rent for vs. the listed asking? Can we see a recent rent roll and the last 12 months of T-12 income?
- It's been on market 64 days. Have you received any prior offers? Is the seller open to a 26% concession, seller financing, or rate buy-down credit?
- What does the HOA fee cover, when was the last increase, and are there any pending special assessments or reserve-fund shortfalls?
- Why hasn't it sold? Are there any deal-killer items the seller is aware of (foundation, flood, title, zoning, code violations)?
- Is there a deadline driving the sale (1031 exchange, divorce, estate, relocation)? That informs how much negotiation room exists.
- Schools are D-rated, which usually means shorter tenancies and higher turnover. Who's the typical renter profile here, and what's been the actual vacancy rate?
- The area grade is low — what's the realistic commute time and amenity access for the typical tenant pool here? Any planned neighborhood developments (good or bad) we should know about?
- What's the average days-on-market for RENTAL listings here right now (not sales)? A rising rental-DOM trend means longer vacancies and softer asking-rent achievability than the comps imply.
- What's the recent tenant-quality profile in this submarket — average credit score on applications, eviction rate, late-payment / NSF rate, and stable-employment percentage? A property-management company in the area should have these aggregated.
- How much new for-sale + rental construction is in the pipeline within 1–3 miles? Heavy new supply typically softens prices + rents 12–24 months out; constrained supply supports both.
Investment metrics
- 1% rule
- 0.74% ✗
- Cap rate
- 5.23%
- Cash-on-cash
- -3.78%
- DSCR
- 0.83
- GRM
- 11.2
CMA / ARV
- ARV (median comp)
- $347,150
- List price
- $305,000
- Delta
- -12.14%
- Verdict
- UNDERPRICED
- Comps
- 20 within 1.0 mi
Show comp detail 12 sales within ~0.75 mi
| Address | Dist | Beds/Ba | Sqft | Sold | Price | $/sf | Match |
|---|---|---|---|---|---|---|---|
| 7305 Farmers Rd | 0.12mi | 3/2.0 | 1,868 (+2%) | 4mo | $350,000 | $187 | 84 |
| 7389 Farmers Rd | 0.12mi | 3/2.0 | 1,905 (+4%) | 2mo | $325,000 | $171 | 83 |
| 7365 Farmers Rd | 0.13mi | 3/3.0 | 1,928 (+5%) | 5mo | $350,000 | $182 | 82 |
| 7812 Jewt Ln | 0.06mi | 3/3.0 | 2,100 (+14%) | 1mo | $395,000 | $188 | 72 |
| 7460 Farmers Rd | 0.15mi | 3/2.0 | 2,100 (+14%) | 1mo | $355,000 | $169 | 64 |
| 7061 Beulah Rd | 0.45mi | 4/2.0 (+1) | 1,878 (+2%) | 2mo | $365,000 | $194 | 64 |
| 7558 Oak Lake Blvd | 0.60mi | 4/2.0 (+1) | 1,844 (+0%) | 3mo | $305,000 | $165 | 60 |
| 7563 Hayfield Cir | 0.17mi | 4/2.0 (+1) | 2,068 (+13%) | 5mo | $340,000 | $164 | 58 |
| 5049 Wheeler Way | 0.48mi | 4/2.0 (+1) | 2,000 (+9%) | 6mo | $379,900 | $190 | 48 |
| 7555 Oak Lake Blvd | 0.61mi | 3/2.0 | 1,979 (+8%) | 7mo | $304,900 | $154 | 48 |
| 7507 Oak Lake Blvd | 0.53mi | 3/2.0 | 1,611 (-12%) | 7mo | $289,000 | $179 | 45 |
| 7487 Oak Lake Blvd | 0.53mi | 3/2.0 | 1,605 (-13%) | 8mo | $285,000 | $178 | 44 |
Match score weights: distance 35% · size 25% · config 20% · recency 20%. Top-matched comps best support the ARV.
Projected returns pro-forma
-3.0% appreciation · 4.42% rent growth · sell at horizon
- IRR
- -21.1%
- Equity multiple
- 0.26×
- Total profit
- $-63,290
- Equity at exit
- $45,476
- IRR
- -11.7%
- Equity multiple
- 0.26×
- Total profit
- $-63,312
- Equity at exit
- $26,371
Cash invested: $85,400 (down + closing). Projections, not guarantees.
Landlord ↔ Tenant lean methodology
- Overall (STATE)
- 87 Strongly Landlord-Friendly
- State Florida
- 87 Strongly Landlord-Friendly · R+3
- County
- — inherits STATE
- City
- — inherits STATE
ZIP-level market 32526
- Home prices YoY
- -28.3%
- Rents YoY
- 4.4%
- Active inventory
- 417
- Price-to-rent
- 11.2×
Monthly cashflow live
- Estimated rent
- $2,266 medium interval (Pro) →
- Mortgage (P&I)
- −$1,599
- Tax from tax record
- −$322 /mo · $3,868/yr
- Insurance
- −$127
- HOA
- −$11
- Vacancy / Maint / Mgmt
- −$476
- Net cashflow
- $-269
Break-even live
Sensitivity live
| Price | -10% $-97 | -5% $-183 | +0% $-269 | +5% $-356 | +10% $-442 |
|---|---|---|---|---|---|
| Rent | -10% $-448 | -5% $-359 | +0% $-269 | +5% $-180 | +10% $-90 |
| Rate | -1.0pp $-116 | -0.5pp $-192 | base $-269 | +0.5pp $-348 | +1.0pp $-429 |
UW: 25.0% down · 7.5% · 30yr · 1.5% tax · 5.0% vac · 8.0% maint · 8.0% mgmt
Financing live
Cash to close
- Down payment
- $76,250
- Closing costs
- $9,150
- Reserves months
- —
- Total cash needed
- —
Loan-product check · same deal, 3 products live
Conventional
25% down · 7.5% · 30yr
- Down + closing
- —
- Monthly P&I
- —
- Monthly cashflow
- —
- DSCR
- —
- Eligible?
- —
Personal DTI + credit; lowest rate.
DSCR
20% down · 8.5% · 30yr
- Down + closing
- —
- Monthly P&I
- —
- Monthly cashflow
- —
- DSCR
- —
- Eligible?
- —
No personal income docs; deal must DSCR.
Hard money
10% down · 12.0% · 12mo
- Down + closing
- —
- Monthly P&I
- —
- Monthly cashflow
- —
- DSCR
- —
- Eligible?
- —
Short-term bridge; refi at stabilization.
Rent comps 3 comps
| Address | Beds | Baths | Sqft | Rent | $/sqft | DOM | Units | Dist |
|---|---|---|---|---|---|---|---|---|
| 7805 Lakeside Oaks Dr Pensacola, FL | 4.0 | 2.0 | 1830 | $2,400 | $1.31 | 24d | 1 | 0.55mi |
| 7416 Oak Lake Blvd Pensacola, FL | 3.0 | 2.0 | 1979 | $2,145 | $1.08 | 22d | 1 | 0.56mi |
| 7540 Oak Lake Blvd Pensacola, FL | 4.0 | 2.5 | 2000 | $2,085 | $1.04 | 14d | 1 | 0.57mi |
HOA detail
- Monthly dues
- $11 · $132/yr
Listing history 23 events
-
2026-06-18price $305,000 Active 64 DOM
-
2026-06-18days on market $320,000 Active 64 DOM
-
2026-06-17days on market $320,000 Active 63 DOM
-
2026-06-16days on market $320,000 Active 62 DOM
-
2026-06-15days on market $320,000 Active 61 DOM
-
2026-06-14days on market $320,000 Active 59 DOM
-
2026-06-10days on market $320,000 Active 56 DOM
-
2026-06-09days on market $320,000 Active 55 DOM
-
2026-06-08days on market $320,000 Active 54 DOM
-
2026-06-07days on market $320,000 Active 53 DOM
-
2026-06-03days on market $320,000 Active 49 DOM
-
2026-06-02days on market $320,000 Active 48 DOM
-
2026-06-01days on market $320,000 Active 47 DOM
-
2026-05-31days on market $320,000 Active 46 DOM
-
2026-05-31days on market $320,000 Active 45 DOM
-
2026-04-15$334,950 Active 514-char remark
Show marketing remark (514 chars)
Welcome to 7221 Farmers Rd in Pensacola! This well-maintained home is in good condition and offers a comfortable layout with plenty of space to enjoy. Situated on a generous lot, the property provides both privacy and room to relax or entertain. Conveniently located near shopping, dining, and everyday amenities, this home is move-in ready and perfect for a variety of buyers. Don’t miss your opportunity to own a solid home in a great location—schedule your showing today to make this your Next Home!
-
2021-03-25soldstatus $269,900
-
2021-03-19soldstatus $269,900 Sold 309-char remark
Show marketing remark (309 chars)
Stunning and well cared for Beulah home. Conveniently located to Navy Federal. Home is equiped with a Rainsoft Water Softner system. There is a bathroom for every bedroom. Home has high ceilings, granite counter tops, very large master bathroom, covered patio, fenced in backyard, large closets, large pantry.
-
2021-01-20historical 309-char remark
Show marketing remark (309 chars)
Stunning and well cared for Beulah home. Conveniently located to Navy Federal. Home is equiped with a Rainsoft Water Softner system. There is a bathroom for every bedroom. Home has high ceilings, granite counter tops, very large master bathroom, covered patio, fenced in backyard, large closets, large pantry.
-
2020-12-17$269,900 309-char remark
Show marketing remark (309 chars)
Stunning and well cared for Beulah home. Conveniently located to Navy Federal. Home is equiped with a Rainsoft Water Softner system. There is a bathroom for every bedroom. Home has high ceilings, granite counter tops, very large master bathroom, covered patio, fenced in backyard, large closets, large pantry.
-
2014-11-13historical
-
2014-06-26$196,900
-
2014-05-22soldstatus $54,000
ⓘ Source: listings_history table (triggers on properties + properties_extension) + one-shot
backfill from property_details.listing_events for pre-trigger history.
Tax reassessment forecast FL · Resets to sale price
- Current annual tax
- $3,868 · $322/mo
- Projected year-2 tax
- $3,868 · $322/mo
- Expected delta
- $0/yr ($0/mo · 0.0%)
ⓘ Screening estimate from a state-policy table — verify with the county assessor before closing.
Climate risk First Street
- Flood 1/10 Low FEMA zone X (unshaded) · 0% chance over 30 yrs
- Wildfire 3/10 Moderate
- Heat 10/10 Extreme 7 d/yr ≥105°F today · 24 d/yr by 30 yrs out
- Wind 9/10 Extreme 99% chance of damaging wind over 30 yrs
- Air quality 1/10 Low 0 unhealthy d/yr today · 0 by 30 yrs out
Nearby sold comps map
Loading sold comps map…
Walkable amenities ~0.75 mi
Loading nearby amenities…
Taxation est. · year 1
- Rental income
- $27,197
- − Mortgage interest
- −$17,085
- − Property taxes
- −$3,868
- − Insurance
- −$1,525
- − Repairs & maintenance
- −$2,176
- − Management
- −$2,176
- − HOA
- −$132
- − Depreciation
- −$8,873
- Taxable loss
- −$8,636
- Est. tax savings @ 24.0%
- +$2,073
- After-tax cash flow
- $-1,160/yr
For passive investors: Depreciation is non-cash, so a rental often shows a tax loss while cash-flowing — sheltering income. Rental losses are passive: they offset passive income freely, and up to $25,000/yr can offset ordinary (W-2) income if you actively participate and your MAGI is under $100k (phasing out to $0 by $150k); unused losses carry forward. On sale, claimed depreciation is recaptured at up to 25%, and gains may owe capital-gains tax (a 1031 exchange can defer both). Figures are a year-1 estimate at your 24.0% rate — not tax advice; consult a CPA.
Schools (NCES district)
- District
- Escambia
- NCES district ID
- 1200510
- Math proficiency
- 40% ▼ -9.00%
- Reading proficiency
- 45% ▼ -4.00%
- Median HH income
- $44,649
- Composite
- 36.04/100
- National rank
- #4773
- State rank
- #56 of 73 in FL
Livability — Bellview
- Score
- 67/100
- State rank
- #561
- US rank
- #10731
Category grades
Schools grade is shown separately in the Schools card above.
Census & demographics
- County
- Escambia County · 301,722 people
- Metro
- Pensacola-Ferry Pass-Brent, FL
- Population (ZIP)
- 44,680
- Household income
- $75,098
- Rent vs Own
- Severe rent burden
- 1166.0
Population outlook (Escambia County) Hauer SSP2
- Today (2025)
- 334,637 people
- By 2030
- 345,779 · +3.3%
- By 2040
- 364,828 · +9.0%
- By 2050
- 378,514 · +13.1%
- By 2075
- 403,220 · +20.5%
- By 2100
- 386,125 · +15.4%
Race, ethnicity, and origin ACS 2023
- Neighborhood character
- Predominantly White (66%)
- Race & ethnicity
- White 66% Black 19% Two or more races 8% Hispanic / Latino 5% Asian 3%
- Common ancestry
- Lithuanian 2% Slovak 2% Serbian 2%
- Foreign-born
- 5% · Canada, China
- Languages at home
- 94% English-only · Spanish 2% Tagalog/Filipino 1% Other Indo-European 1%
Political lean MEDSL · Escambia
- 2024 margin
- R (+19.5) · D 39.7% · R 59.2% · Other 1.1%
- 2008→2024 swing
- -0.2pp no change · 2008: -19.3pp · 2024: -19.5pp
- All cycles
- 2024: R+19.5 2020: R+15.1 2016: R+20.6 2012: R+20.6 2008: R+19.3
Not yet ingested
- Civics
- —
Market trends
- HPI YoY
- ▼ -99.68%
- Current HPI
- 252.6406
- Rent YoY
- ▲ 4.42%
- Metro
- Pensacola-Ferry Pass-Brent, FL
- State GDP YoY
- ▲ 3.28%
- F500 in state
- 36
Industry mix (Fortune 500 HQ in FL)
| Industry | F500 HQs | Revenue |
|---|---|---|
| Industrial Technology | 2 | $29B |
|
||
| Insurance | 2 | $17B |
|
||
| Retail | 1 | $60B |
|
||
| Technology Distribution | 1 | $58B |
|
||
| Homebuilding | 1 | $35B |
|
||
| Technology Manufacturing | 1 | $35B |
|
||
Price history
+520.3% since first listed8 events — show timeline
- 2026-04-15 Listed $334,950 PARMLS
- 2021-03-25 Sold (Public Records) $269,900 Public Records
- 2021-03-19 Sold (MLS) $269,900 PARMLS
- 2021-01-20 Listing Removed — PARMLS
- 2020-12-17 Listed $269,900 PARMLS
- 2014-11-13 Listing Removed — PARMLS
- 2014-06-26 Listed $196,900 PARMLS
- 2014-05-22 Sold (Public Records) $54,000 Public Records
Property tax history
+23.2%/yrLatest (2025): $3,868 · +6.2% YoY. Source: county tax records.
Cash-flow waterfall
monthlySold comps — $/sqft
last 12 mo · ≤1 miLoading sold comps…