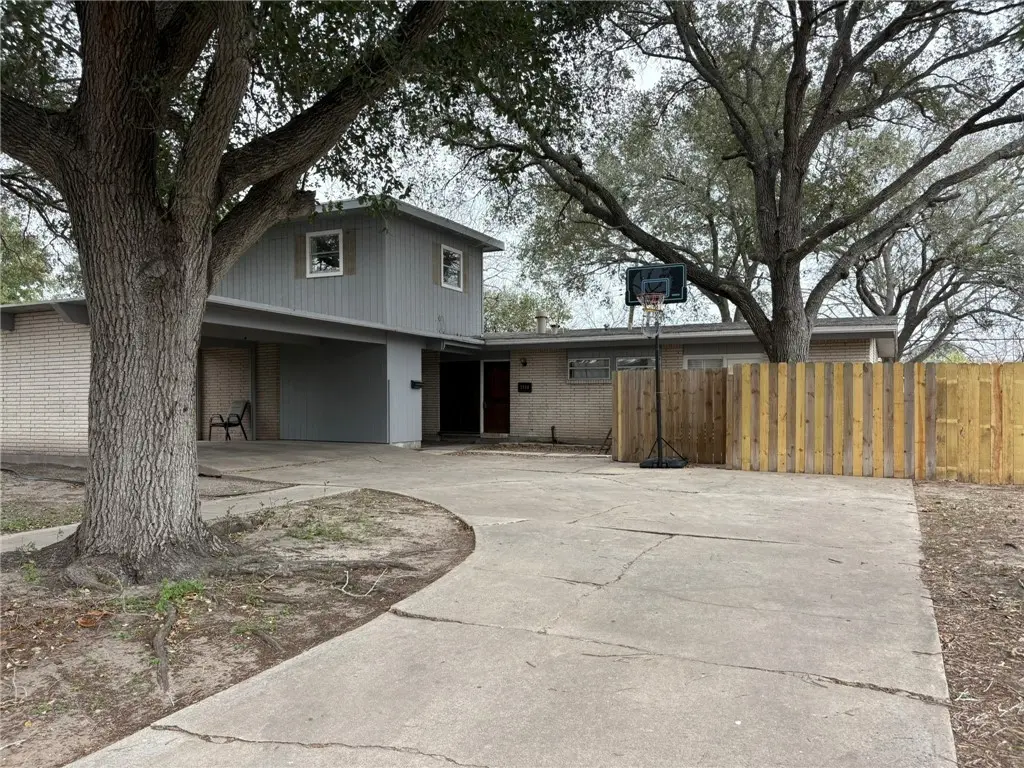
1314 Casa Verde Dr · Corpus Christi, TX
Flood risk 1/10 · Minimal
- FEMA flood zone
- X (unshaded)
- Chance of flooding over 30 yrs
- 0.0%
- Est. flood insurance / yr
- $507 – $1,088
Fire risk 1/10 · Minimal
- Est. fire insurance / yr
- $1,222 – $2,270
Heat risk 10/10 · Severe
- Hot days now (above 107°F)
- 7 days/yr
- Hot days in 30 yrs
- 26 days/yr
Wind risk 9/10 · Severe
- Chance of severe wind over 30 yrs
- 99.0%
Air-quality risk 1/10 · Minimal
- Unhealthy air days now
- 0 days/yr
- Unhealthy air days in 30 yrs
- 0 days/yr
Risk factors via First Street. Map © Google.
Why this score? — see what drove the B- grade
The composite is a weighted blend of 9 inputs, each scored 0–100. Each bar is that input's sub-score; the figure is the points it added to the 100-point composite (weight × sub-score).
- Cash flow +25.0/30.0
- ARV discount +15.0/15.0
- DSCR +8.2/10.0
- 1% rule +7.6/10.0
- Rent growth +4.5/5.0
- Livability +3.9/5.0
- Schools +2.8/10.0
- Condition / age +2.5/5.0
- Appreciation +0.0/10.0
$169,000
🖨 Deal sheet 📄 Offer letter ✓ Due diligence
Listing remarks MLS
Charming 4 bedroom, 3 bath home with saltillo tile in living, dining and kitchen area. Bricked courtyard entrance with oak trees providing plenty of shade. Floor length windows bring outside in to living and dining areas. Beautiful plantation shutters in master bdrm and living areas. Fresh paint inside and out. Large utility room. New appliances. Refrigerator to STAY! MOVE IN READY! Home was originally designed w/ front wrap carport, brick on two sides, but could easily be closed in.
Key facts
- Schools nearby
- Centrally located
- Shopping nearby
Tags
Property features AI
Exterior
- Parking: 2-car garage; Carport; Front entry parking
- Utilities: Natural gas available; Overhead utilities; Phone service available; Public sewer; Public water; Electricity available
- Home design: Two-story home; Shingle roof; Brick and veneer construction; Slab foundation
- Construction: Built with brick and veneer; Shingle roof; Slab foundation; 2 stories
- Exterior features: Deck; Open deck/patio; Patio; Chain link fencing; Interior lot
Interior
- Kitchen: Disposal
- Flooring: Laminate flooring; Tile flooring
- Bathrooms: 2 full bathrooms
- Heating & cooling: Central electric cooling; Electric heating
- Interior features: Primary bedroom located downstairs; Cable TV available; Wood-burning fireplace
- Laundry & utility: Washer hookup; Dryer hookup; Separate meters
Neighborhood map
What this means for you Summary
Snapshot
- This is a 4-bed/2.0-bath single-family listed at $169k.
Deal economics
- At list price, monthly cash flow is $369 ($4k/yr) — positive.
- The deal already cash-flows at list — no discount required.
- Meets the 1% rule at list price ($2k rent vs $169k).
- Recommended offer: $166k (1.5% below list) — sets the bar for market timing.
- Cap rate 8.9% vs local median 3.6% in Corpus Christi — top-decile yield for the area; either an underpriced asset or a hidden risk that comps aren't pricing in. Stress-test before assuming the spread holds.
Location & tenants
- Location reads 78/100 on livability (#66 in TX, #2,404 nationally) — a middle-class / working-renter tenant base. Strengths: commute A+, cost of living A+, housing A+; Watch: crime F.
- Corpus Christi ISD (urban): math 31% / reading 35% proficiency, ranked #562 of 826 in TX (top 68%) — families likely to look elsewhere, expect single-tenant / working-renter base with shorter leases; 63% free/reduced lunch — lower-income household profile, screen leases tightly.
- Market conditions: Rents rising fast (+7.9%/yr); 142 active listings in the ZIP; 14 comparable units currently listed for rent nearby; rentals lingering (median 44d on market — plan ~5-8 weeks vacancy on turnover, expect pricing pressure); 64% of comp listings sitting > 30 days — soft ceiling on asking rent; 1,397 units permitted in Nueces County in 2024 (47 in 5+ unit buildings).
- This rent runs 44% of the median local income ($58k/yr) — at the standard rent-burdened threshold; future hikes will face affordability resistance.
Forward outlook
- Local home prices are declining (-3.0%/yr); year-one equity from $1k of loan paydown is wiped out by about $5k of value loss. Plan a longer hold.
- Nueces County population projected at +36% by 2050 — long-run rental-demand tailwind backs the buy-and-hold thesis.
- At projected returns (-3.0% appreciation + 7.9% rent growth), your $47k cash investment doubles in ~8 years — after that, you're playing with house money.
Negotiation context
- It's been on market 22 days — a 2% lower offer ($166k) is reasonable based on typical stale-listing flexibility.
- 3 sale attempts since 18y ago; this cycle's ask has dropped $21k (11%) from the opening price — seller is motivated, your offer sets the floor, not the list.
Risks & watch-outs
- Watch-outs: property tax is 2.6% of price; built in 1955 — expect roof / HVAC / electrical / plumbing capex.
- Climate carrying-cost: severe wind risk, 99% chance of damaging wind over 30y; extreme-heat days projected 7→26/yr by 2055 (HVAC capex compounding) — expect insurance premiums to compound above CPI over the hold.
Questions for the listing agent
- Built in 1955 — when were the roof, HVAC, electrical panel, plumbing, and water heater last replaced?
- Property tax is high relative to price — has the assessment been appealed recently, and will the sale trigger a re-assessment?
- Is there a deadline driving the sale (1031 exchange, divorce, estate, relocation)? That informs how much negotiation room exists.
- Crime grade is F in this area — have there been break-ins, vandalism, or insurance claims at this property in the last 3 years? What carrier currently insures it and at what premium?
- What's the average days-on-market for RENTAL listings here right now (not sales)? A rising rental-DOM trend means longer vacancies and softer asking-rent achievability than the comps imply.
- What's the recent tenant-quality profile in this submarket — average credit score on applications, eviction rate, late-payment / NSF rate, and stable-employment percentage? A property-management company in the area should have these aggregated.
- How much new for-sale + rental construction is in the pipeline within 1–3 miles? Heavy new supply typically softens prices + rents 12–24 months out; constrained supply supports both.
Investment metrics
- 1% rule
- 1.26% ✓
- Cap rate
- 8.91%
- Cash-on-cash
- 9.36%
- DSCR
- 1.42
- GRM
- 6.6
CMA / ARV
- ARV (on-the-fly)
- $236,037
- Comps found
- 12
Show comp detail 12 sales within ~0.75 mi
| Address | Dist | Beds/Ba | Sqft | Sold | Price | $/sf | Match |
|---|---|---|---|---|---|---|---|
| 3306 Norton St | 0.29mi | 4/1.5 | 2,031 (+6%) | 3mo | $249,000 | $123 | 73 |
| 3341 Casa Rosa Dr | 0.17mi | 4/2.0 | 2,138 (+11%) | 4mo | $170,000 | $80 | 70 |
| 1213 Ray Dr | 0.09mi | 3/3.0 (-1) | 2,054 (+7%) | 9mo | $129,900 | $63 | 68 |
| 3710 Pope Dr | 0.58mi | 3/2.0 (-1) | 1,808 (-6%) | 1mo | $264,900 | $147 | 58 |
| 3321 Casa Rosa Dr | 0.21mi | 3/2.0 (-1) | 1,678 (-13%) | 9mo | $239,900 | $143 | 57 |
| 1553 Casa Grande Dr | 0.47mi | 3/2.0 (-1) | 1,799 (-6%) | 8mo | $184,000 | $102 | 56 |
| 1010 Weber Pkwy | 0.63mi | 4/2.5 | 2,046 (+7%) | 3mo | $319,999 | $156 | 55 |
| 1509 Devon Dr | 0.71mi | 4/2.0 | 1,754 (-9%) | 2mo | $89,500 | $51 | 50 |
| 1038 Herndon St | 0.53mi | 3/2.0 (-1) | 1,769 (-8%) | 9mo | $279,500 | $158 | 50 |
| 3540 Pecan St | 0.35mi | 3/2.0 (-1) | 2,200 (+15%) | 8mo | $270,000 | $123 | 47 |
| 4021 Cott St | 0.68mi | 3/2.0 (-1) | 1,744 (-9%) | 9mo | $244,900 | $140 | 41 |
| 613 Brawner Pkwy | 0.66mi | 3/2.0 (-1) | 1,645 (-14%) | 3mo | $169,900 | $103 | 38 |
Match score weights: distance 35% · size 25% · config 20% · recency 20%. Top-matched comps best support the ARV.
Projected returns pro-forma
-3.0% appreciation · 7.91% rent growth · sell at horizon
- IRR
- 3.8%
- Equity multiple
- 1.15×
- Total profit
- $7,323
- Equity at exit
- $25,198
- IRR
- 17.8%
- Equity multiple
- 2.85×
- Total profit
- $87,495
- Equity at exit
- $14,612
Cash invested: $47,320 (down + closing). Projections, not guarantees.
Landlord ↔ Tenant lean methodology
- Overall (STATE)
- 87 Strongly Landlord-Friendly
- State Texas
- 87 Strongly Landlord-Friendly · R+5
- County
- — inherits STATE
- City
- — inherits STATE
ZIP-level market 78411
- Rents YoY
- 7.9%
- Active inventory
- 142
- Price-to-rent
- 6.6×
Monthly cashflow live
- Estimated rent
- $2,138 high interval (Pro) →
- Mortgage (P&I)
- −$886
- Tax from tax record
- −$363 /mo · $4,356/yr
- Insurance
- −$70
- HOA
- −$0
- Vacancy / Maint / Mgmt
- −$449
- Net cashflow
- $369
Break-even live
UW: 25.0% down · 7.5% · 30yr · 1.5% tax · 5.0% vac · 8.0% maint · 8.0% mgmt
Financing live
Cash to close
- Down payment
- $42,250
- Closing costs
- $5,070
- Reserves months
- —
- Total cash needed
- —
Loan-product check · same deal, 3 products live
Conventional
25% down · 7.5% · 30yr
- Down + closing
- —
- Monthly P&I
- —
- Monthly cashflow
- —
- DSCR
- —
- Eligible?
- —
Personal DTI + credit; lowest rate.
DSCR
20% down · 8.5% · 30yr
- Down + closing
- —
- Monthly P&I
- —
- Monthly cashflow
- —
- DSCR
- —
- Eligible?
- —
No personal income docs; deal must DSCR.
Hard money
10% down · 12.0% · 12mo
- Down + closing
- —
- Monthly P&I
- —
- Monthly cashflow
- —
- DSCR
- —
- Eligible?
- —
Short-term bridge; refi at stabilization.
Rent comps 14 comps
| Address | Beds | Baths | Sqft | Rent | $/sqft | DOM | Units | Dist |
|---|---|---|---|---|---|---|---|---|
| 3314 Casa de Palmas Dr Corpus Christi, TX | 3.0 | 2.0 | 1869 | $2,300 | $1.23 | 13d | 1 | 0.16mi |
| 3450 S Alameda St Corpus Christi, TX | 3.0 | 1.5 | 2342 | $1,350 | $0.58 | 43d | 1 | 0.64mi |
| 502 Brawner Pkwy Corpus Christi, TX | 3.0 | 2.0 | 2293 | $2,200 | $0.96 | 44d | 1 | 0.71mi |
| 1522 Cambridge Dr Corpus Christi, TX | 3.0 | 1.5 | 1278 | $1,600 | $1.25 | 43d | 1 | 0.77mi |
| 1446 Annapolis Dr Corpus Christi, TX | 3.0 | 2.0 | 1500 | $1,700 | $1.13 | 43d | 1 | 0.82mi |
| 1405 Annapolis Dr Corpus Christi, TX | 3.0 | 1.5 | 1502 | $2,000 | $1.33 | 13d | 1 | 0.85mi |
| 4005 Green Grove Dr Corpus Christi, TX | 3.0 | 2.0 | 1406 | $1,695 | $1.21 | 43d | 1 | 0.86mi |
| 625 Catalina Pl Corpus Christi, TX | 3.0 | 2.0 | 1750 | $2,100 | $1.20 | 13d | 1 | 0.92mi |
| 4241 Green Grove Dr Corpus Christi, TX | 3.0 | 2.0 | 1345 | $1,700 | $1.26 | 43d | 1 | 1.00mi |
| 225 Watson St Corpus Christi, TX | 3.0 | 1.0 | 1472 | $1,295 | $0.88 | 43d | 1 | 1.18mi |
| 4634 Weir Dr Corpus Christi, TX | 3.0 | 2.0 | 1540 | $1,800 | $1.17 | 43d | 1 | 1.24mi |
| 929 Dolphin Pl Corpus Christi, TX | 3.0 | 2.0 | 1508 | $2,095 | $1.39 | 21d | 1 | 1.24mi |
| 4845 Concord St Corpus Christi, TX | 4.0 | 2.0 | 1437 | $1,750 | $1.22 | 13d | 1 | 1.40mi |
| 417 Southern St Corpus Christi, TX | 4.0 | 2.5 | 2028 | $2,350 | $1.16 | 43d | 1 | 1.49mi |
Listing history 23 events
-
2026-06-18days on market $169,000 Active 22 DOM
-
2026-06-17days on market $169,000 Active 21 DOM
-
2026-06-16days on market $169,000 Active 20 DOM
-
2026-06-15days on market $169,000 Active 19 DOM
-
2026-06-14days on market $169,000 Active 17 DOM
-
2026-06-10days on market $169,000 Active 14 DOM
-
2026-06-09days on market $169,000 Active 13 DOM
-
2026-06-08days on market $169,000 Active 12 DOM
-
2026-06-07days on market $169,000 Active 11 DOM
-
2026-06-05days on market $169,000 Active 8 DOM
-
2026-06-03pricedays on market $169,000 Active 7 DOM
-
2026-06-02days on market $190,000 Active 6 DOM
-
2026-06-01days on market $190,000 Active 5 DOM
-
2026-05-31days on market $190,000 Active 4 DOM
-
2026-05-30days on market $190,000 Active 3 DOM
-
2026-05-26$190,000 Active
-
2025-02-17price $209,900
-
2025-02-14$229,900 Active
-
2021-06-10soldstatus
-
2021-06-10soldstatus
-
2008-10-02soldstatus
-
2008-09-29soldstatus 489-char remark
Show marketing remark (489 chars)
Charming 4 bedroom, 3 bath home with saltillo tile in living, dining and kitchen area. Bricked courtyard entrance with oak trees providing plenty of shade. Floor length windows bring outside in to living and dining areas. Beautiful plantation shutters in master bdrm and living areas. Fresh paint inside and out. Large utility room. New appliances. Refrigerator to STAY! MOVE IN READY! Home was originally designed w/ front wrap carport, brick on two sides, but could easily be closed in.
-
2008-02-25$129,900 489-char remark
Show marketing remark (489 chars)
Charming 4 bedroom, 3 bath home with saltillo tile in living, dining and kitchen area. Bricked courtyard entrance with oak trees providing plenty of shade. Floor length windows bring outside in to living and dining areas. Beautiful plantation shutters in master bdrm and living areas. Fresh paint inside and out. Large utility room. New appliances. Refrigerator to STAY! MOVE IN READY! Home was originally designed w/ front wrap carport, brick on two sides, but could easily be closed in.
ⓘ Source: listings_history table (triggers on properties + properties_extension) + one-shot
backfill from property_details.listing_events for pre-trigger history.
Tax reassessment forecast TX · Resets to sale price
- Current annual tax
- $4,356 · $363/mo
- Projected year-2 tax
- $4,356 · $363/mo
- Expected delta
- $0/yr ($0/mo · 0.0%)
ⓘ Screening estimate from a state-policy table — verify with the county assessor before closing.
Climate risk First Street
- Flood 1/10 Low FEMA zone X (unshaded) · 0% chance over 30 yrs
- Wildfire 1/10 Low
- Heat 10/10 Extreme 7 d/yr ≥107°F today · 26 d/yr by 30 yrs out
- Wind 9/10 Extreme 99% chance of damaging wind over 30 yrs
- Air quality 1/10 Low 0 unhealthy d/yr today · 0 by 30 yrs out
Nearby sold comps map
Loading sold comps map…
Walkable amenities ~0.75 mi
Loading nearby amenities…
Taxation est. · year 1
- Rental income
- $25,650
- − Mortgage interest
- −$9,467
- − Property taxes
- −$4,356
- − Insurance
- −$845
- − Repairs & maintenance
- −$2,052
- − Management
- −$2,052
- − Depreciation
- −$4,916
- Taxable income
- $1,962
- Est. tax owed @ 24.0%
- −$471
- After-tax cash flow
- $3,957/yr
For passive investors: Depreciation is non-cash, so a rental often shows a tax loss while cash-flowing — sheltering income. Rental losses are passive: they offset passive income freely, and up to $25,000/yr can offset ordinary (W-2) income if you actively participate and your MAGI is under $100k (phasing out to $0 by $150k); unused losses carry forward. On sale, claimed depreciation is recaptured at up to 25%, and gains may owe capital-gains tax (a 1031 exchange can defer both). Figures are a year-1 estimate at your 24.0% rate — not tax advice; consult a CPA.
Schools (NCES district)
- District
- Corpus Christi ISD
- NCES district ID
- 4815270
- Math proficiency
- 31% ▼ -18.00%
- Reading proficiency
- 35% ▼ -7.00%
- Median HH income
- $45,672
- Composite
- 28.27/100
- National rank
- #6793
- State rank
- #562 of 826 in TX
Livability — Corpus Christi
- Score
- 78/100
- State rank
- #66
- US rank
- #2404
Category grades
Schools grade is shown separately in the Schools card above.
Census & demographics
- Census place
- Corpus Christi, TX
- County
- Nueces County · 296,836 people
- City population
- 296,836
- Metro
- Corpus Christi, TX
- Population (ZIP)
- 23,682
- Household income
- $57,742
- Rent vs Own
- Severe rent burden
- 1284.0
Population outlook (Nueces County) Hauer SSP2
- Today (2025)
- 418,037 people
- By 2030
- 447,123 · +7.0%
- By 2040
- 505,911 · +21.0%
- By 2050
- 567,522 · +35.8%
- By 2075
- 729,686 · +74.6%
- By 2100
- 847,087 · +102.6%
Race, ethnicity, and origin ACS 2023
- Neighborhood character
- Majority Hispanic (58%)
- Race & ethnicity
- Hispanic / Latino 58% White 35% Two or more races 29% Black 3% Asian 2%
- Hispanic origin (detail)
- Mexican 51%
- Common ancestry
- Slovak 2% Italian 1% Serbian 1%
- Foreign-born
- 6% · Canada
- Languages at home
- 75% English-only · Spanish 23% Tagalog/Filipino 1% Other Indo-European 1%
Political lean MEDSL · Nueces
- 2024 margin
- R (+11.5) · D 43.8% · R 55.3%
- 2008→2024 swing
- -7.1pp toward R · 2008: -4.4pp · 2024: -11.5pp
- All cycles
- 2024: R+11.5 2020: R+2.9 2016: R+1.5 2012: R+3.2 2008: R+4.4
Not yet ingested
- Civics
- —
Market trends
- HPI YoY
- ▼ -265.71%
- Current HPI
- 191.7201
- Rent YoY
- ▲ 7.91%
- Metro
- Corpus Christi, TX
- State GDP YoY
- ▲ 3.95%
- F500 in state
- 110
Industry mix (Fortune 500 HQ in TX)
| Industry | F500 HQs | Revenue |
|---|---|---|
| Energy | 16 | $1,198B |
|
||
| Technology | 5 | $198B |
|
||
| Engineering / Construction | 4 | $72B |
|
||
| Energy Services | 3 | $60B |
|
||
| Utilities | 3 | $41B |
|
||
| Healthcare | 2 | $330B |
|
||
Price history
+46.3% since first listed8 events — show timeline
- 2026-05-26 Listed $190,000 CBMLS
- 2025-02-17 Price Changed $209,900 CBMLS
- 2025-02-14 Listed $229,900 CBMLS
- 2021-06-10 Sold (Public Records) — Public Records
- 2021-06-10 Sold (Public Records) — Public Records
- 2008-10-02 Sold (Public Records) — Public Records
- 2008-09-29 Sold (MLS) — CBMLS
- 2008-02-25 Listed $129,900 CBMLS
Property tax history
+2.8%/yrLatest (2025): $4,356 · +5.9% YoY. Source: county tax records.
Cash-flow waterfall
monthlySold comps — $/sqft
last 12 mo · ≤1 miLoading sold comps…