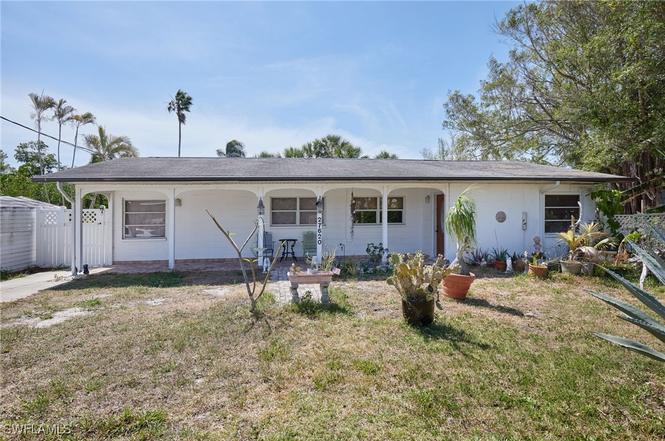
27620 Riverdale Ln · Bonita Springs, FL
Flood risk 10/10 · Severe
- FEMA flood zone
- AE
- Chance of flooding over 30 yrs
- 0.99%
- Est. flood insurance / yr
- $1,737 – $8,500
Fire risk 2/10 · Minimal
- Est. fire insurance / yr
- $947 – $1,759
Heat risk 10/10 · Severe
- Hot days now (above 107°F)
- 7 days/yr
- Hot days in 30 yrs
- 30 days/yr
Wind risk 10/10 · Severe
- Chance of severe wind over 30 yrs
- 99.0%
Air-quality risk 2/10 · Minimal
- Unhealthy air days now
- 1 days/yr
- Unhealthy air days in 30 yrs
- 1 days/yr
Risk factors via First Street. Map © Google.
Why this score? — see what drove the B grade
The composite is a weighted blend of 9 inputs, each scored 0–100. Each bar is that input's sub-score; the figure is the points it added to the 100-point composite (weight × sub-score).
- Cash flow +27.9/30.0
- ARV discount +15.0/15.0
- DSCR +9.9/10.0
- 1% rule +8.1/10.0
- Schools +4.1/10.0
- Livability +3.5/5.0
- Rent growth +3.2/5.0
- Condition / age +2.5/5.0
- Appreciation +0.0/10.0
$370,000
🖨 Deal sheet 📄 Offer letter ✓ Due diligence
Listing remarks
INVESTMENT OPPORTUNITY! Bring all offers! Home has been damaged by past hurricanes. Great location canal just off the Imperial River and just 2 miles to Bonita Beach!
Key facts
- 7,318 sq ft lot
- Parking
- Built 1971
Tags
Neighborhood map
What this means for you Summary
Snapshot
- This is a 3-bed/2.0-bath single-family listed at $370k.
Deal economics
- At list price, monthly cash flow is $709 ($9k/yr) — positive.
- The deal already cash-flows at list — no discount required.
- Meets the 1% rule at list price ($5k rent vs $370k).
- Recommended offer: $326k (12.0% below list) — sets the bar for market timing.
- Cap rate 10.0% vs local median 1.7% in Bonita Springs — top-decile yield for the area; either an underpriced asset or a hidden risk that comps aren't pricing in. Stress-test before assuming the spread holds.
Location & tenants
- Location reads 70/100 on livability (#428 in FL) — a middle-class / working-renter tenant base. Strengths: crime A+, housing A+, employment A; Watch: schools C-, cost of living C-, health & safety D.
- Lee (suburban): math 47% / reading 50% proficiency, ranked #42 of 73 in FL (top 58%) — families likely to look elsewhere, expect single-tenant / working-renter base with shorter leases.
- Market conditions: Rents rising (+2.9%/yr); 699 active listings in the ZIP; 40 comparable units currently listed for rent nearby; rentals at typical pace (median 24d on market — plan ~3-4 weeks tenant-placement turnaround); high-income renter base; 15,411 units permitted in Lee County in 2024 (4,686 in 5+ unit buildings).
- This rent runs 44% of the median local income ($131k/yr) — at the standard rent-burdened threshold; future hikes will face affordability resistance.
Forward outlook
- Local home prices are declining (-3.0%/yr); year-one equity from $3k of loan paydown is wiped out by about $11k of value loss. Plan a longer hold.
- Lee County population projected at +44% by 2050 — long-run rental-demand tailwind backs the buy-and-hold thesis.
Negotiation context
- It's been on market 227 days — a 12% lower offer ($326k) is reasonable based on typical stale-listing flexibility.
- 2 sale attempts; this cycle's ask has dropped $80k (18%) from the opening price — seller is motivated, your offer sets the floor, not the list.
- Current owner paid $135k; list at $370k implies a 174% gain — meaningful room to come down on a strong offer.
Risks & watch-outs
- Watch-outs: flood insurance adds $427/mo.
- Climate carrying-cost: in FEMA flood zone AE (mandatory federal flood insurance); severe wind risk, 99% chance of damaging wind over 30y; extreme-heat days projected 7→30/yr by 2055 (HVAC capex compounding) — expect insurance premiums to compound above CPI over the hold.
Questions for the listing agent
- It's been on market 227 days. Have you received any prior offers? Is the seller open to a 12% concession, seller financing, or rate buy-down credit?
- Built in 1971 — when were the roof, HVAC, electrical panel, plumbing, and water heater last replaced?
- What's the actual annual flood-insurance premium (NFIP or private), and is the property in a SFHA with mandatory coverage?
- Why hasn't it sold? Are there any deal-killer items the seller is aware of (foundation, flood, title, zoning, code violations)?
- Is there a deadline driving the sale (1031 exchange, divorce, estate, relocation)? That informs how much negotiation room exists.
- What's the average days-on-market for RENTAL listings here right now (not sales)? A rising rental-DOM trend means longer vacancies and softer asking-rent achievability than the comps imply.
- What's the recent tenant-quality profile in this submarket — average credit score on applications, eviction rate, late-payment / NSF rate, and stable-employment percentage? A property-management company in the area should have these aggregated.
- How much new for-sale + rental construction is in the pipeline within 1–3 miles? Heavy new supply typically softens prices + rents 12–24 months out; constrained supply supports both.
Investment metrics
- 1% rule
- 1.31% ✓
- Cap rate
- 9.98%
- Cash-on-cash
- 13.16%
- DSCR
- 1.59
- GRM
- 6.4
CMA / ARV
- ARV (on-the-fly)
- $446,736
- Comps found
- 2
Show comp detail 2 sales within ~0.75 mi
| Address | Dist | Beds/Ba | Sqft | Sold | Price | $/sf | Match |
|---|---|---|---|---|---|---|---|
| 3980 Quails Walk | 0.23mi | 3/2.0 | 1,216 (-11%) | 2mo | $380,000 | $313 | 70 |
| 28230 Meadowlark Ln | 0.66mi | 3/2.0 | 1,434 (+5%) | 15mo | $470,000 | $328 | 48 |
Match score weights: distance 35% · size 25% · config 20% · recency 20%. Top-matched comps best support the ARV.
Projected returns pro-forma
-3.0% appreciation · 2.85% rent growth · sell at horizon
- IRR
- -3.9%
- Equity multiple
- 0.85×
- Total profit
- $-15,096
- Equity at exit
- $55,168
- IRR
- 5.7%
- Equity multiple
- 1.42×
- Total profit
- $43,717
- Equity at exit
- $31,991
Cash invested: $103,600 (down + closing). Projections, not guarantees.
Landlord ↔ Tenant lean methodology
- Overall (STATE)
- 87 Strongly Landlord-Friendly
- State Florida
- 87 Strongly Landlord-Friendly · R+3
- County
- — inherits STATE
- City
- — inherits STATE
ZIP-level market 34134
- Rents YoY
- 2.9%
- Active inventory
- 699
- Price-to-rent
- 6.4×
Monthly cashflow live
- Estimated rent
- $4,830 high interval (Pro) →
- Mortgage (P&I)
- −$1,940
- Tax from tax record
- −$585 /mo · $7,023/yr
- Insurance
- −$154
- Flood insurance flood zone
- −$427 /mo · $5,118/yr
- HOA
- −$0
- Vacancy / Maint / Mgmt
- −$1,014
- Net cashflow
- $709
Break-even live
UW: 25.0% down · 7.5% · 30yr · 1.5% tax · 5.0% vac · 8.0% maint · 8.0% mgmt
Financing live
Cash to close
- Down payment
- $92,500
- Closing costs
- $11,100
- Reserves months
- —
- Total cash needed
- —
Loan-product check · same deal, 3 products live
Conventional
25% down · 7.5% · 30yr
- Down + closing
- —
- Monthly P&I
- —
- Monthly cashflow
- —
- DSCR
- —
- Eligible?
- —
Personal DTI + credit; lowest rate.
DSCR
20% down · 8.5% · 30yr
- Down + closing
- —
- Monthly P&I
- —
- Monthly cashflow
- —
- DSCR
- —
- Eligible?
- —
No personal income docs; deal must DSCR.
Hard money
10% down · 12.0% · 12mo
- Down + closing
- —
- Monthly P&I
- —
- Monthly cashflow
- —
- DSCR
- —
- Eligible?
- —
Short-term bridge; refi at stabilization.
Rent comps 40 comps
| Address | Beds | Baths | Sqft | Rent | $/sqft | DOM | Units | Dist |
|---|---|---|---|---|---|---|---|---|
| 27625 Riverdale Ln Unit 27627 Bonita Springs, FL | 2.0 | 1.0 | 960 | $1,795 | $1.87 | 24d | 1 | 0.01mi |
| 27594 Shore Dr Bonita Springs, FL | 3.0 | 2.0 | 1426 | $5,500 | $3.86 | 24d | 1 | 0.05mi |
| 4212 Rita Ln Bonita Springs, FL | 2.0 | 2.0 | 1428 | $1,475 | $1.03 | 24d | 1 | 0.27mi |
| 27921 Bonita Village Blvd Bonita Springs, FL | 2.0–3.0 | 2.0 | 1429 | $3,745 | $2.62 | 24d | 3 | 0.31mi |
| 27579 Big Bend Rd Bonita Springs, FL | 3.0 | 2.0 | 1512 | $2,700 | $1.79 | 24d | 1 | 0.41mi |
| 4426 Little Hickory Rd Bonita Springs, FL | 2.0 | 1.0 | 979 | $1,900 | $1.94 | 19d | 1 | 0.46mi |
| 11 2nd St Bonita Springs, FL | 3.0 | 2.0 | 1595 | $9,500 | $5.96 | 23d | 1 | 0.49mi |
| 3503 Brink Cir Bonita Springs, FL | 2.0 | 3.0 | 1300 | $2,200 | $1.69 | 24d | 1 | 0.51mi |
| 4412 Vanda Dr Bonita Springs, FL | 3.0 | 2.0 | 1800 | $2,800 | $1.56 | 24d | 1 | 0.51mi |
| 3463 Brink Cir Bonita Springs, FL | 2.0 | 1.0 | 1000 | $2,150 | $2.15 | 24d | 1 | 0.53mi |
| 27581 Imperial Shores Blvd Unit 2 Bonita Springs, FL | 2.0 | 2.0 | 900 | $1,900 | $2.11 | 3d | 1 | 0.53mi |
| 28178 Sunset Dr Bonita Springs, FL | 2.0 | 1.0 | 936 | $2,550 | $2.72 | 21d | 1 | 0.54mi |
| 27585 Imperial Shores Blvd Bonita Springs, FL | 3.0 | 3.0 | 1576 | $8,000 | $5.08 | 24d | 1 | 0.55mi |
| 27080 Lake Harbor Ct #202 Bonita Springs, FL | 3.0 | 2.0 | 1654 | $7,200 | $4.35 | 24d | 1 | 0.56mi |
| 27080 Lake Harbor Ct #201 Bonita Springs, FL | 3.0 | 2.0 | 1764 | $7,500 | $4.25 | 24d | 1 | 0.56mi |
| 4240 Lake Forest Dr #423 Bonita Springs, FL | 2.0 | 2.0 | 1450 | $6,500 | $4.48 | 24d | 1 | 0.58mi |
| 27190 Oakwood Lake Dr #102 Bonita Springs, FL | 3.0 | 2.0 | 1603 | $7,500 | $4.68 | 24d | 1 | 0.59mi |
| 75 3rd St Bonita Springs, FL | 3.0 | 3.0 | 1630 | $8,900 | $5.46 | 23d | 1 | 0.60mi |
| 4251 Lake Forest Dr #214 Bonita Springs, FL | 2.0 | 2.0 | 1393 | $6,000 | $4.31 | 24d | 1 | 0.60mi |
| 4111 Lake Forest Dr #523 Bonita Springs, FL | 2.0 | 2.0 | 1393 | $5,000 | $3.59 | 24d | 1 | 0.64mi |
| 60 4th St Bonita Springs, FL | 3.0 | 2.0 | 1860 | $11,400 | $6.13 | 23d | 1 | 0.66mi |
| 27038 Oakwood Lake Dr Bonita Springs, FL | 3.0 | 3.0 | 1818 | $8,500 | $4.68 | 24d | 1 | 0.69mi |
| 64 4th St Bonita Springs, FL | 2.0 | 2.0 | 1231 | $3,700 | $3.01 | 23d | 2 | 0.70mi |
| 3561 Imperial Crossing Dr Bonita Springs, FL | 1.0–3.0 | 1.0–2.0 | 1122 | $3,650 | $3.25 | 3d | 19 | 0.71mi |
| 27119 Oakwood Lake Dr Bonita Springs, FL | 3.0 | 2.5 | 1812 | $7,500 | $4.14 | 24d | 1 | 0.73mi |
| 4851 Gary Rd Bonita Springs, FL | 2.0 | 1.0 | 1281 | $2,250 | $1.76 | 24d | 1 | 0.74mi |
| 4860 Gary Rd Unit 4 Bonita Springs, FL | 3.0 | 2.0 | 1875 | $2,900 | $1.55 | 24d | 1 | 0.76mi |
| 27052 Kindlewood Ln Bonita Springs, FL | 2.0 | 2.0 | 1584 | $3,700 | $2.34 | 3d | 1 | 0.83mi |
| 26930 Wedgewood Dr #202 Bonita Springs, FL | 2.0 | 2.0 | 1620 | $5,500 | $3.40 | 24d | 1 | 0.84mi |
| 4041 Whiskey Pointe Ln #102 Bonita Springs, FL | 2.0 | 2.0 | 1345 | $6,500 | $4.83 | 24d | 1 | 0.85mi |
| 26881 Wedgewood Dr #201 Bonita Springs, FL | 3.0 | 2.0 | 1640 | $8,000 | $4.88 | 24d | 1 | 0.85mi |
| 74 7th St Bonita Springs, FL | 3.0 | 2.0 | 1124 | $3,150 | $2.80 | 23d | 1 | 0.86mi |
| 26850 Wedgewood Dr #202 Bonita Springs, FL | 3.0 | 3.0 | 1781 | $8,500 | $4.77 | 24d | 1 | 0.87mi |
| 27123 Kindlewood Ln Bonita Springs, FL | 2.0 | 2.0 | 1715 | $4,500 | $2.62 | 24d | 1 | 0.89mi |
| 3941 Leeward Passage Ct #203 Bonita Springs, FL | 2.0 | 2.0 | 1204 | $2,000 | $1.66 | 24d | 1 | 0.91mi |
| 8659 River Homes Ln #1307 Bonita Springs, FL | 2.0 | 2.0 | 1087 | $1,850 | $1.70 | 19d | 1 | 0.91mi |
| 8659 River Homes Ln #1108 Bonita Springs, FL | 2.0 | 2.0 | 1087 | $4,500 | $4.14 | 24d | 1 | 0.91mi |
| 62 8th St Unit 1073526P Bonita Springs, FL | 2.0 | 2.0 | 1593 | $5,435 | $3.41 | 23d | 1 | 0.92mi |
| 3921 Leeward Passage Ct #203 Bonita Springs, FL | 2.0 | 2.0 | 1204 | $3,500 | $2.91 | 24d | 1 | 0.93mi |
| 4120 Bayhead Dr #303 Bonita Springs, FL | 2.0 | 2.0 | 1523 | $7,000 | $4.60 | 24d | 1 | 0.94mi |
Listing history 8 events
-
2025-12-11status Pending
-
2025-11-21status Active
-
2025-11-03status Pending
-
2025-08-01price $370,000
-
2025-06-06price $395,000
-
2025-04-10$450,000 Active
-
1998-01-29soldstatus $135,000
-
1991-06-05soldstatus $120,000
ⓘ Source: listings_history table (triggers on properties + properties_extension) + one-shot
backfill from property_details.listing_events for pre-trigger history.
Tax reassessment forecast FL · Resets to sale price
- Current annual tax
- $7,023 · $585/mo
- Projected year-2 tax
- $7,023 · $585/mo
- Expected delta
- $0/yr ($0/mo · 0.0%)
ⓘ Screening estimate from a state-policy table — verify with the county assessor before closing.
Climate risk First Street
- Flood 10/10 Extreme FEMA zone AE · 99% chance over 30 yrs
- Wildfire 2/10 Low
- Heat 10/10 Extreme 7 d/yr ≥107°F today · 30 d/yr by 30 yrs out
- Wind 10/10 Extreme 99% chance of damaging wind over 30 yrs
- Air quality 2/10 Low 1 unhealthy d/yr today · 1 by 30 yrs out
Nearby sold comps map
Loading sold comps map…
Walkable amenities ~0.75 mi
Loading nearby amenities…
Taxation est. · year 1
- Rental income
- $57,959
- − Mortgage interest
- −$20,726
- − Property taxes
- −$7,023
- − Insurance
- −$6,968
- − Repairs & maintenance
- −$4,637
- − Management
- −$4,637
- − Depreciation
- −$10,764
- Taxable income
- $3,204
- Est. tax owed @ 24.0%
- −$769
- After-tax cash flow
- $7,743/yr
For passive investors: Depreciation is non-cash, so a rental often shows a tax loss while cash-flowing — sheltering income. Rental losses are passive: they offset passive income freely, and up to $25,000/yr can offset ordinary (W-2) income if you actively participate and your MAGI is under $100k (phasing out to $0 by $150k); unused losses carry forward. On sale, claimed depreciation is recaptured at up to 25%, and gains may owe capital-gains tax (a 1031 exchange can defer both). Figures are a year-1 estimate at your 24.0% rate — not tax advice; consult a CPA.
Schools (NCES district)
- District
- Lee
- NCES district ID
- 1201080
- Math proficiency
- 47% ▼ -11.00%
- Reading proficiency
- 50% ▼ -4.00%
- Median HH income
- $49,518
- Composite
- 41.49/100
- National rank
- #3458
- State rank
- #42 of 73 in FL
Livability — Bonita Springs
- Score
- 70/100
- State rank
- #428
- US rank
- #7576
Category grades
Schools grade is shown separately in the Schools card above.
Census & demographics
- Census place
- Bonita Springs, FL
- County
- Lee County · 788,662 people
- City population
- 64,727
- Metro
- Cape Coral-Fort Myers, FL
- Population (ZIP)
- 16,475
- Household income
- $130,719
- Rent vs Own
- Severe rent burden
- 554.0
Population outlook (Lee County) Hauer SSP2
- Today (2025)
- 871,946 people
- By 2030
- 955,468 · +9.6%
- By 2040
- 1,113,587 · +27.7%
- By 2050
- 1,256,891 · +44.1%
- By 2075
- 1,560,270 · +78.9%
- By 2100
- 1,726,848 · +98.0%
Race, ethnicity, and origin ACS 2023
- Neighborhood character
- Predominantly White (91%)
- Race & ethnicity
- White 91% Hispanic / Latino 5% Two or more races 3% Asian 1%
- Common ancestry
- Slovak 5% Romanian 4% Serbian 2%
- Foreign-born
- 10% · Canada, Jamaica
- Languages at home
- 91% English-only · Spanish 4% German/W. Germanic 1% Other Indo-European 1%
Political lean MEDSL · Lee
- 2024 margin
- Strong R (+28.4) · D 35.5% · R 63.9%
- 2008→2024 swing
- -18.0pp toward R · 2008: -10.4pp · 2024: -28.4pp
- All cycles
- 2024: R+28.4 2020: R+19.2 2016: R+20.4 2012: R+16.6 2008: R+10.4
Not yet ingested
- Civics
- —
Market trends
- HPI YoY
- ▼ -236.48%
- Current HPI
- 237.4416
- Rent YoY
- ▲ 2.85%
- Metro
- Cape Coral-Fort Myers, FL
- State GDP YoY
- ▲ 3.28%
- F500 in state
- 36
Industry mix (Fortune 500 HQ in FL)
| Industry | F500 HQs | Revenue |
|---|---|---|
| Industrial Technology | 2 | $29B |
|
||
| Insurance | 2 | $17B |
|
||
| Retail | 1 | $60B |
|
||
| Technology Distribution | 1 | $58B |
|
||
| Homebuilding | 1 | $35B |
|
||
| Technology Manufacturing | 1 | $35B |
|
||
Price history
+208.3% since first listed8 events — show timeline
- 2025-12-11 Pending — FORTMLS
- 2025-11-21 Relisted — FORTMLS
- 2025-11-03 Pending — FORTMLS
- 2025-08-01 Price Changed $370,000 FORTMLS
- 2025-06-06 Price Changed $395,000 FORTMLS
- 2025-04-10 Listed $450,000 FORTMLS
- 1998-01-29 Sold (Public Records) $135,000 Public Records
- 1991-06-05 Sold (Public Records) $120,000 Public Records
Property tax history
+5.4%/yrLatest (2025): $7,023 · +510.1% YoY. Source: county tax records.
Cash-flow waterfall
monthlySold comps — $/sqft
last 12 mo · ≤1 miLoading sold comps…