5711 Columbia #82 · Quartz Hill, CA
Flood risk 1/10 · Minimal
- FEMA flood zone
- X (unshaded)
- Chance of flooding over 30 yrs
- 0.0%
- Est. flood insurance / yr
- $507 – $1,088
Fire risk 8/10 · Major
- Est. fire insurance / yr
- $659 – $1,223
Heat risk 6/10 · Moderate
- Hot days now (above 97°F)
- 4 days/yr
- Hot days in 30 yrs
- 10 days/yr
Wind risk 1/10 · Minimal
- Chance of severe wind over 30 yrs
- —
Air-quality risk 10/10 · Severe
- Unhealthy air days now
- 28 days/yr
- Unhealthy air days in 30 yrs
- 33 days/yr
Risk factors via First Street. Map © Google.
Why this score? — see what drove the B- grade
The composite is a weighted blend of 9 inputs, each scored 0–100. Each bar is that input's sub-score; the figure is the points it added to the 100-point composite (weight × sub-score).
- Cash flow +30.0/30.0
- 1% rule +10.0/10.0
- DSCR +10.0/10.0
- ARV discount +7.5/15.0
- Schools +4.1/10.0
- Livability +2.9/5.0
- Condition / age +2.5/5.0
- Rent growth +2.2/5.0
- Appreciation +0.0/10.0
$99,999
🖨 Deal sheet (PDF) 📄 Offer letter ✓ Due diligence
Listing remarks MLS
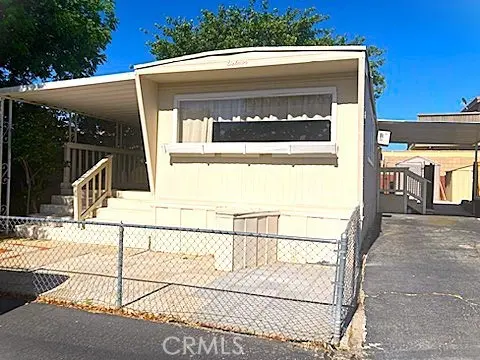
Here is a great opportunity to buy this lovely little mobile home and start your journey toward homeownership. This unit of 1 bed 1 bath with approx. 612 sqft has been recently renovated with new paint, flooring, and windows. It sits on a generously sized lot; the backyard features a large tree that offers welcome shade just as summer begins. Come take a look and see for yourself how comfortable it is.
Key facts
- Generously sized lot
- Recently renovated
- 19.83 acre lot
Tags
Property features AI
Finance
- Other: Lot density approximately 6–10 units per acre; Living area source: Assessor's data; Lot size source: Other
- HOA & community: Park-managed community (manager approval required)
Exterior
- Parking: Located within QH Mobile Home Park
- Utilities: Public sewer; District/public water
- Home design: Single-family mobile home; Single-story; Entry on main level; Facing direction not specified
- Construction: Mobile home — approximately 12 ft by 51 ft; Year built referenced in remarks
- Exterior features: In-ground community pool; Street lighting; Suburban setting; Mobile home remains on site; Model: Sportcraft
Interior
- Kitchen: Garbage disposal; Gas oven; Dishwasher
- Bathrooms: 1 full bathroom
- Heating & cooling: Wall/window cooling; Heating details noted in remarks
- Interior features: One-level home; Entry at ground level
- Laundry & utility: Laundry in an individual room
Neighborhood map
What this means for you Summary
Snapshot
- This is a 1-bed/1.0-bath manufactured listed at $100k.
Deal economics
- At list price, monthly cash flow is $738 ($9k/yr) — positive.
- The deal already cash-flows at list — no discount required.
- Meets the 1% rule at list price ($2k rent vs $100k).
- Cap rate 15.2% vs local median 4.1% in Quartz Hill — top-decile yield for the area; either an underpriced asset or a hidden risk that comps aren't pricing in. Stress-test before assuming the spread holds.
Location & tenants
- Location reads 58/100 on livability (#703 in CA) — a working-class tenant base; expect higher turnover. Strengths: employment A+, housing A+; Watch: crime D-, amenities F, commute F.
- Westside Union Elementary (suburban): math 34% / reading 49% proficiency, ranked #565 of 1,400 in CA (top 40%) — families likely to look elsewhere, expect single-tenant / working-renter base with shorter leases.
- Zoned schools: Gregg Anderson Academy (math 24% / reading 24%, grade F, #973 of 1,571 statewide, top 73%, 867 students, 27% FRL); Joe Walker Middle (736 students, 60% FRL); Quartz Hill High (3,066 students, 42% FRL).
- Zoned-school proficiency averages 24% at this address vs 42% district-wide (-17 pts) — the specific schools serving this property underperform the Westside Union Elementary average; the district grade overstates school quality for this exact location.
- Market conditions: Rents soft (-1.2%/yr); 1140 active listings in the ZIP; 1 comparable units currently listed for rent nearby; solid renter incomes; 19,697 units permitted in Los Angeles County in 2024 (9,426 in 5+ unit buildings).
Forward outlook
- Local home prices are declining (-3.0%/yr); year-one equity from $691 of loan paydown is wiped out by about $3k of value loss. Plan a longer hold.
- Los Angeles County population projected at +9% by 2050 — modest demand growth; plan on rents tracking national, not racing it.
- At projected returns (-3.0% appreciation + 0.0% rent growth), your $28k cash investment doubles in ~5 years — after that, you're playing with house money.
Negotiation context
- Only 12 days on market — expect competitive offers; lowballing is unlikely to land.
- 6 sale attempts since 8y ago with the ask held roughly flat each time — persistent listings suggest the price (not the market) is what's stuck; bring a comps-based counter.
- Current owner paid $70k; 43% above their basis — modest negotiation headroom, anchor on the comps not their cost.
Risks & watch-outs
- Climate carrying-cost: severe wildfire risk; extreme-heat days projected 4→10/yr by 2055 (HVAC capex compounding) — expect insurance premiums to compound above CPI over the hold.
Questions for the listing agent
- Built in 1966 — when were the roof, HVAC, electrical panel, plumbing, and water heater last replaced?
- Is there a deadline driving the sale (1031 exchange, divorce, estate, relocation)? That informs how much negotiation room exists.
- Schools are D-rated, which usually means shorter tenancies and higher turnover. Who's the typical renter profile here, and what's been the actual vacancy rate?
- Crime grade is D in this area — have there been break-ins, vandalism, or insurance claims at this property in the last 3 years? What carrier currently insures it and at what premium?
- What's the average days-on-market for RENTAL listings here right now (not sales)? A rising rental-DOM trend means longer vacancies and softer asking-rent achievability than the comps imply.
- What's the recent tenant-quality profile in this submarket — average credit score on applications, eviction rate, late-payment / NSF rate, and stable-employment percentage? A property-management company in the area should have these aggregated.
- How much new for-sale + rental construction is in the pipeline within 1–3 miles? Heavy new supply typically softens prices + rents 12–24 months out; constrained supply supports both.
Investment metrics
- 1% rule
- 1.81% ✓
- Cap rate
- 15.15%
- Cash-on-cash
- 31.63%
- DSCR
- 2.41
- GRM
- 4.6
CMA / ARV
No comps found within radius.
Projected returns pro-forma
-3.0% appreciation · 0.0% rent growth · sell at horizon
- IRR
- 23.1%
- Equity multiple
- 1.91×
- Total profit
- $25,533
- Equity at exit
- $14,910
- IRR
- 29.1%
- Equity multiple
- 3.23×
- Total profit
- $62,390
- Equity at exit
- $8,646
Cash invested: $28,000 (down + closing). Projections, not guarantees.
Landlord ↔ Tenant lean methodology
- Overall (STATE)
- 18 Strongly Tenant-Friendly
- State California
- 18 Strongly Tenant-Friendly · D+13
- County
- — inherits STATE
- City
- — inherits STATE
ZIP-level market 93536
- Rents YoY
- -1.2%
- Active inventory
- 1140
- Price-to-rent
- 4.6×
Monthly cashflow live
- Estimated rent
- $1,809 medium interval (Pro) →
- Mortgage (P&I)
- −$524
- Tax est. 1.5%
- −$125 /mo · $1,500/yr
- Insurance
- −$42
- HOA
- −$0
- Vacancy / Maint / Mgmt
- −$380
- Net cashflow
- $738
Break-even live
Sensitivity live
| Price | -10% $807 | -5% $773 | +0% $738 | +5% $704 | +10% $669 |
|---|---|---|---|---|---|
| Rent | -10% $595 | -5% $667 | +0% $738 | +5% $810 | +10% $881 |
| Rate | -1.0pp $788 | -0.5pp $764 | base $738 | +0.5pp $712 | +1.0pp $686 |
UW: 25.0% down · 7.5% · 30yr · 1.5% tax · 5.0% vac · 8.0% maint · 8.0% mgmt
Financing live
Cash to close
- Down payment
- $25,000
- Closing costs
- $3,000
- Reserves months
- —
- Total cash needed
- —
Loan-product check · same deal, 3 products live
Conventional
25% down · 7.5% · 30yr
- Down + closing
- —
- Monthly P&I
- —
- Monthly cashflow
- —
- DSCR
- —
- Eligible?
- —
Personal DTI + credit; lowest rate.
DSCR
20% down · 8.5% · 30yr
- Down + closing
- —
- Monthly P&I
- —
- Monthly cashflow
- —
- DSCR
- —
- Eligible?
- —
No personal income docs; deal must DSCR.
Hard money
10% down · 12.0% · 12mo
- Down + closing
- —
- Monthly P&I
- —
- Monthly cashflow
- —
- DSCR
- —
- Eligible?
- —
Short-term bridge; refi at stabilization.
Rent comps 1 comps
| Address | Beds | Baths | Sqft | Rent | $/sqft | DOM | Units | Dist |
|---|---|---|---|---|---|---|---|---|
| 6570 West Avenue L Lancaster, CA | 1.0 | 1.0 | 531 | $1,645 | $3.10 | 0d | 1 | 0.78mi |
Listing history 9 events
-
2026-06-21days on market $99,999 Active 12 DOM
-
2026-06-18days on market $99,999 Active 9 DOM
-
2026-06-17days on market $99,999 Active 8 DOM
-
2026-06-16days on market $99,999 Active 7 DOM
-
2026-06-15days on market $99,999 Active 6 DOM
-
2026-06-13days on market $99,999 Active 4 DOM
-
2026-06-13days on market $99,999 Active 3 DOM
-
2026-06-10remarks 405-char remark
-
2026-06-10$99,999 Active 1 DOM
ⓘ Source: listings_history table (triggers on properties + properties_extension) + one-shot
backfill from property_details.listing_events for pre-trigger history.
Climate risk First Street
- Flood 1/10 Low FEMA zone X (unshaded) · 0% chance over 30 yrs
- Wildfire 8/10 Severe
- Heat 6/10 Major 4 d/yr ≥97°F today · 10 d/yr by 30 yrs out
- Wind 1/10 Low
- Air quality 10/10 Extreme 28 unhealthy d/yr today · 33 by 30 yrs out
Nearby sold comps map
Loading sold comps map…
Walkable amenities ~0.75 mi
Loading nearby amenities…
Taxation est. · year 1
- Rental income
- $21,709
- − Mortgage interest
- −$5,601
- − Property taxes
- −$1,500
- − Insurance
- −$500
- − Repairs & maintenance
- −$1,737
- − Management
- −$1,737
- − Depreciation
- −$2,909
- Taxable income
- $7,725
- Est. tax owed @ 24.0%
- −$1,854
- After-tax cash flow
- $7,003/yr
For passive investors: Depreciation is non-cash, so a rental often shows a tax loss while cash-flowing — sheltering income. Rental losses are passive: they offset passive income freely, and up to $25,000/yr can offset ordinary (W-2) income if you actively participate and your MAGI is under $100k (phasing out to $0 by $150k); unused losses carry forward. On sale, claimed depreciation is recaptured at up to 25%, and gains may owe capital-gains tax (a 1031 exchange can defer both). Figures are a year-1 estimate at your 24.0% rate — not tax advice; consult a CPA.
Schools (NCES district)
- District
- Westside Union Elementary
- NCES district ID
- 0642120
- Math proficiency
- 34% ▲ 1.00%
- Reading proficiency
- 49% ▲ 1.00%
- Median HH income
- $80,763
- Composite
- 41.01/100
- National rank
- #7473
- State rank
- #565 of 1400 in CA
Livability — Quartz Hill
- Score
- 58/100
- State rank
- #703
- US rank
- #21208
Category grades
Schools grade is shown separately in the Schools card above.
Census & demographics
- Census place
- Quartz Hill, CA
- County
- Los Angeles County · 9,444,647 people
- Metro
- Los Angeles-Long Beach-Anaheim, CA
- Population (ZIP)
- 73,412
- Household income
- $106,903
- Rent vs Own
- Severe rent burden
- 1998.0
Population outlook (Los Angeles County) Hauer SSP2
- Today (2025)
- 10,940,515 people
- By 2030
- 11,256,481 · +2.9%
- By 2040
- 11,729,929 · +7.2%
- By 2050
- 11,948,407 · +9.2%
- By 2075
- 11,818,114 · +8.0%
- By 2100
- 10,842,928 · -0.9%
Race, ethnicity, and origin ACS 2023
- Neighborhood character
- Diverse neighborhood (Simpson 0.69)
- Race & ethnicity
- White 39% Hispanic / Latino 37% Two or more races 19% Black 13% Asian 5% Native American 1%
- Hispanic origin (detail)
- Mexican 28%
- Common ancestry
- Lithuanian 2% Slovak 1% Italian 1%
- Foreign-born
- 14% · Canada, China
- Languages at home
- 75% English-only · Spanish 19% Tagalog/Filipino 2% Arabic 1%
Political lean MEDSL · Los Angeles
- 2024 margin
- Solid D (+32.9) · D 64.8% · R 31.9% · Other 3.3%
- 2008→2024 swing
- -7.4pp toward R · 2008: 40.4pp · 2024: 32.9pp
- All cycles
- 2024: D+32.9 2020: D+44.2 2016: D+48.0 2012: D+40.0 2008: D+40.4
Not yet ingested
- Civics
- —
Market trends
- HPI YoY
- ▼ -268.64%
- Current HPI
- 357.0605
- Rent YoY
- ▼ -1.20%
- Metro
- Los Angeles-Long Beach-Anaheim, CA
- State GDP YoY
- ▲ 3.21%
- F500 in state
- 116
Industry mix (Fortune 500 HQ in CA)
| Industry | F500 HQs | Revenue |
|---|---|---|
| Technology | 27 | $1,492B |
|
||
| Financial Services | 3 | $174B |
|
||
| Retail | 3 | $44B |
|
||
| Insurance | 3 | $26B |
|
||
| Media / Entertainment | 2 | $115B |
|
||
| Pharmaceuticals / Biotech | 2 | $62B |
|
||
Price history
+170.3% since first listed22 events — show timeline
- 2026-06-09 Listed $99,999 CRMLS
- 2026-06-08 Listed $99,999 AVMLS
- 2024-11-01 Listing Removed — CRMLS
- 2024-10-11 Price Changed $80,000 AVMLS
- 2024-10-11 Price Changed $80,000 CRMLS
- 2024-08-16 Price Changed $89,990 CRMLS
- 2024-08-13 Price Changed $89,990 AVMLS
- 2024-07-26 Price Changed $99,000 AVMLS
- 2024-07-26 Price Changed $99,000 CRMLS
- 2024-07-02 Listed $114,990 CRMLS
- 2023-07-12 Sold (MLS) $70,000 AVMLS
- 2023-07-12 Sold (MLS) $70,000 CRMLS
- 2023-07-11 Pending — CRMLS
- 2023-06-30 Sold (MLS) $70,000 CRMLS
- 2023-05-28 Pending — CRMLS
- 2023-05-28 Pending — AVMLS
- 2023-05-22 Listed $70,000 AVMLS
- 2023-05-22 Listed $70,000 CRMLS
- 2018-10-05 Listing Removed — AVMLS
- 2018-10-03 Sold (MLS) $35,000 AVMLS
- 2018-09-18 Pending — AVMLS
- 2018-09-14 Listed $37,000 AVMLS
Cash-flow waterfall
monthlySold comps — $/sqft
last 12 mo · ≤1 miLoading sold comps…