 🏷️ Likely Rental
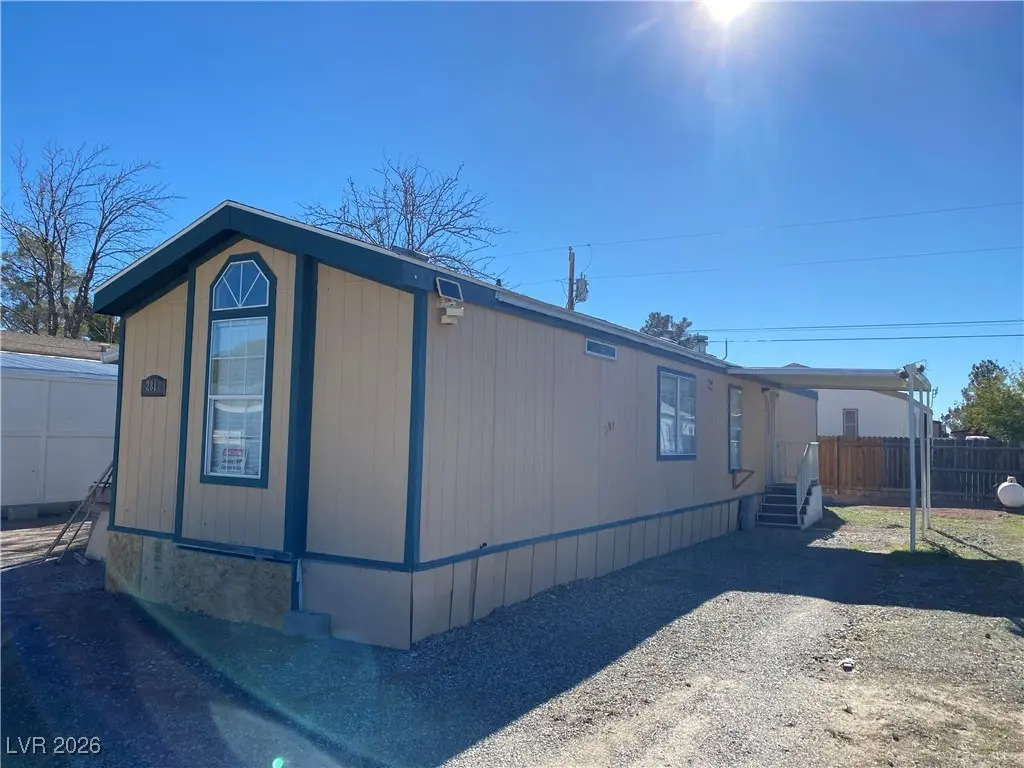
281 W Ellendale St · Pahrump, NV
Flood risk 1/10 · Minimal
- FEMA flood zone
- X (shaded)
- Chance of flooding over 30 yrs
- 0.0%
- Est. flood insurance / yr
- $507 – $1,088
Fire risk 4/10 · Minor
- Est. fire insurance / yr
- $490 – $910
Heat risk 7/10 · Major
- Hot days now (above 103°F)
- 5 days/yr
- Hot days in 30 yrs
- 13 days/yr
Wind risk 1/10 · Minimal
- Chance of severe wind over 30 yrs
- —
Air-quality risk 1/10 · Minimal
- Unhealthy air days now
- 0 days/yr
- Unhealthy air days in 30 yrs
- 0 days/yr
Risk factors via First Street. Map © Google.
Why this score? — see what drove the C+ grade
The composite is a weighted blend of 9 inputs, each scored 0–100. Each bar is that input's sub-score; the figure is the points it added to the 100-point composite (weight × sub-score).
- Cash flow +24.7/30.0
- ARV discount +15.0/15.0
- DSCR +8.0/10.0
- 1% rule +5.5/10.0
- Livability +3.4/5.0
- Rent growth +3.2/5.0
- Condition / age +2.5/5.0
- Schools +2.2/10.0
- Appreciation +0.0/10.0
$124,999
🖨 Deal sheet 📄 Offer letter ✓ Due diligence
Listing remarks MLS
2 bedrooms, 2 baths in the up-and-coming Comstock Park. Ready for a flip or for a handy man owner. A/C unit installed. Agent owned. Assumable mortgage $600 per month call for details.
Key facts
- 3,920 sq ft lot
- Community pool
- Built 1991
Neighborhood map
What this means for you Summary
Snapshot
- This is a 2-bed/2.0-bath manufactured listed at $125k.
Deal economics
- At list price, monthly cash flow is $262 ($3k/yr) — positive.
- The deal already cash-flows at list — no discount required.
- Meets the 1% rule at list price ($1k rent vs $125k).
- Recommended offer: $114k (9.0% below list) — sets the bar for market timing.
- Cap rate 8.8% vs local median 3.4% in Pahrump — top-decile yield for the area; either an underpriced asset or a hidden risk that comps aren't pricing in. Stress-test before assuming the spread holds.
Location & tenants
- Location reads 68/100 on livability (#30 in NV) — a middle-class / working-renter tenant base. Strengths: cost of living A+, housing A+, health & safety A+; Watch: employment D, schools F, crime F.
- Nye County School District (rural): math 20% / reading 33% proficiency, ranked #16 of 17 in NV (top 94%) — low school quality limits family demand, transient renter base, plan for 1-2y turnover.
- Market conditions: Rents rising (+2.7%/yr); 1116 active listings in the ZIP; 7 comparable units currently listed for rent nearby; rentals lingering (median 44d on market — plan ~5-8 weeks vacancy on turnover, expect pricing pressure); 100% of comp listings sitting > 30 days — soft ceiling on asking rent.
Forward outlook
- Local home prices are declining (-3.0%/yr); year-one equity from $864 of loan paydown is wiped out by about $4k of value loss. Plan a longer hold.
- Nye County population projected at -28% by 2050 — secular population decline; favor cash flow + early exit over multi-decade hold.
Negotiation context
- It's been on market 112 days — a 9% lower offer ($114k) is reasonable based on typical stale-listing flexibility.
- 8 sale attempts since 15y ago; this cycle's ask has dropped $11k (8%) from the opening price — seller is motivated, your offer sets the floor, not the list.
Risks & watch-outs
- Climate carrying-cost: extreme-heat days projected 5→13/yr by 2055 (HVAC capex compounding) — expect insurance premiums to compound above CPI over the hold.
Questions for the listing agent
- It's been on market 112 days. Have you received any prior offers? Is the seller open to a 9% concession, seller financing, or rate buy-down credit?
- What does the HOA fee cover, when was the last increase, and are there any pending special assessments or reserve-fund shortfalls?
- Why hasn't it sold? Are there any deal-killer items the seller is aware of (foundation, flood, title, zoning, code violations)?
- Is there a deadline driving the sale (1031 exchange, divorce, estate, relocation)? That informs how much negotiation room exists.
- Schools are F-rated, which usually means shorter tenancies and higher turnover. Who's the typical renter profile here, and what's been the actual vacancy rate?
- Crime grade is F in this area — have there been break-ins, vandalism, or insurance claims at this property in the last 3 years? What carrier currently insures it and at what premium?
- What's the average days-on-market for RENTAL listings here right now (not sales)? A rising rental-DOM trend means longer vacancies and softer asking-rent achievability than the comps imply.
- What's the recent tenant-quality profile in this submarket — average credit score on applications, eviction rate, late-payment / NSF rate, and stable-employment percentage? A property-management company in the area should have these aggregated.
- How much new for-sale + rental construction is in the pipeline within 1–3 miles? Heavy new supply typically softens prices + rents 12–24 months out; constrained supply supports both.
Investment metrics
- 1% rule
- 1.05% ✓
- Cap rate
- 8.81%
- Cash-on-cash
- 8.99%
- DSCR
- 1.40
- GRM
- 7.9
CMA / ARV
- ARV (median comp)
- $164,748
- List price
- $124,999
- Delta
- -24.13%
- Verdict
- UNDERPRICED
- Comps
- 20 within 1.0 mi
Show comp detail 12 sales within ~0.75 mi
| Address | Dist | Beds/Ba | Sqft | Sold | Price | $/sf | Match |
|---|---|---|---|---|---|---|---|
| 261 Ferndell St | 0.04mi | 2/2.0 | 840 (+3%) | 7mo | $135,000 | $161 | 86 |
| 310 Ferndell St | 0.03mi | 2/1.0 | 784 (-4%) | 12mo | $87,500 | $112 | 79 |
| 121 Wilderness Way | 0.13mi | 2/2.0 | 814 (+0%) | 18mo | $154,000 | $189 | 79 |
| 91 Steptoe St | 0.20mi | 2/1.0 | 788 (-3%) | 11mo | $200,000 | $254 | 72 |
| 280 Copper Flats Dr | 0.09mi | 2/2.0 | 932 (+15%) | 1mo | $175,000 | $188 | 71 |
| 231 Ferndell St | 0.06mi | 2/1.0 | 752 (-8%) | 12mo | $190,000 | $253 | 71 |
| 130 W Rudy Rd | 0.19mi | 2/1.5 | 720 (-11%) | 0mo | $140,000 | $194 | 70 |
| 280 W Bonnie Claire Ct | 0.13mi | 2/2.0 | 720 (-11%) | 7mo | $55,000 | $76 | 69 |
| 230 Greenwater St | 0.07mi | 2/1.5 | 903 (+11%) | 10mo | $162,000 | $179 | 68 |
| 120 Potter Pl | 0.25mi | 2/2.0 | 784 (-4%) | 17mo | $110,000 | $140 | 68 |
| 1430 Comstock Cir | 0.24mi | 2/2.0 | 837 (+3%) | 20mo | $125,000 | $149 | 68 |
| 320 W Ivy Ln | 0.13mi | 2/2.0 | 934 (+15%) | 12mo | $130,000 | $139 | 59 |
Match score weights: distance 35% · size 25% · config 20% · recency 20%. Top-matched comps best support the ARV.
Projected returns pro-forma
-3.0% appreciation · 2.73% rent growth · sell at horizon
- IRR
- -3.0%
- Equity multiple
- 0.89×
- Total profit
- $-3,940
- Equity at exit
- $18,638
- IRR
- 6.4%
- Equity multiple
- 1.47×
- Total profit
- $16,492
- Equity at exit
- $10,808
Cash invested: $35,000 (down + closing). Projections, not guarantees.
Landlord ↔ Tenant lean methodology
- Overall (STATE)
- 71 Landlord-Friendly
- State Nevada
- 71 Landlord-Friendly · R+1
- County
- — inherits STATE
- City
- — inherits STATE
ZIP-level market 89048
- Home prices YoY
- -7.2%
- Rents YoY
- 2.7%
- Active inventory
- 1116
- Price-to-rent
- 7.9×
Monthly cashflow live
- Estimated rent
- $1,318 high interval (Pro) →
- Mortgage (P&I)
- −$656
- Tax from tax record
- −$42 /mo · $501/yr
- Insurance
- −$52
- HOA
- −$30
- Vacancy / Maint / Mgmt
- −$277
- Net cashflow
- $262
Break-even live
Sensitivity live
| Price | -10% $333 | -5% $298 | +0% $262 | +5% $227 | +10% $192 |
|---|---|---|---|---|---|
| Rent | -10% $158 | -5% $210 | +0% $262 | +5% $314 | +10% $366 |
| Rate | -1.0pp $325 | -0.5pp $294 | base $262 | +0.5pp $230 | +1.0pp $197 |
UW: 25.0% down · 7.5% · 30yr · 1.5% tax · 5.0% vac · 8.0% maint · 8.0% mgmt
Financing live
Cash to close
- Down payment
- $31,250
- Closing costs
- $3,750
- Reserves months
- —
- Total cash needed
- —
Loan-product check · same deal, 3 products live
Conventional
25% down · 7.5% · 30yr
- Down + closing
- —
- Monthly P&I
- —
- Monthly cashflow
- —
- DSCR
- —
- Eligible?
- —
Personal DTI + credit; lowest rate.
DSCR
20% down · 8.5% · 30yr
- Down + closing
- —
- Monthly P&I
- —
- Monthly cashflow
- —
- DSCR
- —
- Eligible?
- —
No personal income docs; deal must DSCR.
Hard money
10% down · 12.0% · 12mo
- Down + closing
- —
- Monthly P&I
- —
- Monthly cashflow
- —
- DSCR
- —
- Eligible?
- —
Short-term bridge; refi at stabilization.
Rent comps 7 comps
| Address | Beds | Baths | Sqft | Rent | $/sqft | DOM | Units | Dist |
|---|---|---|---|---|---|---|---|---|
| 1111 Sixshooter Ave Unit 3C Pahrump, NV | 2.0 | 2.0 | 910 | $1,150 | $1.26 | 44d | 1 | 0.76mi |
| 1401 Ogallala St Unit 4 Pahrump, NV | 3.0 | 2.0 | 1009 | $1,350 | $1.34 | 44d | 1 | 0.76mi |
| 1081 Quartzite Ave #2 Pahrump, NV | 2.0 | 2.0 | 984 | $1,245 | $1.27 | 44d | 1 | 0.88mi |
| 1080 S Potro Ave #3 Pahrump, NV | 2.0 | 2.0 | 984 | $1,245 | $1.27 | 44d | 1 | 0.92mi |
| 1041 Marne Ct Unit 4 Pahrump, NV | 2.0 | 2.0 | 901 | $1,235 | $1.37 | 44d | 1 | 1.17mi |
| 1480 W Irons St Pahrump, NV | 2.0 | 2.0 | 980 | $1,600 | $1.63 | 44d | 1 | 1.38mi |
| 1100 Hall Ave Unit 4 Pahrump, NV | 3.0 | 2.0 | 1085 | $1,650 | $1.52 | 44d | 1 | 1.48mi |
HOA detail
- Monthly dues
- $30 · $360/yr
Listing history 42 events
-
2026-06-02status $124,999 Pending 112 DOM
-
2026-06-01days on market $124,999 Active 112 DOM
-
2026-05-31days on market $124,999 Active 111 DOM
-
2026-05-30days on market $124,999 Active 110 DOM
-
2026-05-12price $124,999 183-char remark
Show marketing remark (183 chars)
2 bedrooms, 2 baths in the up-and-coming Comstock Park. Ready for a flip or for a handy man owner. A/C unit installed. Agent owned. Assumable mortgage $600 per month call for details.
-
2026-05-09price $127,499 183-char remark
Show marketing remark (183 chars)
2 bedrooms, 2 baths in the up-and-coming Comstock Park. Ready for a flip or for a handy man owner. A/C unit installed. Agent owned. Assumable mortgage $600 per month call for details.
-
2026-05-01price $127,999 183-char remark
Show marketing remark (183 chars)
2 bedrooms, 2 baths in the up-and-coming Comstock Park. Ready for a flip or for a handy man owner. A/C unit installed. Agent owned. Assumable mortgage $600 per month call for details.
-
2026-04-14price $128,888 183-char remark
Show marketing remark (183 chars)
2 bedrooms, 2 baths in the up-and-coming Comstock Park. Ready for a flip or for a handy man owner. A/C unit installed. Agent owned. Assumable mortgage $600 per month call for details.
-
2026-03-27price $129,999 183-char remark
Show marketing remark (183 chars)
2 bedrooms, 2 baths in the up-and-coming Comstock Park. Ready for a flip or for a handy man owner. A/C unit installed. Agent owned. Assumable mortgage $600 per month call for details.
-
2026-03-18price $133,838 183-char remark
Show marketing remark (183 chars)
2 bedrooms, 2 baths in the up-and-coming Comstock Park. Ready for a flip or for a handy man owner. A/C unit installed. Agent owned. Assumable mortgage $600 per month call for details.
-
2026-03-15price $135,838 183-char remark
Show marketing remark (183 chars)
2 bedrooms, 2 baths in the up-and-coming Comstock Park. Ready for a flip or for a handy man owner. A/C unit installed. Agent owned. Assumable mortgage $600 per month call for details.
-
2026-02-27price $135,858 183-char remark
Show marketing remark (183 chars)
2 bedrooms, 2 baths in the up-and-coming Comstock Park. Ready for a flip or for a handy man owner. A/C unit installed. Agent owned. Assumable mortgage $600 per month call for details.
-
2026-02-20price $135,868 183-char remark
Show marketing remark (183 chars)
2 bedrooms, 2 baths in the up-and-coming Comstock Park. Ready for a flip or for a handy man owner. A/C unit installed. Agent owned. Assumable mortgage $600 per month call for details.
-
2026-02-14price $135,878 183-char remark
Show marketing remark (183 chars)
2 bedrooms, 2 baths in the up-and-coming Comstock Park. Ready for a flip or for a handy man owner. A/C unit installed. Agent owned. Assumable mortgage $600 per month call for details.
-
2026-02-09$135,888 Active 183-char remark
Show marketing remark (183 chars)
2 bedrooms, 2 baths in the up-and-coming Comstock Park. Ready for a flip or for a handy man owner. A/C unit installed. Agent owned. Assumable mortgage $600 per month call for details.
-
2026-01-19historical $135,888 183-char remark
Show marketing remark (183 chars)
2 bedrooms, 2 baths in the up-and-coming Comstock Park. Ready for a flip or for a handy man owner. A/C unit installed. Agent owned. Assumable mortgage $600 per month call for details.
-
2025-12-11historical
-
2025-12-05price $128,555
-
2025-11-22status Active
-
2025-11-21price $128,888
-
2025-06-04historical
-
2025-05-30status Active
-
2025-03-01$135,888 Active
-
2025-02-18historical
-
2022-10-12soldstatus $129,000
-
2020-02-21soldstatus $69,000 Sold
-
2020-02-20soldstatus $69,000
-
2019-12-26status Pending
-
2019-10-17price $74,900
-
2019-10-17$174,900 Active
-
2013-10-18soldstatus $21,000 Sold
-
2013-10-08status Pending
-
2013-08-30$24,900 Exclusive Right
-
2011-12-16soldstatus $16,500 Sold
-
2011-11-09historical Contingent Offer
-
2011-10-25$17,000 Exclusive Right
-
2011-10-15historical
-
2011-08-23price $19,000
-
2011-08-14price $28,500
-
2011-08-14$28,900 Exclusive Right
-
2005-07-14soldstatus $40,000
-
2005-04-12soldstatus $28,000
ⓘ Source: listings_history table (triggers on properties + properties_extension) + one-shot
backfill from property_details.listing_events for pre-trigger history.
Tax reassessment forecast NV · Resets to sale price
- Current annual tax
- $501 · $42/mo
- Projected year-2 tax
- $737 · $61/mo
- Expected delta
- +$237/yr (+$20/mo · 47.3%)
ⓘ Screening estimate from a state-policy table — verify with the county assessor before closing.
Climate risk First Street
- Flood 1/10 Low FEMA zone X (shaded) · 0% chance over 30 yrs
- Wildfire 4/10 Moderate
- Heat 7/10 Severe 5 d/yr ≥103°F today · 13 d/yr by 30 yrs out
- Wind 1/10 Low
- Air quality 1/10 Low 0 unhealthy d/yr today · 0 by 30 yrs out
Nearby sold comps map
Loading sold comps map…
Walkable amenities ~0.75 mi
Loading nearby amenities…
Taxation est. · year 1
- Rental income
- $15,822
- − Mortgage interest
- −$7,002
- − Property taxes
- −$501
- − Insurance
- −$625
- − Repairs & maintenance
- −$1,266
- − Management
- −$1,266
- − HOA
- −$360
- − Depreciation
- −$3,636
- Taxable income
- $1,166
- Est. tax owed @ 24.0%
- −$280
- After-tax cash flow
- $2,867/yr
For passive investors: Depreciation is non-cash, so a rental often shows a tax loss while cash-flowing — sheltering income. Rental losses are passive: they offset passive income freely, and up to $25,000/yr can offset ordinary (W-2) income if you actively participate and your MAGI is under $100k (phasing out to $0 by $150k); unused losses carry forward. On sale, claimed depreciation is recaptured at up to 25%, and gains may owe capital-gains tax (a 1031 exchange can defer both). Figures are a year-1 estimate at your 24.0% rate — not tax advice; consult a CPA.
Schools (NCES district)
- District
- Nye County School District
- NCES district ID
- 3200360
- Math proficiency
- 20% ▼ -6.00%
- Reading proficiency
- 33% ▼ -5.00%
- Median HH income
- $41,447
- Composite
- 22.43/100
- National rank
- #8110
- State rank
- #16 of 17 in NV
Livability — Pahrump
- Score
- 68/100
- State rank
- #30
- US rank
- #9226
Category grades
Schools grade is shown separately in the Schools card above.
Census & demographics
- Census place
- Pahrump, NV
- County
- Nye County · 47,491 people
- City population
- 47,491
- Metro
- Pahrump, NV
- Population (ZIP)
- 26,486
- Household income
- $61,367
- Rent vs Own
- Severe rent burden
- 939.0
Population outlook (Nye County) Hauer SSP2
- Today (2025)
- 40,727 people
- By 2030
- 38,812 · -4.7%
- By 2040
- 33,952 · -16.6%
- By 2050
- 29,393 · -27.8%
- By 2075
- 21,122 · -48.1%
- By 2100
- 14,400 · -64.6%
Race, ethnicity, and origin ACS 2023
- Neighborhood character
- Predominantly White (71%)
- Race & ethnicity
- White 71% Hispanic / Latino 13% Two or more races 12% Black 3% Asian 2% Native American 1%
- Hispanic origin (detail)
- Mexican 8%
- Common ancestry
- Lithuanian 3% Slovak 3% Serbian 2%
- Foreign-born
- 8% · Canada, South Korea
- Languages at home
- 89% English-only · Spanish 9% Tagalog/Filipino 1%
Political lean MEDSL · Nye
- 2024 margin
- Solid R (+42.2) · D 28.0% · R 70.2% · Other 1.8%
- 2008→2024 swing
- -28.8pp toward R · 2008: -13.4pp · 2024: -42.2pp
- All cycles
- 2024: R+42.2 2020: R+40.4 2016: R+42.0 2012: R+24.2 2008: R+13.4
Not yet ingested
- Civics
- —
Market trends
- HPI YoY
- ▼ -21.52%
- Current HPI
- 277.4486
- Rent YoY
- ▲ 2.73%
- Metro
- Pahrump, NV
- State GDP YoY
- ▲ 3.08%
- F500 in state
- 6
Industry mix (Fortune 500 HQ in NV)
| Industry | F500 HQs | Revenue |
|---|---|---|
| Hotels / Casinos | 3 | $36B |
|
||
Price history
+346.4% since first listed38 events — show timeline
- 2026-05-12 Price Changed $124,999 GLVAR
- 2026-05-09 Price Changed $127,499 GLVAR
- 2026-05-01 Price Changed $127,999 GLVAR
- 2026-04-14 Price Changed $128,888 GLVAR
- 2026-03-27 Price Changed $129,999 GLVAR
- 2026-03-18 Price Changed $133,838 GLVAR
- 2026-03-15 Price Changed $135,838 GLVAR
- 2026-02-27 Price Changed $135,858 GLVAR
- 2026-02-20 Price Changed $135,868 GLVAR
- 2026-02-14 Price Changed $135,878 GLVAR
- 2026-02-09 Listed $135,888 GLVAR
- 2026-01-19 Coming Soon $135,888 GLVAR
- 2025-12-11 Listing Removed — GLVAR
- 2025-12-05 Price Changed $128,555 GLVAR
- 2025-11-22 Relisted — GLVAR
- 2025-11-21 Price Changed $128,888 GLVAR
- 2025-06-04 Listing Removed — GLVAR
- 2025-05-30 Relisted — GLVAR
- 2025-03-01 Listed $135,888 GLVAR
- 2025-02-18 Coming Soon — GLVAR
- 2022-10-12 Sold (Public Records) $129,000 Public Records
- 2020-02-21 Sold (MLS) $69,000 GLVAR
- 2020-02-20 Sold (Public Records) $69,000 Public Records
- 2019-12-26 Pending — GLVAR
- 2019-10-17 Price Changed $74,900 GLVAR
- 2019-10-17 Listed $174,900 GLVAR
- 2013-10-18 Sold (MLS) $21,000 GLVAR
- 2013-10-08 Pending — GLVAR
- 2013-08-30 Listed $24,900 GLVAR
- 2011-12-16 Sold (MLS) $16,500 GLVAR
- 2011-11-09 Contingent — GLVAR
- 2011-10-25 Listed $17,000 GLVAR
- 2011-10-15 Listing Removed — GLVAR
- 2011-08-23 Price Changed $19,000 GLVAR
- 2011-08-14 Price Changed $28,500 GLVAR
- 2011-08-14 Listed $28,900 GLVAR
- 2005-07-14 Sold (Public Records) $40,000 Public Records
- 2005-04-12 Sold (Public Records) $28,000 Public Records
Property tax history
+0.8%/yrLatest (2025): $501 · +6.4% YoY. Source: county tax records.
Cash-flow waterfall
monthlySold comps — $/sqft
last 12 mo · ≤1 miLoading sold comps…