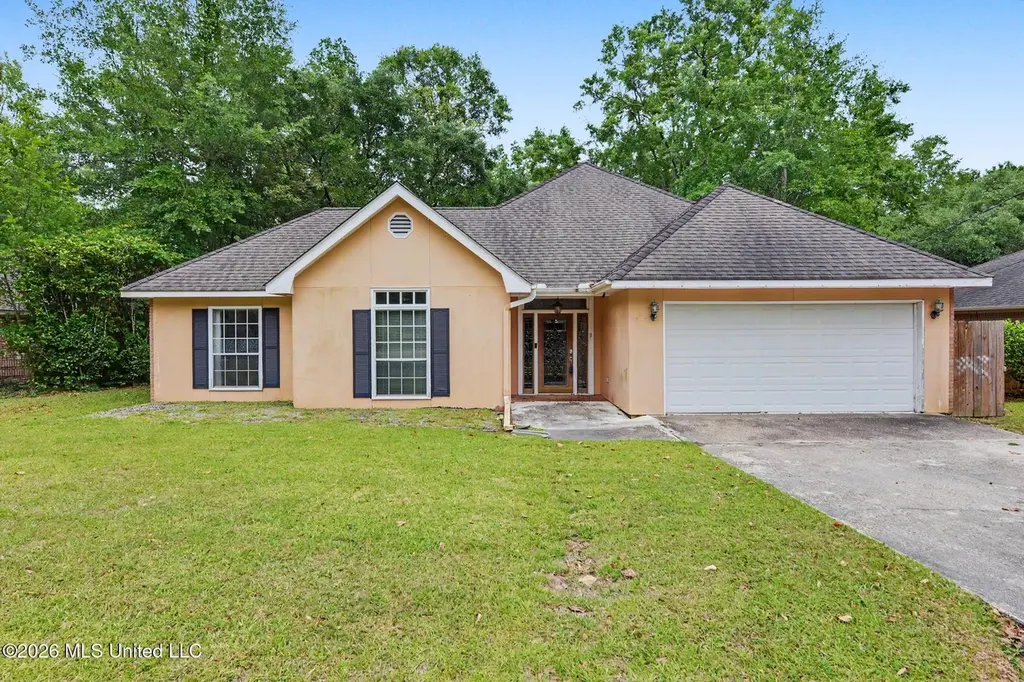
7881 Hilo Way · Diamondhead, MS
Flood risk 1/10 · Minimal
- FEMA flood zone
- X (unshaded)
- Chance of flooding over 30 yrs
- 0.0%
- Est. flood insurance / yr
- $507 – $1,088
Fire risk 4/10 · Minor
- Est. fire insurance / yr
- $1,241 – $2,305
Heat risk 10/10 · Severe
- Hot days now (above 107°F)
- 7 days/yr
- Hot days in 30 yrs
- 21 days/yr
Wind risk 9/10 · Severe
- Chance of severe wind over 30 yrs
- 99.0%
Air-quality risk 1/10 · Minimal
- Unhealthy air days now
- 0 days/yr
- Unhealthy air days in 30 yrs
- 0 days/yr
Risk factors via First Street. Map © Google.
Why this score? — see what drove the C- grade
The composite is a weighted blend of 9 inputs, each scored 0–100. Each bar is that input's sub-score; the figure is the points it added to the 100-point composite (weight × sub-score).
- Cash flow +18.0/30.0
- ARV discount +13.9/15.0
- DSCR +5.6/10.0
- Schools +3.9/10.0
- 1% rule +3.7/10.0
- Livability +3.4/5.0
- Rent growth +2.5/5.0
- Condition / age +2.5/5.0
- Appreciation +0.0/10.0
$229,900
🖨 Deal sheet (PDF) 📄 Offer letter ✓ Due diligence
Listing remarks MLS
Beautiful home located on a large lot with plenty of landscaping. New roof 01/06. Sunroom. High ceilings. 2 fireplaces. Much more to see!
Key facts
- Flexible bonus room
- Fenced backyard
- Two fireplaces
Tags
Property features AI
Finance
- HOA & community: Association membership; Community amenities include clubhouse, fitness center, pool, tennis courts, golf, marina, boating, lake, park, playground, hiking/walking trails, sports fields, restaurant, and airport/runway access
Exterior
- Parking: 2-car garage; Parking for 4 vehicles total; Concrete driveway; Garage faces front
- Utilities: Public water; Public sewer; Electricity connected; Water connected; Sewer connected
- Home design: Single-family house; One story; Slab foundation
- Construction: Brick veneer exterior; Architectural shingle roof; Built using slab foundation
- Exterior features: Private yard; Back yard fencing (wood); City lot; Few trees; Level lot
Interior
- Kitchen: Built-in range; Dishwasher; Microwave; Refrigerator; Water heater
- Flooring: Carpet; Concrete; Tile
- Bathrooms: 2 full bathrooms
- Heating & cooling: Central heating (electric); Central air conditioning (electric); Ceiling fans
- Interior features: Built-in features and breakfast bar; Ceiling fans; Crown molding; High ceilings; Walk-in closet(s); Deadbolt locks; Fireplaces in den and living room; Move-in ready
- Laundry & utility: Dedicated laundry room
Neighborhood map
What this means for you Summary
Snapshot
- This is a 3-bed/2.0-bath single-family listed at $230k.
Deal economics
- At list price, monthly cash flow is $197 ($2k/yr) — positive.
- The deal already cash-flows at list — no discount required.
- To meet the 1% rule (rent ≥ 1% of price), the offer needs to be $199k (13.4% below list).
- Recommended offer: $199k (13.4% below list) — sets the bar for 1% rule.
- Cap rate 7.3% vs local median 4.8% in Diamondhead — top-decile yield for the area; either an underpriced asset or a hidden risk that comps aren't pricing in. Stress-test before assuming the spread holds.
Location & tenants
- Location reads 68/100 on livability (#59 in MS) — a middle-class / working-renter tenant base. Strengths: crime A+, cost of living A+, housing A+; Watch: amenities F, commute F, health & safety F.
- Hancock County School District (rural): math 47% / reading 44% proficiency, ranked #23 of 130 in MS (top 18%) — families likely to look elsewhere, expect single-tenant / working-renter base with shorter leases.
- Zoned schools: East Hancock Elementary School (math 64% / reading 59%, grade B, #22 of 375 statewide, top 6%, 639 students, 100% FRL); Hancock Middle School (math 48% / reading 44%, grade D+, #39 of 179 statewide, top 22%, 958 students, 100% FRL); Hancock High School (math 42% / reading 43%, grade F, #42 of 197 statewide, top 21%, 1,187 students, 100% FRL) — zoned schools average 100% FRL vs 58% district-wide (41 pts higher); higher-poverty schools than district average — tighter screening recommended.
- Market conditions: 250 active listings in the ZIP; 1 comparable units currently listed for rent nearby; solid renter incomes; 248 units permitted in Hancock County in 2024 (0 in 5+ unit buildings).
Forward outlook
- Local home prices are declining (-3.0%/yr); year-one equity from $2k of loan paydown is wiped out by about $7k of value loss. Plan a longer hold.
- Hancock County population projected at +20% by 2050 — long-run rental-demand tailwind backs the buy-and-hold thesis.
Negotiation context
- It's been on market 45 days — a 3% lower offer ($223k) is reasonable based on typical stale-listing flexibility.
- 3 sale attempts since 20y ago; this cycle's ask has dropped $20k (8%) from the opening price — seller is motivated, your offer sets the floor, not the list.
Risks & watch-outs
- Climate carrying-cost: severe wind risk, 99% chance of damaging wind over 30y; extreme-heat days projected 7→21/yr by 2055 (HVAC capex compounding) — expect insurance premiums to compound above CPI over the hold.
Questions for the listing agent
- It's been on market 45 days. Have you received any prior offers? Is the seller open to a 13% concession, seller financing, or rate buy-down credit?
- Is there a deadline driving the sale (1031 exchange, divorce, estate, relocation)? That informs how much negotiation room exists.
- What's the average days-on-market for RENTAL listings here right now (not sales)? A rising rental-DOM trend means longer vacancies and softer asking-rent achievability than the comps imply.
- What's the recent tenant-quality profile in this submarket — average credit score on applications, eviction rate, late-payment / NSF rate, and stable-employment percentage? A property-management company in the area should have these aggregated.
- How much new for-sale + rental construction is in the pipeline within 1–3 miles? Heavy new supply typically softens prices + rents 12–24 months out; constrained supply supports both.
Investment metrics
- 1% rule
- 0.87% ✗
- Cap rate
- 7.32%
- Cash-on-cash
- 3.68%
- DSCR
- 1.16
- GRM
- 9.6
CMA / ARV
- ARV (median comp)
- $268,218
- List price
- $229,900
- Delta
- -14.29%
- Verdict
- UNDERPRICED
- Comps
- 20 within 1.0 mi
Show comp detail 12 sales within ~0.75 mi
| Address | Dist | Beds/Ba | Sqft | Sold | Price | $/sf | Match |
|---|---|---|---|---|---|---|---|
| 8814 Malino Pl | 0.29mi | 3/2.5 | 2,100 (-1%) | 4mo | $265,000 | $126 | 78 |
| 6846 Hilo St | 0.26mi | 4/3.0 (+1) | 2,130 (+0%) | 2mo | $298,000 | $140 | 78 |
| 7888 Hilo Way | 0.07mi | 3/2.5 | 2,359 (+11%) | 1mo | $257,000 | $109 | 76 |
| 6828 Hilo St | 0.35mi | 3/2.5 | 2,173 (+2%) | 3mo | $324,900 | $150 | 76 |
| 882 Maili Pl | 0.50mi | 3/2.0 | 2,172 (+2%) | 2mo | $285,000 | $131 | 72 |
| 682 Hilo Way | 0.24mi | 4/3.0 (+1) | 2,289 (+8%) | 1mo | $312,000 | $136 | 66 |
| 6822 Awini St | 0.41mi | 4/2.0 (+1) | 2,212 (+4%) | 4mo | $299,000 | $135 | 66 |
| 7913 Lanai St | 0.44mi | 3/2.5 | 2,272 (+7%) | 2mo | $397,500 | $175 | 64 |
| 8834 Kipapa Way | 0.54mi | 4/2.0 (+1) | 2,192 (+3%) | 3mo | $260,000 | $119 | 62 |
| 796 Hapuna Pl | 0.46mi | 3/2.0 | 1,907 (-10%) | 4mo | $310,000 | $163 | 58 |
| 682 Auahi Pl | 0.52mi | 3/2.0 | 1,865 (-12%) | 1mo | $244,000 | $131 | 54 |
| 8716 W Diamondhead Dr | 0.61mi | 3/2.0 | 1,869 (-12%) | 5mo | $265,000 | $142 | 47 |
Match score weights: distance 35% · size 25% · config 20% · recency 20%. Top-matched comps best support the ARV.
Projected returns pro-forma
-3.0% appreciation · 3.0% rent growth · sell at horizon
- IRR
- -10.6%
- Equity multiple
- 0.61×
- Total profit
- $-24,796
- Equity at exit
- $34,279
- IRR
- -1.3%
- Equity multiple
- 0.91×
- Total profit
- $-5,829
- Equity at exit
- $19,878
Cash invested: $64,372 (down + closing). Projections, not guarantees.
Landlord ↔ Tenant lean methodology
- Overall (STATE)
- 90 Strongly Landlord-Friendly
- State Mississippi
- 90 Strongly Landlord-Friendly · R+11
- County
- — inherits STATE
- City
- — inherits STATE
ZIP-level market 39525
- Home prices YoY
- -19.1%
- Active inventory
- 250
- Price-to-rent
- 9.6×
Monthly cashflow live
- Estimated rent
- $1,991 medium interval (Pro) →
- Mortgage (P&I)
- −$1,206
- Tax from tax record
- −$75 /mo · $895/yr
- Insurance
- −$96
- HOA
- −$0
- Vacancy / Maint / Mgmt
- −$418
- Net cashflow
- $197
Break-even live
Sensitivity live
| Price | -10% $327 | -5% $262 | +0% $197 | +5% $132 | +10% $67 |
|---|---|---|---|---|---|
| Rent | -10% $40 | -5% $119 | +0% $197 | +5% $276 | +10% $355 |
| Rate | -1.0pp $313 | -0.5pp $256 | base $197 | +0.5pp $138 | +1.0pp $77 |
UW: 25.0% down · 7.5% · 30yr · 1.5% tax · 5.0% vac · 8.0% maint · 8.0% mgmt
Financing live
Cash to close
- Down payment
- $57,475
- Closing costs
- $6,897
- Reserves months
- —
- Total cash needed
- —
Loan-product check · same deal, 3 products live
Conventional
25% down · 7.5% · 30yr
- Down + closing
- —
- Monthly P&I
- —
- Monthly cashflow
- —
- DSCR
- —
- Eligible?
- —
Personal DTI + credit; lowest rate.
DSCR
20% down · 8.5% · 30yr
- Down + closing
- —
- Monthly P&I
- —
- Monthly cashflow
- —
- DSCR
- —
- Eligible?
- —
No personal income docs; deal must DSCR.
Hard money
10% down · 12.0% · 12mo
- Down + closing
- —
- Monthly P&I
- —
- Monthly cashflow
- —
- DSCR
- —
- Eligible?
- —
Short-term bridge; refi at stabilization.
Rent comps 1 comps
| Address | Beds | Baths | Sqft | Rent | $/sqft | DOM | Units | Dist |
|---|---|---|---|---|---|---|---|---|
| 7516 Pinehurst Ct Diamondhead, MS | 3.0 | 3.0 | 2418 | $2,000 | $0.83 | 15d | 1 | 1.08mi |
Listing history 25 events
-
2026-06-21days on market $229,900 Active 45 DOM
-
2026-06-18days on market $229,900 Active 42 DOM
-
2026-06-17days on market $229,900 Active 41 DOM
-
2026-06-16days on market $229,900 Active 40 DOM
-
2026-06-15days on market $229,900 Active 39 DOM
-
2026-06-14days on market $229,900 Active 37 DOM
-
2026-06-13days on market $229,900 Active 36 DOM
-
2026-06-10days on market $229,900 Active 34 DOM
-
2026-06-09days on market $229,900 Active 33 DOM
-
2026-06-08days on market $229,900 Active 32 DOM
-
2026-06-07days on market $229,900 Active 31 DOM
-
2026-06-05days on market $229,900 Active 28 DOM
-
2026-06-03days on market $229,900 Active 27 DOM
-
2026-06-03price $229,900 Active 26 DOM
-
2026-06-02days on market $249,900 Active 26 DOM
-
2026-06-01days on market $249,900 Active 25 DOM
-
2026-05-31days on market $249,900 Active 24 DOM
-
2026-05-30days on market $249,900 Active 23 DOM
-
2026-05-07$249,900 Active 623-char remark
-
2026-03-02historical
-
2025-08-22$269,000 Active
-
2006-04-03soldstatus
-
2006-03-31soldstatus
Show marketing remark (137 chars)
Beautiful home located on a large lot with plenty of landscaping. New roof 01/06. Sunroom. High ceilings. 2 fireplaces. Much more to see!
-
2006-02-27$199,000
Show marketing remark (137 chars)
Beautiful home located on a large lot with plenty of landscaping. New roof 01/06. Sunroom. High ceilings. 2 fireplaces. Much more to see!
-
2000-04-06soldstatus
ⓘ Source: listings_history table (triggers on properties + properties_extension) + one-shot
backfill from property_details.listing_events for pre-trigger history.
Tax reassessment forecast MS · Resets to sale price
- Current annual tax
- $895 · $75/mo
- Projected year-2 tax
- $1,816 · $151/mo
- Expected delta
- +$921/yr (+$77/mo · 103.0%)
ⓘ Screening estimate from a state-policy table — verify with the county assessor before closing.
Climate risk First Street
- Flood 1/10 Low FEMA zone X (unshaded) · 0% chance over 30 yrs
- Wildfire 4/10 Moderate
- Heat 10/10 Extreme 7 d/yr ≥107°F today · 21 d/yr by 30 yrs out
- Wind 9/10 Extreme 99% chance of damaging wind over 30 yrs
- Air quality 1/10 Low 0 unhealthy d/yr today · 0 by 30 yrs out
Nearby sold comps map
Loading sold comps map…
Walkable amenities ~0.75 mi
Loading nearby amenities…
Taxation est. · year 1
- Rental income
- $23,896
- − Mortgage interest
- −$12,878
- − Property taxes
- −$895
- − Insurance
- −$1,150
- − Repairs & maintenance
- −$1,912
- − Management
- −$1,912
- − Depreciation
- −$6,688
- Taxable loss
- −$1,537
- Est. tax savings @ 24.0%
- +$369
- After-tax cash flow
- $2,735/yr
For passive investors: Depreciation is non-cash, so a rental often shows a tax loss while cash-flowing — sheltering income. Rental losses are passive: they offset passive income freely, and up to $25,000/yr can offset ordinary (W-2) income if you actively participate and your MAGI is under $100k (phasing out to $0 by $150k); unused losses carry forward. On sale, claimed depreciation is recaptured at up to 25%, and gains may owe capital-gains tax (a 1031 exchange can defer both). Figures are a year-1 estimate at your 24.0% rate — not tax advice; consult a CPA.
Schools (NCES district)
- District
- Hancock County School District
- NCES district ID
- 2801740
- Math proficiency
- 47% ▼ -11.00%
- Reading proficiency
- 44% ▼ -9.00%
- Median HH income
- $47,971
- Composite
- 38.88/100
- National rank
- #4099
- State rank
- #23 of 130 in MS
Livability — Diamondhead
- Score
- 68/100
- State rank
- #59
- US rank
- #9320
Category grades
Schools grade is shown separately in the Schools card above.
Census & demographics
- Census place
- Diamondhead, MS
- County
- Hancock County · 9,338 people
- City population
- 9,338
- Metro
- Gulfport-Biloxi, MS
- Population (ZIP)
- 9,338
- Household income
- $87,407
- Rent vs Own
Population outlook (Hancock County) Hauer SSP2
- Today (2025)
- 52,161 people
- By 2030
- 54,753 · +5.0%
- By 2040
- 59,242 · +13.6%
- By 2050
- 62,417 · +19.7%
- By 2075
- 68,168 · +30.7%
- By 2100
- 69,212 · +32.7%
Race, ethnicity, and origin ACS 2023
- Neighborhood character
- Predominantly White (85%)
- Race & ethnicity
- White 85% Two or more races 9% Hispanic / Latino 8% Black 2%
- Hispanic origin (detail)
- Mexican 5%
- Common ancestry
- Lithuanian 10% Slovak 3% Romanian 2%
- Foreign-born
- 3% · Canada
- Languages at home
- 94% English-only · Spanish 4% French/Haitian/Cajun 1% Other Indo-European 1%
Political lean MEDSL · Hancock
- 2024 margin
- Solid R (+58.7) · D 20.1% · R 78.8% · Other 1.1%
- 2008→2024 swing
- -4.4pp toward R · 2008: -54.2pp · 2024: -58.7pp
- All cycles
- 2024: R+58.7 2020: R+55.5 2016: R+59.4 2012: R+52.8 2008: R+54.2
Not yet ingested
- Civics
- —
Market trends
- HPI YoY
- ▼ -45.77%
- Current HPI
- 193.4883
- Rent YoY
- —
- Metro
- Gulfport-Biloxi, MS
- State GDP YoY
- —
- F500 in state
- 0
Price history
+15.5% since first listed8 events — show timeline
- 2026-06-02 Price Changed $229,900 MLSU
- 2026-05-07 Listed $249,900 MLSU
- 2026-03-02 Listing Removed — MLSU
- 2025-08-22 Listed $269,000 MLSU
- 2006-04-03 Sold (Public Records) — Public Records
- 2006-03-31 Sold (MLS) — MLSU
- 2006-02-27 Listed $199,000 MLSU
- 2000-04-06 Sold (Public Records) — Public Records
Property tax history
+1.8%/yrLatest (2025): $895 · +0.0% YoY. Source: county tax records.
Cash-flow waterfall
monthlySold comps — $/sqft
last 12 mo · ≤1 miLoading sold comps…