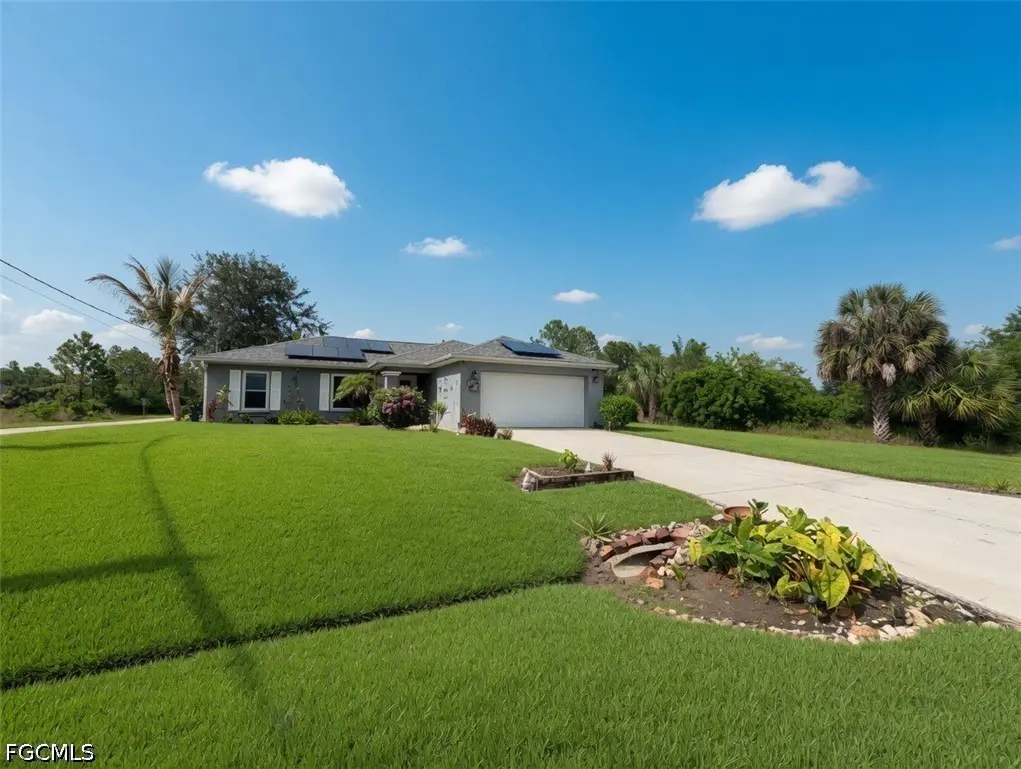
3218 43rd St W · Lehigh Acres, FL
Flood risk 1/10 · Minimal
- FEMA flood zone
- X (unshaded)
- Chance of flooding over 30 yrs
- 0.0%
- Est. flood insurance / yr
- $507 – $1,088
Fire risk 4/10 · Minor
- Est. fire insurance / yr
- $947 – $1,759
Heat risk 9/10 · Severe
- Hot days now (above 108°F)
- 7 days/yr
- Hot days in 30 yrs
- 26 days/yr
Wind risk 10/10 · Severe
- Chance of severe wind over 30 yrs
- 99.0%
Air-quality risk 2/10 · Minimal
- Unhealthy air days now
- 1 days/yr
- Unhealthy air days in 30 yrs
- 1 days/yr
Risk factors via First Street. Map © Google.
Why this score? — see what drove the D+ grade
The composite is a weighted blend of 9 inputs, each scored 0–100. Each bar is that input's sub-score; the figure is the points it added to the 100-point composite (weight × sub-score).
- Cash flow +14.0/30.0
- ARV discount +12.7/15.0
- DSCR +4.3/10.0
- Schools +4.1/10.0
- 1% rule +3.1/10.0
- Livability +3.0/5.0
- Condition / age +2.5/5.0
- Rent growth +1.3/5.0
- Appreciation +0.0/10.0
$260,000
🖨 Deal sheet (PDF) 📄 Offer letter ✓ Due diligence
Listing remarks MLS
This 3 bedroom 2 full bath home has a new water filtration system and features a large eat-in kitchen, split floorplan and built in hallway desk. Plenty of storage options in the 2 car garage. Convenient location, close to schools and shopping!
Key facts
- Over half an acre
- Fire pit area
- Mature coconut trees
Tags
Property features AI
Finance
- Financial info: Pets allowed
- HOA & community: Non-gated community; No association fee listed
Exterior
- Parking: Attached 2-car garage with garage door opener; 2 covered spaces
- Security: Smoke detector(s)
- Utilities: Septic tank; Cable available; High-speed internet available
- Home design: Single-story; Resale property; Faces south; Has view; Rectangular lot; Lot dimensions 125 x 174 x 125 x 174; Zoning RS-1; Irrigation from well; Exposure to north
- Construction: Block, concrete and stucco construction; Shingle roof; Built on foundation (standard)
- Exterior features: Deck; Balcony; Lanai; Patio; Porch; Screened porch; Fruit trees; Sprinkler/irrigation (automatic); Storage; Outbuilding; Pond on lot; Sprinklers automatic; Paved road
Interior
- Kitchen: Cooktop; Electric cooktop; Range; Self-cleaning oven; Microwave; Dishwasher; Disposal; Icemaker; Refrigerator; Refrigerator with ice maker; Water purifier; Water softener; Pantry; Eat-in kitchen
- Bedrooms: Bedroom on main level; Main level primary
- Flooring: Carpet; Tile; Vinyl
- Bathrooms: 2 full bathrooms
- Heating & cooling: Central heating (electric); Central air (electric)
- Interior features: Built-in features; Cathedral ceilings; Entrance foyer; Eat-in kitchen; Family/dining room; High ceilings; Living/dining room; Main level primary bedroom; Pantry; Shower only with separate shower; Cable TV; Bar; Walk-in closets; Window treatments; Home office; Split bedrooms; Wheelchair access; Furnishing negotiable
- Laundry & utility: Washer; Dryer; Laundry inside
Neighborhood map
What this means for you Summary
Snapshot
- This is a 3-bed/2.0-bath single-family listed at $260k.
Deal economics
- At list price, monthly cash flow is $36 ($428/yr) — positive.
- The deal already cash-flows at list — no discount required.
- To meet the 1% rule (rent ≥ 1% of price), the offer needs to be $212k (18.6% below list).
- Recommended offer: $212k (18.6% below list) — sets the bar for 1% rule.
- Cap rate 6.5% vs local median 4.7% in Lehigh Acres — top-decile yield for the area; either an underpriced asset or a hidden risk that comps aren't pricing in. Stress-test before assuming the spread holds.
Location & tenants
- Location reads 59/100 on livability (#826 in FL) — a working-class tenant base; expect higher turnover. Strengths: cost of living A+, housing A+; Watch: crime C-, employment D+, amenities F.
- Lee (suburban): math 47% / reading 50% proficiency, ranked #42 of 73 in FL (top 58%) — families likely to look elsewhere, expect single-tenant / working-renter base with shorter leases.
- Zoned schools: Veterans Park Academy For The Arts (math 41% / reading 45%, grade F, #1,366 of 2,144 statewide, top 64%, 2,133 students, 36% FRL); Oak Hammock Middle School (math 43% / reading 41%, grade D-, #340 of 571 statewide, top 61%, 1,563 students, 56% FRL); Lehigh Senior High School (math 23% / reading 45%, grade F, #394 of 667 statewide, top 60%, 2,476 students, 57% FRL).
- Market conditions: Rents falling (-4.7%/yr); 1347 active listings in the ZIP; 40 comparable units currently listed for rent nearby; rentals at typical pace (median 23d on market — plan ~3-4 weeks tenant-placement turnaround); solid renter incomes; 15,411 units permitted in Lee County in 2024 (4,686 in 5+ unit buildings).
- This rent runs 33% of the median local income ($78k/yr) — at the standard rent-burdened threshold; future hikes will face affordability resistance.
Forward outlook
- Local home prices are declining (-3.0%/yr); year-one equity from $2k of loan paydown is wiped out by about $8k of value loss. Plan a longer hold.
- Lee County population projected at +44% by 2050 — long-run rental-demand tailwind backs the buy-and-hold thesis.
Negotiation context
- It's been on market 28 days — a 2% lower offer ($256k) is reasonable based on typical stale-listing flexibility.
- 3 sale attempts since 9y ago with the ask held roughly flat each time — persistent listings suggest the price (not the market) is what's stuck; bring a comps-based counter.
- Current owner paid $140k; list at $260k implies a 86% gain — meaningful room to come down on a strong offer.
Risks & watch-outs
- Climate carrying-cost: severe wind risk, 99% chance of damaging wind over 30y; extreme-heat days projected 7→26/yr by 2055 (HVAC capex compounding) — expect insurance premiums to compound above CPI over the hold.
Questions for the listing agent
- Is there a deadline driving the sale (1031 exchange, divorce, estate, relocation)? That informs how much negotiation room exists.
- Schools are D-rated, which usually means shorter tenancies and higher turnover. Who's the typical renter profile here, and what's been the actual vacancy rate?
- The area grade is low — what's the realistic commute time and amenity access for the typical tenant pool here? Any planned neighborhood developments (good or bad) we should know about?
- What's the average days-on-market for RENTAL listings here right now (not sales)? A rising rental-DOM trend means longer vacancies and softer asking-rent achievability than the comps imply.
- What's the recent tenant-quality profile in this submarket — average credit score on applications, eviction rate, late-payment / NSF rate, and stable-employment percentage? A property-management company in the area should have these aggregated.
- How much new for-sale + rental construction is in the pipeline within 1–3 miles? Heavy new supply typically softens prices + rents 12–24 months out; constrained supply supports both.
Investment metrics
- 1% rule
- 0.81% ✗
- Cap rate
- 6.46%
- Cash-on-cash
- 0.59%
- DSCR
- 1.03
- GRM
- 10.2
CMA / ARV
- ARV (on-the-fly)
- $293,832
- Comps found
- 7
Show comp detail 7 sales within ~0.75 mi
| Address | Dist | Beds/Ba | Sqft | Sold | Price | $/sf | Match |
|---|---|---|---|---|---|---|---|
| 3204 45th St W | 0.16mi | 3/2.0 | 1,455 (+14%) | 1mo | $249,600 | $172 | 68 |
| 3219 46th St W | 0.15mi | 3/2.0 | 1,150 (-10%) | 13mo | $280,000 | $243 | 66 |
| 3307 40th St W | 0.22mi | 3/2.0 | 1,150 (-10%) | 12mo | $279,900 | $243 | 63 |
| 2904 44th St W | 0.55mi | 3/2.0 | 1,222 (-4%) | 10mo | $283,000 | $232 | 60 |
| 3402 W 49th St | 0.50mi | 3/2.0 | 1,406 (+10%) | 16mo | $325,000 | $231 | 46 |
| 3418 51st St W | 0.66mi | 3/2.0 | 1,406 (+10%) | 15mo | $310,000 | $220 | 39 |
| 3327 53rd St W | 0.70mi | 3/2.0 | 1,458 (+15%) | 23mo | $315,000 | $216 | 24 |
Match score weights: distance 35% · size 25% · config 20% · recency 20%. Top-matched comps best support the ARV.
Projected returns pro-forma
-3.0% appreciation · 0.0% rent growth · sell at horizon
- IRR
- -18.5%
- Equity multiple
- 0.37×
- Total profit
- $-46,127
- Equity at exit
- $38,767
- IRR
- -17.6%
- Equity multiple
- 0.16×
- Total profit
- $-61,478
- Equity at exit
- $22,480
Cash invested: $72,800 (down + closing). Projections, not guarantees.
Landlord ↔ Tenant lean methodology
- Overall (STATE)
- 87 Strongly Landlord-Friendly
- State Florida
- 87 Strongly Landlord-Friendly · R+3
- County
- — inherits STATE
- City
- — inherits STATE
ZIP-level market 33971
- Home prices YoY
- -8.0%
- Rents YoY
- -4.7%
- Active inventory
- 1347
- Price-to-rent
- 10.2×
Monthly cashflow live
- Estimated rent
- $2,116 high interval (Pro) →
- Mortgage (P&I)
- −$1,363
- Tax from tax record
- −$164 /mo · $1,970/yr
- Insurance
- −$108
- HOA
- −$0
- Vacancy / Maint / Mgmt
- −$444
- Net cashflow
- $36
Break-even live
Sensitivity live
| Price | -10% $183 | -5% $109 | +0% $36 | +5% $-38 | +10% $-112 |
|---|---|---|---|---|---|
| Rent | -10% $-131 | -5% $-48 | +0% $36 | +5% $119 | +10% $203 |
| Rate | -1.0pp $167 | -0.5pp $102 | base $36 | +0.5pp $-32 | +1.0pp $-100 |
UW: 25.0% down · 7.5% · 30yr · 1.5% tax · 5.0% vac · 8.0% maint · 8.0% mgmt
Financing live
Cash to close
- Down payment
- $65,000
- Closing costs
- $7,800
- Reserves months
- —
- Total cash needed
- —
Loan-product check · same deal, 3 products live
Conventional
25% down · 7.5% · 30yr
- Down + closing
- —
- Monthly P&I
- —
- Monthly cashflow
- —
- DSCR
- —
- Eligible?
- —
Personal DTI + credit; lowest rate.
DSCR
20% down · 8.5% · 30yr
- Down + closing
- —
- Monthly P&I
- —
- Monthly cashflow
- —
- DSCR
- —
- Eligible?
- —
No personal income docs; deal must DSCR.
Hard money
10% down · 12.0% · 12mo
- Down + closing
- —
- Monthly P&I
- —
- Monthly cashflow
- —
- DSCR
- —
- Eligible?
- —
Short-term bridge; refi at stabilization.
Rent comps 40 comps
| Address | Beds | Baths | Sqft | Rent | $/sqft | DOM | Units | Dist |
|---|---|---|---|---|---|---|---|---|
| 3202 37th St W Lehigh Acres, FL | 3.0 | 2.5 | 1412 | $1,705 | $1.21 | 15d | 1 | 0.36mi |
| 3005 41st St W Lehigh Acres, FL | 3.0 | 2.0 | 1853 | $2,250 | $1.21 | 25d | 1 | 0.39mi |
| 3005 40th St W Lehigh Acres, FL | 3.0 | 2.0 | 1272 | $2,000 | $1.57 | 5d | 1 | 0.41mi |
| 3304 49th St W Lehigh Acres, FL | 3.0 | 2.0 | 1399 | $2,340 | $1.67 | 3d | 1 | 0.47mi |
| 3313 35th St W Lehigh Acres, FL | 3.0 | 2.0 | 1458 | $1,950 | $1.34 | 25d | 1 | 0.52mi |
| 3213 51st St W Lehigh Acres, FL | 3.0 | 2.0 | 1654 | $2,250 | $1.36 | 3d | 1 | 0.55mi |
| 3012 51st St W Lehigh Acres, FL | 3.0 | 2.0 | 1551 | $1,599 | $1.03 | 17d | 1 | 0.67mi |
| 2808 44th St W Lehigh Acres, FL | 4.0 | 2.0 | 1800 | $1,745 | $0.97 | 25d | 1 | 0.68mi |
| 3512 50th St W Lehigh Acres, FL | 3.0 | 2.0 | 1615 | $1,995 | $1.24 | 15d | 1 | 0.72mi |
| 4626 Ida Ave N Lehigh Acres, FL | 3.0 | 2.0 | 1615 | $2,000 | $1.24 | 17d | 1 | 0.74mi |
| 2719 42nd St W Lehigh Acres, FL | 3.0 | 2.0 | 1637 | $2,000 | $1.22 | 16d | 1 | 0.77mi |
| 2809 Darlene Pl Lehigh Acres, FL | 3.0 | 2.0 | 1600 | $2,000 | $1.25 | 25d | 1 | 0.79mi |
| 3208 31st St W Lehigh Acres, FL | 3.0 | 2.0 | 1501 | $2,100 | $1.40 | 25d | 1 | 0.81mi |
| 2800 47th St W Lehigh Acres, FL | 3.0 | 2.0 | 1370 | $2,000 | $1.46 | 25d | 1 | 0.82mi |
| 3175 Sunshine Blvd Lehigh Acres, FL | 3.0 | 2.0 | 1633 | $2,100 | $1.29 | 4d | 1 | 0.89mi |
| 3302 56th St W Lehigh Acres, FL | 2.0 | 2.0 | 1032 | $1,775 | $1.72 | 17d | 1 | 0.91mi |
| 3306 56th St W #1 Lehigh Acres, FL | 4.0 | 2.0 | 1534 | $2,099 | $1.37 | 23d | 1 | 0.91mi |
| 3201 57th St W Lehigh Acres, FL | 3.0 | 2.0 | 1630 | $2,100 | $1.29 | 25d | 1 | 0.93mi |
| 3405 Hanna Ave N Lehigh Acres, FL | 4.0 | 3.0 | 1698 | $2,200 | $1.30 | 25d | 1 | 0.93mi |
| 2610 40th St W Lehigh Acres, FL | 3.0 | 2.0 | 1472 | $2,000 | $1.36 | 25d | 1 | 0.93mi |
| 3005 31st St W Lehigh Acres, FL | 3.0 | 2.0 | 1600 | $1,950 | $1.22 | 4d | 1 | 0.94mi |
| 3103 58th St W Lehigh Acres, FL | 3.0 | 2.0 | 1310 | $1,800 | $1.37 | 5d | 1 | 1.01mi |
| 2910 57th St W Lehigh Acres, FL | 3.0 | 2.0 | 1550 | $1,805 | $1.16 | 3d | 1 | 1.04mi |
| 2617 49th St W Lehigh Acres, FL | 2.0 | 2.0 | 968 | $1,499 | $1.55 | 25d | 1 | 1.04mi |
| 3417 31st St W Lehigh Acres, FL | 3.0 | 2.0 | 1779 | $3,500 | $1.97 | 25d | 1 | 1.06mi |
| 4624 Connie Ave N Lehigh Acres, FL | 3.0 | 2.0 | 1562 | $2,200 | $1.41 | 4d | 1 | 1.09mi |
| 4626 Connie Ave N Lehigh Acres, FL | 3.0 | 2.0 | 1562 | $2,200 | $1.41 | 4d | 1 | 1.09mi |
| 4624 Connie Ave N Lehigh Acres, FL | 3.0 | 2.0 | 1562 | $2,200 | $1.41 | 25d | 1 | 1.09mi |
| 2614 Carol Pl Lehigh Acres, FL | 3.0 | 2.0 | 1595 | $1,695 | $1.06 | 17d | 1 | 1.09mi |
| 3315 Sunshine Blvd N Lehigh Acres, FL | 3.0 | 2.0 | 1630 | $2,000 | $1.23 | 5d | 1 | 1.09mi |
| 4626 Connie Ave N Lehigh Acres, FL | 3.0 | 2.0 | 1562 | $2,200 | $1.41 | 25d | 1 | 1.10mi |
| 5901 Rita Ave N Lehigh Acres, FL | 3.0 | 2.0 | 1324 | $2,000 | $1.51 | 25d | 1 | 1.10mi |
| 3601 57th St W Lehigh Acres, FL | 3.0 | 2.0 | 1458 | $1,850 | $1.27 | 5d | 1 | 1.12mi |
| 2611 Carol Pl Lehigh Acres, FL | 3.0 | 2.0 | 1406 | $1,895 | $1.35 | 12d | 1 | 1.12mi |
| 2713 56th St W Lehigh Acres, FL | 3.0 | 2.0 | 1606 | $2,100 | $1.31 | 23d | 1 | 1.12mi |
| 2601 48th St W Lehigh Acres, FL | 3.0 | 2.0 | 1200 | $2,000 | $1.67 | 25d | 1 | 1.13mi |
| 2522 Alice Pl Lehigh Acres, FL | 3.0 | 2.0 | 1630 | $2,300 | $1.41 | 5d | 1 | 1.16mi |
| 3016 25th St W Lehigh Acres, FL | 3.0 | 2.0 | 1100 | $1,555 | $1.41 | 25d | 1 | 1.22mi |
| 3202 61st St W Lehigh Acres, FL | 3.0 | 2.0 | 1777 | $1,800 | $1.01 | 25d | 1 | 1.33mi |
| 3016 62nd St W Lehigh Acres, FL | 4.0 | 2.0 | 1389 | $1,750 | $1.26 | 23d | 1 | 1.40mi |
Listing history 25 events
-
2026-06-13status $260,000 Pending 28 DOM
-
2026-06-10days on market $260,000 Active 28 DOM
-
2026-06-09days on market $260,000 Active 27 DOM
-
2026-06-08days on market $260,000 Active 26 DOM
-
2026-06-07days on market $260,000 Active 25 DOM
-
2026-06-03days on market $260,000 Active 21 DOM
-
2026-06-02days on market $260,000 Active 20 DOM
-
2026-06-01days on market $260,000 Active 19 DOM
-
2026-05-31days on market $260,000 Active 18 DOM
-
2026-05-13$260,000 Active
-
2026-01-27price $310,000
-
2025-12-31price $349,900
-
2025-12-20price $362,400
-
2025-11-25price $374,900
-
2025-10-30$399,900 Active
-
2018-02-12soldstatus $140,000
-
2018-02-02soldstatus $140,000 Sold 263-char remark
Show marketing remark (263 chars)
This 3 bedroom 2 full bath home has a new water filtration system and features a large eat-in kitchen, split floorplan and built in hallway desk. Plenty of storage options in the 2 car garage. Convenient location, close to schools and shopping!
-
2017-11-24status Pending With Contingencies 263-char remark
Show marketing remark (263 chars)
This 3 bedroom 2 full bath home has a new water filtration system and features a large eat-in kitchen, split floorplan and built in hallway desk. Plenty of storage options in the 2 car garage. Convenient location, close to schools and shopping!
-
2017-11-22$140,000 Active 263-char remark
Show marketing remark (263 chars)
This 3 bedroom 2 full bath home has a new water filtration system and features a large eat-in kitchen, split floorplan and built in hallway desk. Plenty of storage options in the 2 car garage. Convenient location, close to schools and shopping!
-
2011-02-24soldstatus $63,000
-
2011-01-12price $66,300
-
2005-06-27soldstatus $57,900
-
2004-09-24soldstatus $21,000
-
2004-08-31price $22,500
-
2004-06-24soldstatus $10,000
ⓘ Source: listings_history table (triggers on properties + properties_extension) + one-shot
backfill from property_details.listing_events for pre-trigger history.
Tax reassessment forecast FL · Resets to sale price
- Current annual tax
- $1,970 · $164/mo
- Projected year-2 tax
- $2,158 · $180/mo
- Expected delta
- +$188/yr (+$16/mo · 9.5%)
ⓘ Screening estimate from a state-policy table — verify with the county assessor before closing.
Climate risk First Street
- Flood 1/10 Low FEMA zone X (unshaded) · 0% chance over 30 yrs
- Wildfire 4/10 Moderate
- Heat 9/10 Extreme 7 d/yr ≥108°F today · 26 d/yr by 30 yrs out
- Wind 10/10 Extreme 99% chance of damaging wind over 30 yrs
- Air quality 2/10 Low 1 unhealthy d/yr today · 1 by 30 yrs out
Nearby sold comps map
Loading sold comps map…
Walkable amenities ~0.75 mi
Loading nearby amenities…
Taxation est. · year 1
- Rental income
- $25,392
- − Mortgage interest
- −$14,564
- − Property taxes
- −$1,970
- − Insurance
- −$1,300
- − Repairs & maintenance
- −$2,031
- − Management
- −$2,031
- − Depreciation
- −$7,564
- Taxable loss
- −$4,068
- Est. tax savings @ 24.0%
- +$976
- After-tax cash flow
- $1,404/yr
For passive investors: Depreciation is non-cash, so a rental often shows a tax loss while cash-flowing — sheltering income. Rental losses are passive: they offset passive income freely, and up to $25,000/yr can offset ordinary (W-2) income if you actively participate and your MAGI is under $100k (phasing out to $0 by $150k); unused losses carry forward. On sale, claimed depreciation is recaptured at up to 25%, and gains may owe capital-gains tax (a 1031 exchange can defer both). Figures are a year-1 estimate at your 24.0% rate — not tax advice; consult a CPA.
Schools (NCES district)
- District
- Lee
- NCES district ID
- 1201080
- Math proficiency
- 47% ▼ -11.00%
- Reading proficiency
- 50% ▼ -4.00%
- Median HH income
- $49,518
- Composite
- 41.49/100
- National rank
- #3458
- State rank
- #42 of 73 in FL
Livability — Lehigh Acres
- Score
- 59/100
- State rank
- #826
- US rank
- #20055
Category grades
Schools grade is shown separately in the Schools card above.
Census & demographics
- Census place
- Lehigh Acres, FL
- County
- Lee County · 788,662 people
- City population
- 130,638
- Metro
- Cape Coral-Fort Myers, FL
- Population (ZIP)
- 30,790
- Household income
- $77,723
- Rent vs Own
- Severe rent burden
- 587.0
Population outlook (Lee County) Hauer SSP2
- Today (2025)
- 871,946 people
- By 2030
- 955,468 · +9.6%
- By 2040
- 1,113,587 · +27.7%
- By 2050
- 1,256,891 · +44.1%
- By 2075
- 1,560,270 · +78.9%
- By 2100
- 1,726,848 · +98.0%
Race, ethnicity, and origin ACS 2023
- Neighborhood character
- Diverse neighborhood (Simpson 0.65)
- Race & ethnicity
- Hispanic / Latino 49% Two or more races 32% White 26% Black 19% Asian 2%
- Hispanic origin (detail)
- Mexican 9% Puerto Rican 13% Cuban 14% Dominican 2%
- Common ancestry
- Hispanic 7% Estonian 1% Romanian 1%
- Foreign-born
- 31% · Canada, Vietnam, Guatemala
- Languages at home
- 46% English-only · Spanish 41% French/Haitian/Cajun 9% Other Indo-European 2%
Political lean MEDSL · Lee
- 2024 margin
- Strong R (+28.4) · D 35.5% · R 63.9%
- 2008→2024 swing
- -18.0pp toward R · 2008: -10.4pp · 2024: -28.4pp
- All cycles
- 2024: R+28.4 2020: R+19.2 2016: R+20.4 2012: R+16.6 2008: R+10.4
Not yet ingested
- Civics
- —
Market trends
- HPI YoY
- ▼ -27.68%
- Current HPI
- 317.7147
- Rent YoY
- ▼ -4.69%
- Metro
- Cape Coral-Fort Myers, FL
- State GDP YoY
- ▲ 3.28%
- F500 in state
- 36
Industry mix (Fortune 500 HQ in FL)
| Industry | F500 HQs | Revenue |
|---|---|---|
| Industrial Technology | 2 | $29B |
|
||
| Insurance | 2 | $17B |
|
||
| Retail | 1 | $60B |
|
||
| Technology Distribution | 1 | $58B |
|
||
| Homebuilding | 1 | $35B |
|
||
| Technology Manufacturing | 1 | $35B |
|
||
Price history
+2500.0% since first listed16 events — show timeline
- 2026-05-13 Listed $260,000 FORTMLS
- 2026-01-27 Price Changed $310,000 BEARMLS
- 2025-12-31 Price Changed $349,900 BEARMLS
- 2025-12-20 Price Changed $362,400 BEARMLS
- 2025-11-25 Price Changed $374,900 BEARMLS
- 2025-10-30 Listed $399,900 BEARMLS
- 2018-02-12 Sold (Public Records) $140,000 Public Records
- 2018-02-02 Sold (MLS) $140,000 NAPLESMLS
- 2017-11-24 Pending — NAPLESMLS
- 2017-11-22 Listed $140,000 NAPLESMLS
- 2011-02-24 Sold (MLS) $63,000 FORTMLS
- 2011-01-12 Price Changed $66,300 FORTMLS
- 2005-06-27 Sold (Public Records) $57,900 Public Records
- 2004-09-24 Sold (MLS) $21,000 FORTMLS
- 2004-08-31 Price Changed $22,500 FORTMLS
- 2004-06-24 Sold (Public Records) $10,000 Public Records
Property tax history
+4.5%/yrLatest (2025): $1,970 · +4.7% YoY. Source: county tax records.
Cash-flow waterfall
monthlySold comps — $/sqft
last 12 mo · ≤1 miLoading sold comps…